
1. Introduction
The global strength assessment (= safety assessment of hull girder) shall be done before conducting local strength assessment by checking buckling or collapse of primary structural elements such as plates and stiffened panels [1]. There are various types of safety assessment methods that exist. The numerical simulation based structural design, which ensures reasonable price enclosing actual cost and computational cost (or time) and relatively high accuracy, is gradually preferred to be applied for designing the infrastructures among other methods, i.e., experimental and analytical [2⇓-4]. Nowadays, the finite-element method (FEM), known as one of the powerful techniques, is preferred for performing structural analysis and design in general [5], while each classification society or shipyard also has its own in-house numerical simulation code that meets its own needs. In the present study, the ANSYS nonlinear finite element method (NLFEM), widely used in the various engineering fields, is adopted to understand the effect of mesh-size on the ultimate strength performance of flat and curved plates subjected to longitudinal compression.
Several studies on the ultimate strength behaviour, including the critical- and elastic buckling strength of plate elements, have been conducted in various ways over the past century. In particular, various types of empirical formulations have been proposed based on the effective width concept proposed by von Karman in the early 19th century, and verification of this concept has also been made through experimental and numerical studies [6⇓⇓⇓⇓⇓⇓⇓⇓⇓⇓⇓-18]. Recent advances in the concepts of plate-effectiveness evaluation are also summarised by Paik [19]. In addition, there exist many empirical formulations in predicting the ultimate strength of local structural components, i.e., the unstiffened panel as cited above and stiffened panel [20⇓⇓⇓⇓⇓-26], developed to date. Recently, Kim et al [27]. proposed an empirical formulation in predicting ULS of initially deflected plate elements subjected to longitudinal compression. Detailed technical reviews may be referred to by Cui and Mansour [7], Zhang [28], and Kim et al [4]. Besides, ISSC [5,29⇓⇓-32] also continuously put their efforts to verify the finite-element (FE) modelling techniques by conducting a wide range of benchmark studies in predicting ULS of ships and offshore structures.
The curved plates are also widely used in the SHORE structures such as onshore (civil), offshore (floating structures including subsea systems), nearshore (coastal) structures. In particular, several researchers have conducted several studies to understand the ultimate compressive strength characteristics of the curved plate [33⇓⇓-36,49]. Recently, Martins et al [37]. technically reviewed the thin-walled curved plates subjected to in-plane stresses. The empirical formulas in predicting the ultimate strength of the cylindrically curved panels are also provided by Tran [38,39], DNV [40], Martins [41] and Park [42].
When performing numerical analysis through FEM, the essential things that dealt with can be summarised as follows.
• Pre-processing technique: Modelling
• Element modelling (type, size, others); Material properties (type, characteristics); Boundary condition; Applied loading; Initial imperfection; and many others
• Processing technique: Analysis
• Post-processing technique: Data processing
It is recognised that modelling technique, including input data, should be considered as the most important part when we conduct structural analysis by FEM [43,44]. Most of the designs or research reports present the mesh convergence study results as an initial outcome. The selected mesh-size, rationally decided by the engineer's judgment, is applied to all scenarios to produce an outcome. In other words, it can be understood that the finite-element analysis (FEA), through the selection of irrelevant mesh-sizes, has a significant impact on its accuracy. We are aware that an even number of elements is recommended to implement the initial deflection shape accurately and maximum deflection in the plate's length and breadth directions, as shown in Fig. 1(a). In other words, the ULS can be overrated if odd numbers of elements are allocated, as illustrated in Fig. 1(b). This is because the numerical simulation is performed by assuming a maximum deflection that is less than the actual deflection, resulting in accuracy matters.
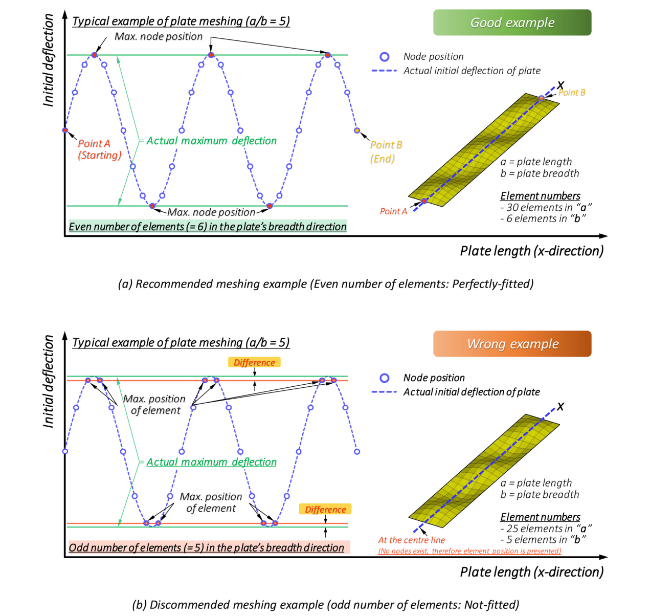
Fig. 1. How to allocate the number of elements in the plate by meshing? |
In the case of simply supported rectangular plate (= flat plate), the buckling half wave number in the longitudinal direction (m) can be decided based on given loading condition by Eq. (1.1), which can be applied when the shape of initial deflection is buckling mode. This can be simplified as presented in Eq. (1.2) by omitting the loading ratio term (σy/σx) when no compression in the transverse direction (σy) is applied [45]. It means that the applied loading component is solely longitudinal compression (σx). Based on Eq. (1.2), m can be determined.
For biaxial compression
$ \frac{\left(m^{2} / a^{2}+1 / b^{2}\right)^{2}}{m^{2} / a^{2}+\left(\sigma_{y} / \sigma_{x}\right) / B / b^{2}} \leq \frac{\left[(m+1)^{2} / a^{2}+1 / b^{2}\right]^{2}}{(m+1)^{2} / a^{2}+\left(\sigma_{y} / \sigma_{x}\right) / b^{2}}$
For longitudinal compression
$ \frac{a}{b} \leq \sqrt{m(m+1)}$
where, a/b = aspect ratio of the plate, m = buckling half wave number in longitudinal (x) direction. a = plate thickness, b= plate breadth, σx = longitudinal compression and σy= transverse compression.
There are two recommended methods for mapping the initial deflection shape into the modelled plate in FEM software. First, we can calculate buckling half wave number (m) by Eq. (1.2), and initial deflection (wo) can mathematically be expressed by the sinusoidal shape that is preferred to be adopted by meeting the plate edge's boundary condition with simply supported shown in Eq. (2.1). The obtained m by Eq. (1.2) can now substitute into Eq. (2.1).
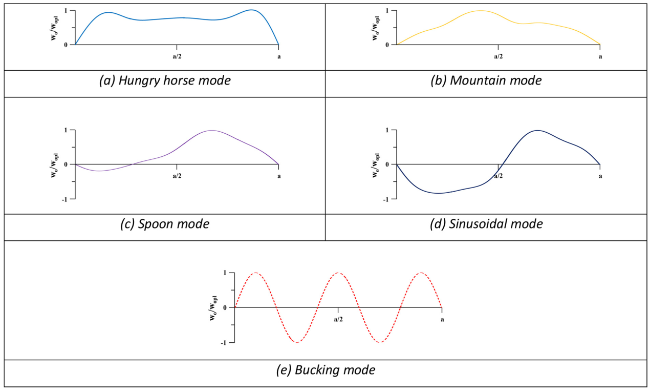
Furthermore, we can produce more complex shapes of initial deflection, i.e., hungry horse mode, mountain mode, spoon mode, sinusoidal mode, by taking superposition of sine functions in Eq. (2.2). The amplitude of the buckling mode initial deflection for longitudinal compressive loading is presented as Aom which decides the amplitude of initial deflection in the plate shown in Eq. (2.1). In addition, Bom can be expressed as a ratio between Aom and the maximum initial deflection (wopl) shown in Eq. (2.3). For the practical design purpose, Bom is assumed to 1.0, in general [45]. In the case of maximum initial deflection (wopl) values, it may be referred to Eq. (2.4) proposed by Smith et al [13].
$ w_{o}=A_{o m} \operatorname{Sin}\left(\frac{m \pi x}{a}\right) \operatorname{Sin}\left(\frac{\pi y}{b}\right)$
where, wo= initial deflection, Aom= amplitude of the buckling mode initial deflection for longitudinal compressive loading, a= plate length; b= plate breadth.
$ w_{o}=w_{o p l} \sum_{i=1}^{m} B_{o i} \operatorname{Sin}\left(\frac{i \pi x}{a}\right) \operatorname{Sin}\left(\frac{\pi y}{b}\right)$
$ A_{o m}=B_{o m} w_{o p l}$
where, Bom= welding-induced initial deflection amplitude normalised by maximum initial deflection (= wopl).
$ w_{\text {opl }}=\left\{\begin{array}{lc} 0.025 \beta^{2} t & \text { for slight level } \\ 0.1 \beta^{2} t & \text { for average level } \\ 0.3 \beta^{2} t & \text { for severe level } \end{array}\right.$
The other way is eigenvalue analysis which provides feasible mode shapes. We then normally select the first mode, known as the recommended shape requiring minimum potential energy to be deflected, and update the geometry by applying scale factor based on the assumed maximum initial deflection level shown in Eq. (2.4). It is also possible to adopt the different amounts of maximum initial deflection (wopl=b/200) proposed in Common Structural Rules (CSR) by IACS [46,47].
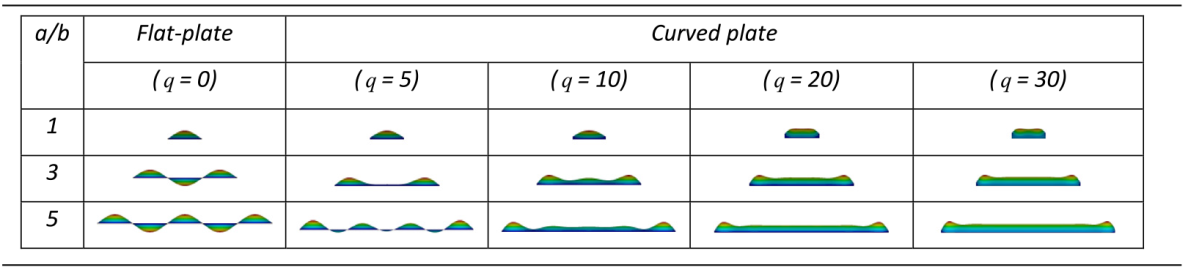
Therefore, both methods are available for flat plates, while curved plates or plates with higher nonlinearity are recommended to select eigenvalue analysis. The shapes of initial deflection for flat- and curved plates are discussed and shown in Table 1. Furthermore, it is encouraged to allocate 6 or 8 or 10 elements for meshing in the flat plate's breadth direction when we model the plate surrounded by longitudinal stiffeners by FEM. It depends on the engineer's judgement made by considering computational cost as well as the accuracy of the results.
Table 1. Typical examples of initial deflection shape of flat- and curved plates (Note: Scale varies). |
 |
This study's problem statement is the applicability of a similar number of elements (= 6, 8 or 10) used in flat-plate to the curved plate. Regarding this, the effect of mesh-size (or element numbers) on the ultimate compressive strength behaviour of flat- and curved plates is investigated and documented. Furthermore, reliable scenarios have also been selected by considering the effect of the plate's aspect ratio, flank angle, and plate slenderness ratio. Detailed scenarios adopted in this study can be found in Eq. (3).
where, a/b = aspect ratio (= 1, 3 and 5) by adopting fixed value of plate breadth (b = 830mm), t = plate thickness (t = 8, 14 and 28 mm which will generate 3.506, 2.003 and 1.002 of beta values closed to 3.5, 2.0 and 1.0, respectively), θ= flank angle (= 0o, 5o, 10o, 20o and 30o), σY= material yield strength (= 235 MPa), E= elastic modulus (= 205.8 GPa), NoE= Number of element in plate's breadth (= 6, 8, 10, 12, 14, 20 and 30).
2. Research procedure
This section introduces the detailed procedure of pre-processing of numerical analysis. Fig. 2 shows the definition of flat- and curved plates, which can be simply distinguished by flank angle. From here, the necessary geometric information and applied loading are provided. In the following section, processing (FE analysis) and post-processing are going to be delivered.
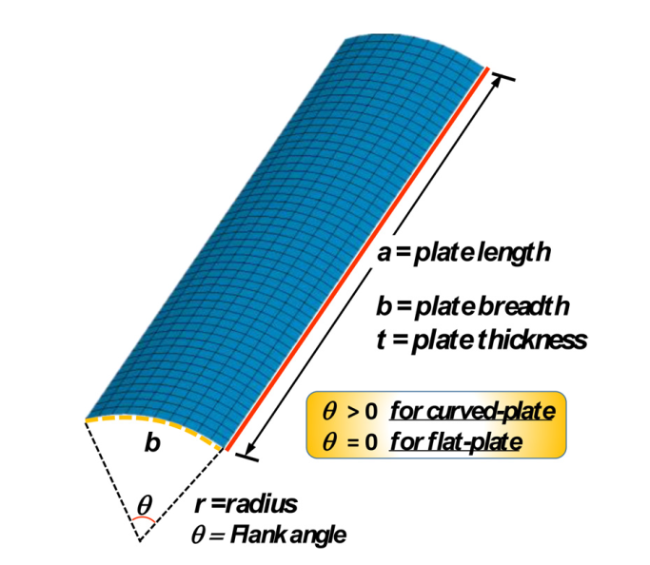
Fig. 2. Schematic view of to define flat- and curved plates. |
2.1. Consideration of mesh-size
2.1.1. Shape of the initial deflected plates: flat and curved
As mentioned earlier, simply supported flat-plate can mathematically be expressed by a sine function, and the same outcome can be obtained by eigenvalue analysis Table 1. shows typical examples of the initial deflection shape of flat- and curved plates by eigenvalue analysis. As would be expected, the shape of initial deflection for flat- plate is buckling mode, meaning that it can be rendered by Eq. (2.1) or made visible by eigenvalue analysis. In contrast, the shape of the initial deflection of the curve-plate does not fit by buckling mode. It seems that the hungry horse mode shape in Fig. 3(a) might suit the curved plate case shown in Table 1. In this regard, we conclude that eigenvalue analysis is recommended for the curved plate case, besides other types of initial deflection shape are presented in Fig. 3.
2.2. Generation of input data for ultimate strength calculation of numerical simulation
2.2.1. Material properties (Yield strength)
The material of MS24, known as mild-steel with 24kgf (or 235MPa) of yield strength (σY) and 205.8GPa of Elastic modulus (E), is only considered. This material is widely used in shipyards as a primary material, with HT32 (= 315 MPa) and HT 36 (= 355 MPa). The effect of material yield strength on the ultimate strength performance of flat- and curved plates under compression is not discussed further here.
2.2.2. Plate geometry
Details of geometric properties are illustrated in Fig. 2 for flat- and curved plates, respectively. The plate-element characteristics are presented as the plate slenderness ratio shown in Eq. (4). The β is a function of the plate's geometry and material properties. In general, the ultimate limit state (ULS) behaves as βincreased.
$\beta=\frac{b}{t} \sqrt{\frac{\sigma_{Y}}{E}}$
where, b = plate breadth, t = plate thickness, σY= material yield strength, and E= elastic modulus.
Kim et al [27]. provided probability density distributions (PDFs) of plate length, breadth and thickness information by collecting 3077 cases of the actual plate from commercial ships. They have provided 4150mm and 815mm of plate length (= a) and breadth (= b) as mean values, respectively, from the obtained probability density functions (PDFs). These scantlings of plate length and breadth are adopted as the fixed values in this study. Three plate aspect ratio cases (a/b = 1, 3 and 5) are considered. This means that three plate lengths (= 1 × b, 3 × b and 5 × b) are selected. In addition, three representative plate slenderness ratios (= 1.0, 2.0, and 3.0) are targeted by taking a plate thickness of 10, 14, and 28.5mm. Based on Eq. (4), three plate slenderness ratios can be calculated as 0.9841, 2.003, and 2.8047, which are not precisely the same value but close to 1.0, 2.0, and 3.0, respectively.
2.2.3. Flank angle
The flank angle is defined in Fig. 2 and can be presented as a function of the curved plate's breadth and radius.
$b=r \theta \text { or } \theta=\frac{b}{r}$
In the present work, 0 to 30 degrees of flank angles, i.e., 0 (flat-plate), 10, 20, and 30 (curved plates), were considered for the study purpose. Recently, Park et al [42]. highlighted a secondary buckling phenomenon observed at a 5° curved plate's slenderness ratio at 3.45. In this regard, 5 degrees is also considered in this study.
2.3. FE modelling by ANSYS nonlinear finite-element method (NLFEM)
It is recognised that the numerical simulation results are significantly affected by the modelling technique, and reliable and verified techniques, i.e., material, element types, loading, boundary condition and many others, are necessary. Especially, the element type and formulation selections are important to produce the actual structural behaviour of the structure, i.e., buckling, post-buckling, large deflection, plasticity effects, and many others. As informed, the ANSYS nonlinear finite element simulation code has been adopted to calculate the ultimate strength of the flat- and curved plates in this study. The shell element in FEM is widely adopted to reveal the abovementioned complex behaviours [49⇓-51]. Several ANSYS users adopted the shell 181 element, which is a 3D isoparametric quadrilateral element with four nodes and 6 degrees of freedom (DOF), to analyse the thin-walled structures [4,5,21,27]. As confirmed by many studies, shell 181 element, which provides reasonable outcomes, is adopted in this study.
In the case of the material properties adopted in FE simulation, a simplified bilinear stress-strain curve with no tangential angle (= no strain hardening effect considered) was used. This can be found in the ANSYS classical metal plasticity model, and it can be understood that stress levels do not allow to exceed yield strength as plastic strain increases. Therefore, the material curve (= perfectly plastic) can be defined by elastic modulus, yield strength information.
Finally, the arc-length method was applied in predicting the nonlinear buckling behaviour of the flat- and curved plates. Previous research [8] reported that the conventional Newton-Raphson method is challenging to accurately predict the complex structural collapse behaviour due to the stiffness matrix's singularity issue and diverge the solution. However, the arc-length method suits to obtain the nonlinear quasi-static or static solution of the unstable condition by tracking the complex buckling behaviours of the thin-walled plate, i.e., snap-back, snap-through, secondary buckling, and others. The detailed explanations of arc-length method may be referred to [52,53].
2.3.1. Mesh-size (or element number in plate's breadth direction)
It is now clear why the even number of finite-elements should be considered in the plate's breath and length directions by Fig. 1. More specifically, 6, 8 or 10 elements in Fig. 4(a) to (c) are recommended to be allocated in the plate's breadth direction to present a realistic shape of the flat plate's initial deflection, in general. However, those suggested number of elements (6, 8, and 10) enable to present nonlinear behaviours in a load-shortening curve, i.e., secondary buckling, snap-through, snap-back and others, may occur when curved plates in compression should be more thoroughly investigated.
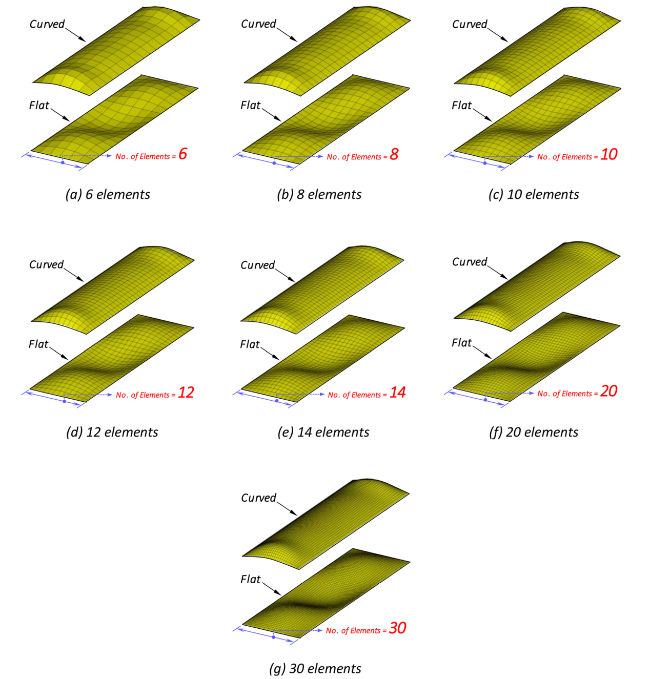
Fig. 4. Examples of the considered number of elements (or mesh-size) in plate's breadth direction (Typical scenarios with a/b = 3). |
In this regard, additional cases (12, 14, 20 and 30 elements), which enable an in-depth analysis of curved plates with elasto-plastic large deformation, are generated as shown in Fig. 4(d) to (g). The effect of the selected mesh-size or element numbers on the ultimate strength performance of flat- and curved plates in longitudinal compression will be discussed later.
2.3.2. Boundary condition
It is well-known that the plate edge condition welded by supporting stiffeners is neither simply supported nor clamped. Because the torsional rigidity of the stiffeners (= supporting members) attached at the plate edges is neither zero (0) nor infinite (∞) [2]. It may be recommended to accurately take into account the boundary condition for analysing the behaviour of plate under compression, including buckling and post-buckling behaviour [3].
However, it is challenging to consider the plate's actual torsional rigidity surrounded by support members. Therefore, simply supported boundary condition, which allows securing the additional safety margin, is widely used for FE analysis. Therefore, the simply supported boundary condition is adopted, and details may be referred to as Fig. 5.
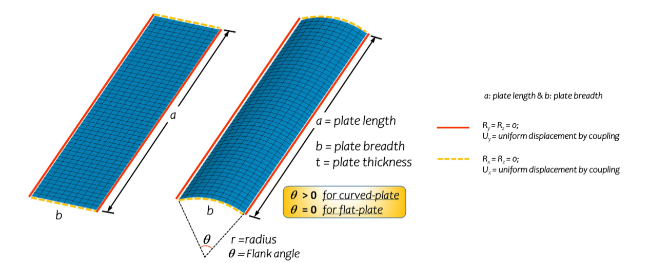
Fig. 5. Boundary condition adopted in the FE model of flat- and curved plates. |
2.3.3. Applied loading
The longitudinal compression caused by vertical bending moments is solely considered for the ultimate strength analysis of flat- and curved plates by ANSYS NLFEM.
2.4. Expected outcome: ultimate strength performance of the plate
The typical samples of the expected outcome for flat- and curved plates are presented in Fig. 6(a) and (b) by pointing out the ultimate limit state (ULS) as well as other states such as initial condition, proportional limit, and post-buckling state in the load-shortening curves. These ULS data for all scenarios were extracted from the obtained FE results by ANSYS NLFEM commercial simulation code.
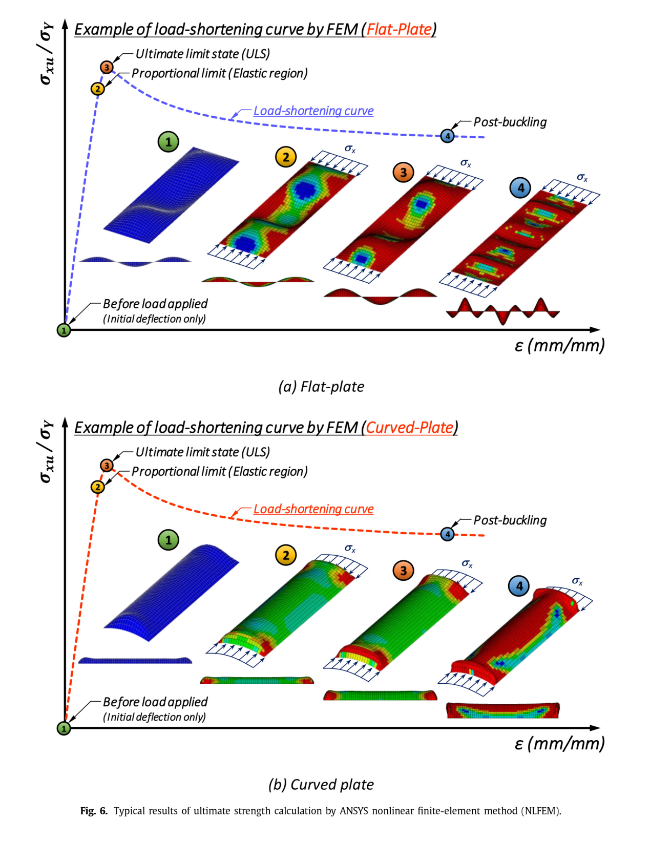
Fig. 6. Typical results of ultimate strength calculation by ANSYS nonlinear finite-element method (NLFEM). |
2.5. Verification of the FE technique
Before conducting FE simulations for the selected scenarios, we selected sample scenarios in Table 2 to validate the FE technique. They adopted ANSYS NLFEM, which is also employed in this study. The details of plate geometric and material properties are summarised in Table 2. For the reader's information, the original data can be referred to Figure 12 in the literature by Park et al [42].
Table 2. Selected sample scenario from Park et al [42]. for the validation of the FE modelling technique. |
| Comparison case selected from Park et al. (2018): Page 12 | Geometric properties | Material properties | Design parameters | |||||
|---|---|---|---|---|---|---|---|---|
| a (mm) | b (mm) | t (mm) | wopl (mm) | θ (o) | σY (MPa) | E (GPa) | β | |
| 5,000 | 1,000 | 15 | 0.15 | 5 | 352.8 | 205.8 | 2.7603 | |
Note: a = plate length, b = plate breadth, t = plate thickness, wopl= initial deflection of the plate, θ= flank angle, σY= yield strength, E = elastic modulus (= Young's modulus), β= plate slenderness ratio (=(b/t) $ \sqrt{\sigma_{Y} / E}$). |
The comparison results between Park et al [42]. and the present study are shown in Fig. 7. They provided load-shortening curves varying plate aspect ratio (a/b = 1.0 to 6.0) with flank angles of 5o and 45o under longitudinal compression. As informed, we selected a typical case illustrated in Table 2 from Park et al [42]. to verify the FE modelling technique in this study.
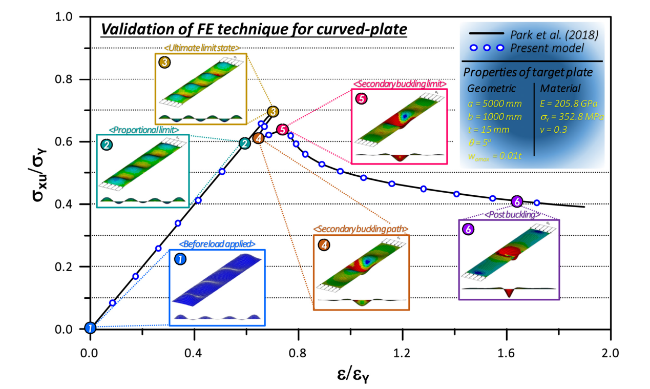
Fig. 7. Comparison of load-shortening curves of the curved plate between Park et al [42] and the present study. |
The obtained load-shortening curve was well-matched with the previous outcome, as shown in Fig. 7. In particular, we confirmed that nonlinear load-shortening behaviours, including the secondary buckling phenomenon, were captured by the present FE technique with good agreements. Details may also be referred to Table A1. Therefore, the remaining scenarios presented in Eq. (3) are simulated by ANSYS NLFEM, and the results are discussed in the following section.
We have also reviewed the analytical method in addition to the FE method validation. In order to calculate the stress-strain (or load-shortening) behaviour, it can be derived from the governing equation and application of the appropriate boundary conditions. Those techniques are nearly similar for the flat- and curved plates. They can be started from the two nonlinear governing differential equations, i.e., equilibrium & compatibility equations, of large-deflection plate theory as shown in (6.1), (6.2).
Equilibrium equation
$\begin{array}{l} D\left(\frac{\partial^{4} w}{\partial x^{4}}+2 \frac{\partial^{4} w}{\partial x^{2} \partial y^{2}}+\frac{\partial^{4} w}{\partial y^{4}}\right)-t\left[\frac{\partial^{2} F}{\partial y^{2}} \frac{\partial^{2}\left(w+w_{o}\right)}{\partial x^{2}}\right. \\ \left.-2 \frac{\partial^{2} F}{\partial x \partial y} \frac{\partial^{2}\left(w+w_{o}\right)}{\partial x \partial y}+\frac{\partial^{2} F}{\partial x^{2}} \frac{\partial^{2}\left(w+w_{o}\right)}{\partial y^{2}}+\frac{p}{t}\right]=0 \end{array}$
Compatibility equation for thin circular cylinder by Donnell (1934)
$\begin{array}{l} \frac{\partial^{4} F}{\partial x^{4}}+2 \frac{\partial^{4} F}{\partial x^{2} \partial y^{2}}+\frac{\partial^{4} F}{\partial y^{4}}-E\left[\frac{1}{R}\left(\frac{\partial^{2} w}{\partial x^{2}}-\frac{\partial^{2} w_{0}}{\partial x^{2}}\right)^{2}+\left(\frac{\partial^{2} w}{\partial x \partial y}\right)^{2}\right. \\ \left.-\frac{\partial^{2} w}{\partial x^{2}} \frac{\partial^{2} w}{\partial y^{2}}-\left(\frac{\partial^{2} w_{0}}{\partial x \partial y}\right)^{2}+\frac{\partial^{2} w_{0}}{\partial x^{2}} \frac{\partial^{2} w_{0}}{\partial y^{2}}\right]=0 \end{array}$
where, w,wo= added and initial deflections; F = Airy's stress function.
In the case of the cylindrically curved plate with all edges simply-supported condition, the initial (wo) and total deflection (w) functions can be expressed as shown in (6.3), (6.4).
$\begin{array}{l} w_{o}(\text {flat plate })=\sum_{m} \sum_{n} A_{o m n} \sin \left(\frac{m \pi x}{a}\right) \sin \left(\frac{n \pi y}{b}\right) \\ w_{o}(\text { curved plate })=\sum_{m} \sum_{n} A_{o m n} \sin \left(\frac{m \pi x}{a}\right) \sin \left(\frac{n \pi \theta}{\chi}\right) \end{array}$
$\begin{array}{l} w(\text {flat plate })=\sum_{m} \sum_{n} A_{m n} \sin \left(\frac{m \pi x}{a}\right) \sin \left(\frac{n \pi y}{b}\right) \\ w(\text { curved plate })=\sum_{m} \sum_{n} A_{m n} \sin \left(\frac{m \pi x}{a}\right) \sin \left(\frac{n \pi \theta}{\chi}\right) \end{array}$
where, b=Rχ, y=Rθ.
When Airy's stress function and the added deflection are defined, the in-plane stresses can be calculated as shown in Eq 7.1.
$\begin{aligned} \sigma_{x} & =\frac{\partial^{2} F}{\partial y^{2}}-\frac{E z}{1-v^{2}}\left(\frac{\partial^{2} w}{\partial x^{2}}+v \frac{\partial^{2} w}{\partial y^{2}}\right) \\ \sigma_{y} & =\frac{\partial^{2} F}{\partial x^{2}}-\frac{E z}{1-v^{2}}\left(\frac{\partial^{2} w}{\partial y^{2}}+v \frac{\partial^{2} w}{\partial x^{2}}\right) \\ \tau & =-\frac{\partial^{2} F}{\partial x \partial y}-\frac{E z}{2(1+v)} \frac{\partial^{2} w}{\partial x \partial y} \end{aligned}$
Assuming the plane-stress condition of the deflected plate element, the nonlinear strain displacement relationships can be summarised as follows (Eq 7.2)[54].
$\begin{array}{l} \varepsilon_{x}=\frac{\partial u}{\partial x}+\frac{1}{2}\left(\frac{\partial w}{\partial x}\right)^{2}-\frac{1}{2}\left(\frac{\partial w_{0}}{\partial x}\right)^{2} \\ \varepsilon_{y}=\frac{\partial v}{\partial y}-\frac{w}{R}+\frac{1}{2}\left(\frac{\partial w}{\partial y}\right)^{2}-\frac{1}{2}\left(\frac{\partial w_{0}}{\partial x}\right)^{2} \text { or } \frac{1}{R} \frac{\partial v}{\partial \theta}+\frac{1}{2}\left(\frac{1}{R} \frac{\partial w}{\partial \theta}\right)^{2}-\frac{1}{2}\left(\frac{\partial w_{0}}{\partial x}\right)^{2} \\ \tau_{x y}=\left(\frac{1}{R} \frac{\partial u}{\partial \theta}\right)+\frac{\partial v}{\partial x}+\left(\frac{1}{R} \frac{\partial w}{\partial x} \frac{\partial w}{\partial \theta}\right) \end{array}$
From here, the end-shortening displacement (u) can be obtained, and it can be solved by adopting the principle of virtual work or many other techniques. This can be referred to Park and Seo [55]. For deriving the average stress and strain relationship, they adopted virtual work with an incremental form, and the arc-length method was adopted. They concluded that the proposed analytical method could be applicable in predicting the nonlinear buckling strength of a curved plate. The details may be referred to Park and Seo [55].
3. FE analysis results and discussions
3.1. Stress distribution, strain energy and ultimate limit state (ULS)
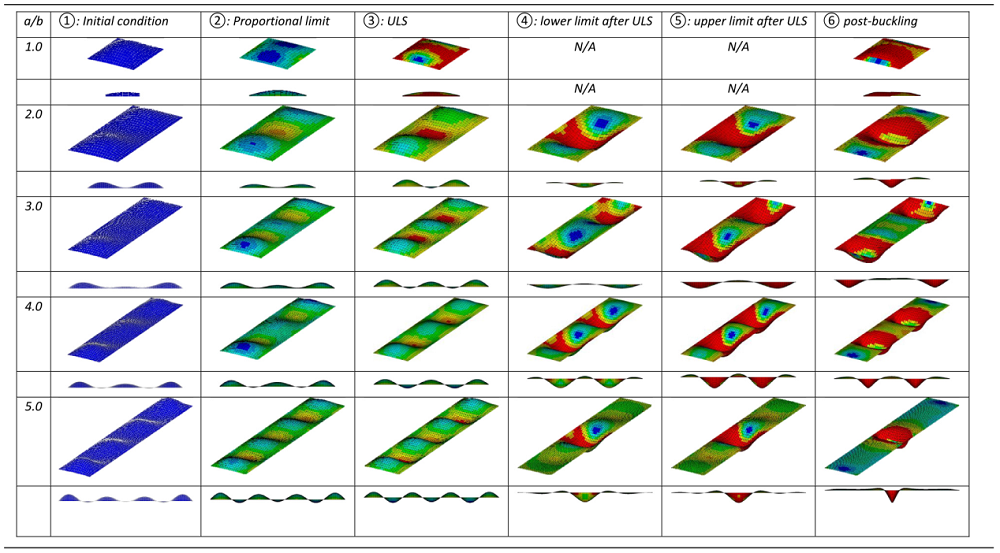
Table 3a shows the von-Mises stress distributions of the typical plates (a/b = 1, 3 and 5) having 30o of flank angle with 1.002 of plate slenderness ratio (=β) at ultimate limit state (= ULS) by considering the effect of element-sizes. The number of elements (= NoE) in length direction can be calculated by multiplying the plate's aspect ratio. The mesh aspect ratio (= mesh length / mesh breadth) maintains 1.0, which is mostly preferred condition in FEA. The von-Mises stress distributions show similarities across the board. As it would be expected, it can, however, be concluded that the fine mesh (or higher number of elements) tends to provide precise stress distribution, as shown in Table 3a. Nowadays, meshless method, NURBS, Isogeometric Analysis (IGA) technique and adaptive mesh technique and many others are widely used and highlighted by many researchers [56⇓⇓⇓⇓-61]. Nevertheless, it is common to solve various engineering problems using the traditional FEM technique, and for that, mesh convergence study is essential.
Table 3a. von-Mises stress views at ULS for typical plate (flank angle = 30, beta = 1.002). |
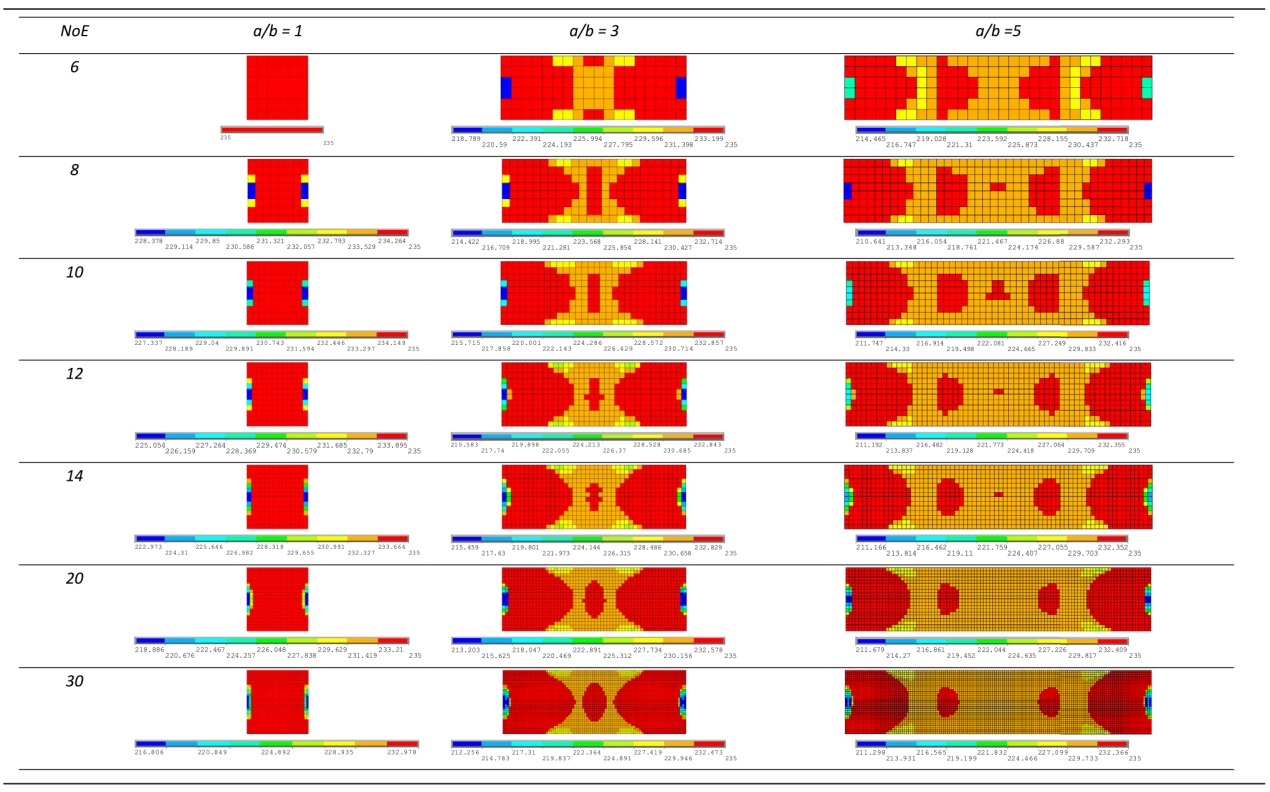 |
Note: NoE = Number of elements in the direction of plate breadth. |
In general, the von-Mises stress distribution in plates with various aspect ratios and element-sizes shows a similar shape, but stress and strain values obtained by the load-shortening curve should be compared. In the ships and offshore construction industry, structural and fatigue analyses are essential for the welded zone with complex structural shapes. In particular, the stress level on the welded zone due to repeated environmental loads within the design life shall be carefully checked during the design phase. Fine mesh is generally recommended in the welded zone, where the stress is expected to be concentrated, while the coarse mesh is used for general structural members. Sometimes, the mesh-size is revised by taking upscaling based on the engineer's judgement when the obtained stress level is too high (or the element's colour by von-Mises stress distribution is red). The stress level can be adjusted by meeting the safety criteria. With regards to this, the agreement between structural engineer or designer (= constructer) and customers (=owner), including surveyors (= classification society), should be required for obtained results whether it is acceptable or not.
In this typical case in Table 3a, it is observed that the effect of mesh-size does not significantly impact the ultimate strength performance of curved plate (β=1.002 & θ= 30o) as shown in Fig. 8(a) to (c). Moreover, stress concentration at the plate edges region is clearly observed proposed by von-Karman named as “effective width concept” [17,19,62,63]. Detailed results of ULS may be referred to in sections 3.2-3.4.
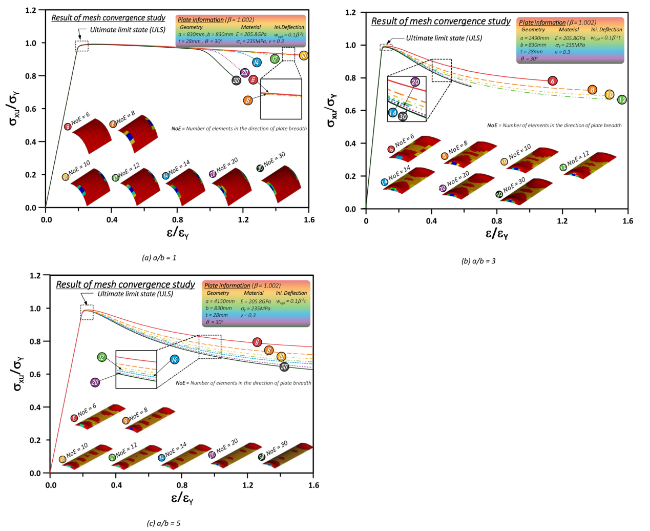
Fig. 8. Typical examples of the considered number of elements (NoE or mesh-size) in the plate's breadth direction (Flank angle = 30o, β= 1.002). |
While the strain energy, which represents the area under the obtained load-shortening curve, tends to behave differently as plate aspect ratio (a/b) increases observed in Fig. 8(a) to (c). When a/b is 1.0, there were no significant changes in load-shortening curves meaning that the effect of mesh-size can be neglected in this case. As a/b increased, such as 3.0 and 5.0, we observed that coarse mesh (or plate with a smaller number of elements) could overestimate strain energy capacity. When we consider optimised mesh or element-size for finite-element analysis (FEA), it is reminded. Until now, we targeted 1.002 of plate slenderness ratio, which presents a thick plate (t = 28mm).
The next research question should head to the thinner plates, generating a higher value βthan the 1.002 covered in Fig. 8 and Table 3a. Therefore, we compared von-Mises stress distributions for 2.003 and 3.506 of plate slenderness ratios in Table 3b and 3c, respectively. Besides, each load-shortening curve is compared in Fig. 9, Fig. 10. In general, a similar trend was observed with 1.002 of β.
Table 3b. von-Mises stress views at ULS for typical plate (flank angle = 30, beta = 2.003). |
 |
Note: NoE = Number of elements in the direction of plate breadth. |
Table 3c. von-Mises stress views at ULS for typical plate (flank angle = 30, beta = 3.506). |
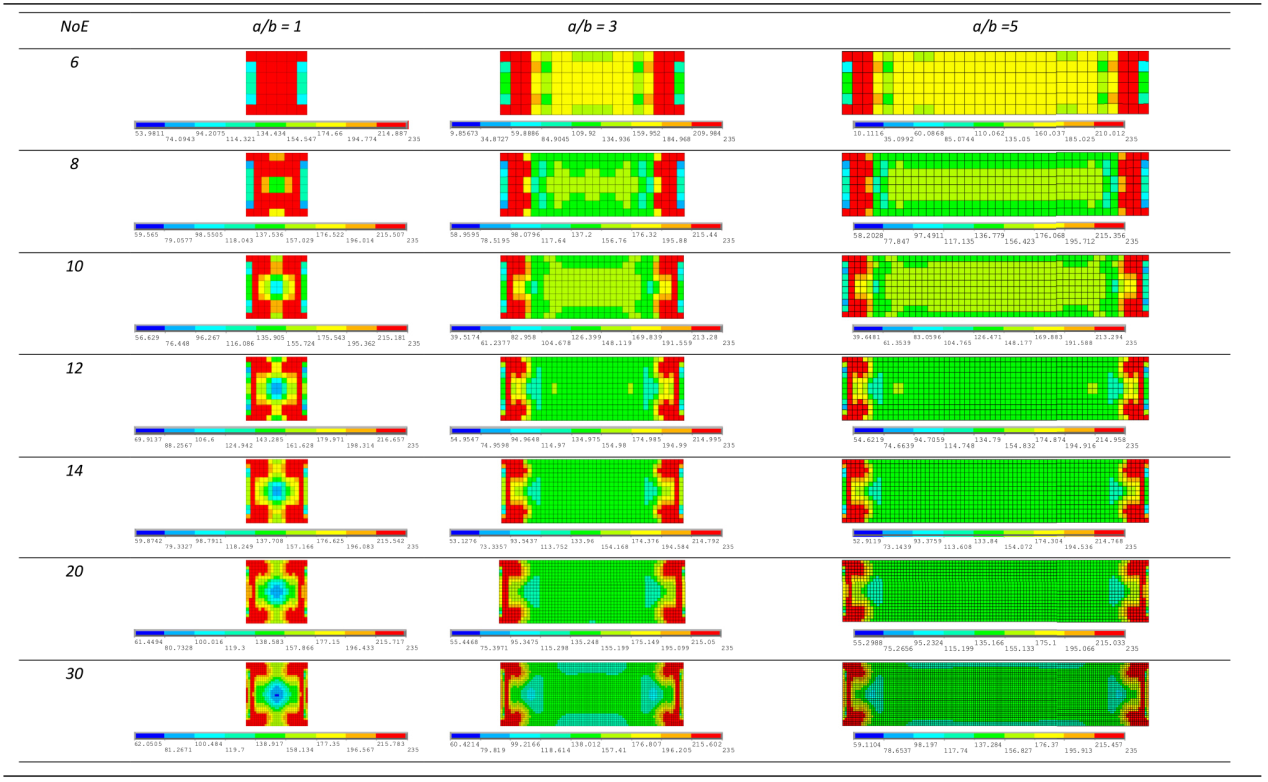 |
Note: NoE = Number of elements in the direction of plate breadth. |

Fig. 9. Typical examples of the considered number of elements (NoE or mesh-size) in the plate's breadth direction (Flank angle = 30o, β= 2.003). |
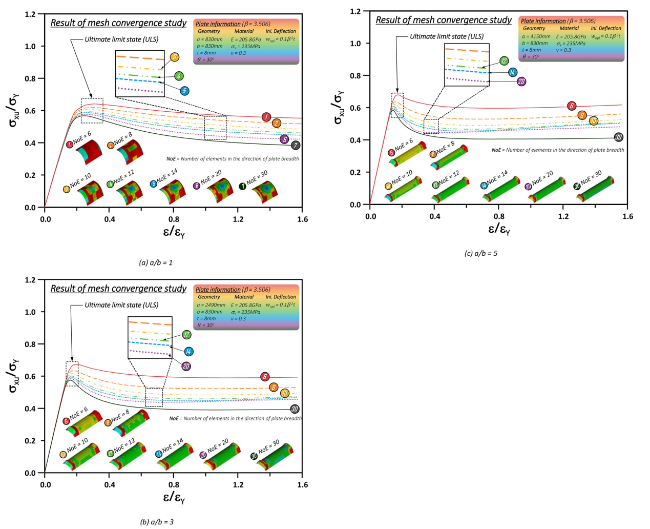
Fig. 10. Typical examples of the considered number of elements (NoE or mesh-size) in the plate's breadth direction (Flank angle = 30o, β= 3.506). |
It is observed from load-shortening curves that ULS tends to vary as the plate gets thinner (i.e., β: 1.002 → 2.003 → 3.506). This means that the difference of ULS between each mesh-size increases when the plate slenderness ratio gets higher. In addition, strain energy also depends on mesh-size. On the other hand, the mesh-size or element-size effect should be carefully taken into account for the numerical simulation by FEM. In this comparison, the plate thickness is solely changed for three plate aspect ratios (a/b = 1.0, 3.0 and 5.0 cases) by fixing other parameters consisting of plate slenderness ratio (β).
3.2. Effect of flank angle, plate aspect ratio, and plate slenderness ratio
Other research groups have widely studied the effect of flank angle on the ULS of the curved plate [34,39,41,42,64,65], so details may not be discussed further here. The effect of mesh-size or the number of elements on the flat- and curved plates defined based on the flank angle in Fig. 5 is investigated in this section. Flat-plate can be expressed when the flank angle equals zero, while the flank angle in a curved plate exceeds zero.
3.2.1. Reminder of the assumed condition and selected scenarios for outcome analysis
As would be expected, the ULS tends to change as the flank angle increases Table 4. shows the detailed investigation results by representing the effect of mesh-size (or the number of elements in plate breadth's direction = 6, 8, 10, 12, 14, 20 and 30 shown in Fig. 4) on the ultimate strength of flat-plate (θ= 0) and curved plate (θ= 5, 10, 20 and 30) under longitudinal compression. Three levels of plate slenderness ratio (β= 1.002, 2.003 and 3.506) are considered by changing plate thickness (t= 8, 14 and 28 mm) and plate length (a= b, 3b and 5b) while other parameters such as plate breadth (b= 830 mm). Material properties (E=205800 MPa and σY=235 MPa) are considered as a constant value.
Table 4. Comparison of ULS results considering mesh-size effect. |
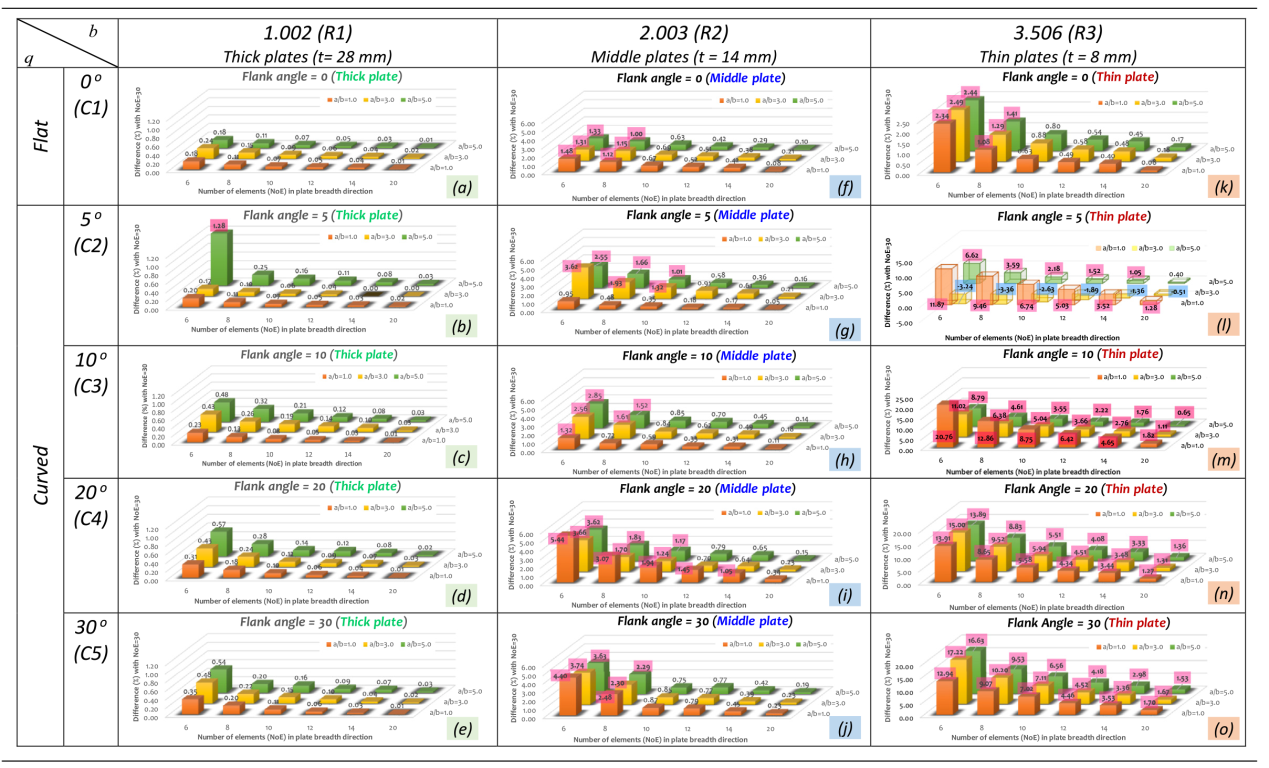 |
Note: R1 to R3 represent row 1 to row 3, C1 to C5 represent column 1 to column 5. |
Prior to investigating the details, it is required to remind that the term of the number of elements (NoE) in this study represents how many elements are allocated in the plate's breadth direction, affecting the mesh-size. Visualised NoE information may be referred to as Fig. 4 and Table 3. We assumed that the obtained ULS results by 30 of the number of elements in the plate's breadth direction, namely NoE (30), can be considered as a refined outcome by fine mesh. The histograms presented in Table 4 show the relationship among NoE (horizontal-axis), plate aspect ratio (vertical-axis) and difference (%). In the case of difference (%), the ratio can be calculated between ULS by each NoE and ULS by NoE (30). Therefore, the histogram height gives a useful guide for structural engineers in determining the relevant number of elements for their FE analysis. In this study, we set 1.0% of the ULS difference with NoE (30) as a criterion. For example, the difference exceeding 1.0 % is highlighted as red, shown in Tables 4(b), (f) to (o). As an example of not following the general trend by showing lower ULS than NoE 30 results, it is highlighted in blue presented in Table 4(l). All calculated differences are shown in Table 4 so that engineers could decide mesh-size based on their judgement.
In addition, based on plate slenderness ratios selected, we categorised three plate types based βsuch as think (= 3.506), middle (= 2.003) and thin plates (1.002). Therefore, we investigate the effect of flank angle in this section and the effect of plate slenderness ratio (β), and plate aspect ratio (a/b) will be discussed further in the next section.
In the following sections, i.e., 3.2.2 to 3.2.4, the ultimate limit state (ULS) difference between each result and 30 of the number of the element (NoE) in the plate's breadth direction will be mainly discussed. Therefore, the difference will represent the following Eq. (8). For example, when the β is 2.003, the ULS difference between NoE (30) and NoE (6) of flat-plate with a/b=5 is 1.33, as shown in Table 4(f).
The difference with NoE (30)
$\Delta(\text { Difference }, \%)=\frac{U L S_{\text {NoE (individual })}}{U L S_{\text {NoE (30) }}} \times 100$
Note: NoE (30) represents 30 elements in the plate's breadth direction.
3.2.2. Effect of slenderness ratio (β)
In the case of plate slenderness ratio effects on ULS of flat- and curved plate, it can be seen by each column representing the changes of thickness. For example, the βeffects on ULS of flat-plate can be investigated by comparing column 1 (C1) shown in Table 4(a), (f) and (k). In the same manner, the βeffects on ULS of curved plates may be referred to as C2 to C5.
We found out that mesh-size or NoE significantly affects ULS when the plate gets thinner from the observation. This should be carefully taken into account when engineers decide the plate's mesh-size for FE analysis. In the flat-plate case, the ULS difference tends to increase as the plate thickness becomes thin or as βincreases. In particular, this should be carefully reminded when we model the thin-plates, as shown in Table 4(k).
A similar trend is captured in curved plates shown in C2 to C5. The larger the flank angle, the greater the ULS difference. Here, two things should be highlighted. If the plate is thick (β= 1.002), referred to as R1 in Table 4, mesh-size might not affect the ULS of the flat and curved plates significantly. As shown in R1, differences were less than 1.0% except for one case at 5o of flank angle case. Even we consider this case, NoE (8) or NoE (10) in the plate's breadth direction could be recommended for ULS assessment of flat- and curved plates under longitudinal compression. However, middle and thin plates should carefully take into account for element-number effect, as shown in R2 and R3. Highlighted boxes by red may help readers understand the ULS difference in a positive value, while blue represents a negative value. A similar trend captured for those middle (β=2.003) and thin plate (β=3.506) cases,
In conclusion, NoE (10), which is generally used, is applicable to flat and curved plate meshing. When the curved plate is getting thinner, NoE (20) might be recommended to minimise the difference with NoE (30).
3.2.3. Effect of plate aspect ratio (a/b)
In general, the effect of plate aspect ratio (a/b) was not significant from the calculated difference (Δ) shown in thick plate (= R1). In the case of middle (= R2) and thin (= R3) plates, similar trends have been observed, but the case of 5o of flank angle should be carefully taken into account. A secondary buckling phenomenon was captured by FE simulation in a curved plate with a flank angle of 5o in Park et al. [42]shown in Fig. 7. which can be considered as one of the good examples. They mentioned that the fluctuation of ULS is captured in a curved plate with a flank angle of 5o. This may be caused by the deflection shape, which changes continuously shown in Fig. 7. The initial deflection shape before we apply the compression (❶) is changing slightly to the down when it reaches proportional (❷) and ultimate limit states (❸) by maintaining the half-wave number. A significant change is captured when it follows the secondary buckling path by changing deflection shape (❹), and progressive collapse behaviours can be observed in the post-buckling region (❺ and ❻). The fluctuation behaviour in Table 4(l) when a/b = 3.0 can be considered the effect of lower flank angle and initial deflection shape.
3.2.4. Effect of flank angle (θ)
In 3.2.2 and 3.2.3, we have discussed the typical flank angle (= 5o), which generates the fluctuation behaviour of the ULS by taking the 2nd buckling path.
Apart from typical flank angle (= 5o) cases, it is generally observed that the greater the flank angle, the more significant the difference (Δ) defined in Eq. (5). As mentioned earlier in Section 3.2.2, the effect of mesh-size or NoE is not significantly affected when the plate is getting thicker. The initial deflection shape can explain this.
The initial deflection shape can be obtained by eigenvalue analysis with a geometry update method based on the assumed amount of initial deflection of the plate (wopl=0.1β2t) in ANSYS NLFEM. Also, buckling mode shape and hungry horse mode shape of initial deflections are obtained for flat- and curved plates, respectively. In this regard, curved plate (θ>0) tends to have relatively significant differences compared to flat-plate (θ=0).
As would be expected, the thinner plate could be initially deflected easier than the thicker plate. Regardless of the plate's thickness, flank angle and ULS difference tend to increase together, except for a few cases.
3.3. Additional investigation on the effect of mesh-size at specific conditions
Apart from the above results shown in Sections 3.1 and 3.2, the effect of element (or mesh) size is investigated further at the specific conditions such as lower flank angle, which generates snap-back, snap-through or secondary buckling. Three specific scenarios are selected based on the manual scenario selection procedure because the specific cases, shown in Fig. 11(a) to (c), do not always occur.
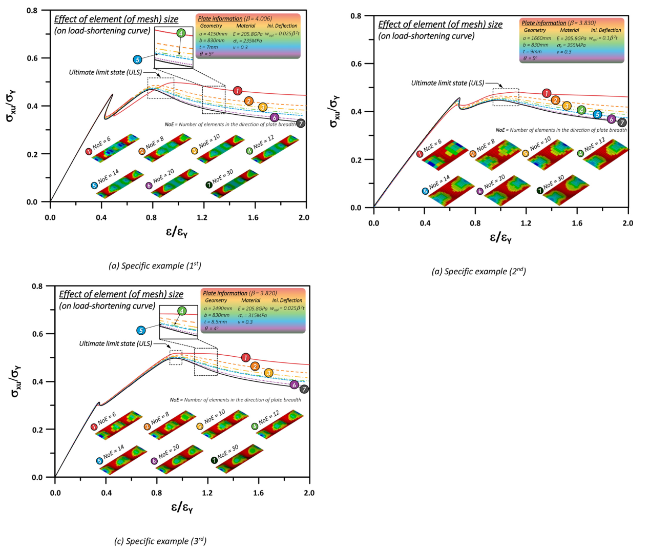
Fig. 11. The effect of NoE on the load-shortening curves of the curved plate at specific conditions (i.e., lower flank angle with curved plate which generates snap-back, snap-through, secondary buckling etc.) |
As would be expected, the following conclusions have been obtained.
• As the number of the element (NoE) increases, strain energy (= area under the load-shortening curve) decreases. This means that the structural designer should take into account the effect of number of elements or mesh-sizes when we conduct the FE model for curved plate.
• Different NoE may express the similar shape of load-shortening curves of the curved plate at the specific conditions, i.e., lower flank angle with curved plate, which generates snap-back, snap-through or secondary buckling phenomenon.
• In order to select the reliable number of the element, at least 10 NOE or more might be needed.
In this simplified parametric study, a limited number of cases are discussed and investigated to consider complex behaviour such as snap-back, snap-through or secondary buckling. Therefore, additional studies are recommended to be conducted further in the future.
4. Concluding remarks
A piece of helpful information in selecting the appropriate size of mesh or number of the element (NoE) for both flat- and curved plates are documented by conducting the parametric study. In total, 315 reliable scenarios in Eq. (3) were adopted to consider the effects of geometric (= plate aspect ratio, plate slenderness ratio, and flank angle), material (= material yield strength and Young's modulus) properties together with finite-element size (= NoE in plate's breadth direction). An essential tip is how to allocate the number of finite-elements in the plate, which should be able to accurately and smoothly implement the initial deflection shape and maximum deflection in the plate's length and breadth direction highlighted in Fig. 1.
Based on assumed NoE cases in Fig. 4, a comparison of studies in terms of the ultimate limit state (ULS) was conducted in detail. The obtained outcomes and insights are summarised as follows.
Outcomes of this study
• [Effect of plate aspect ratio] It is found that mesh-size or NoE significantly affects ULS when the plate gets thinner. NoE (10), which is generally used, is applicable to flat and curved plate meshing. When the curved plate is getting thinner, NoE (20) might be recommended to minimise the difference with NoE (30).
• [Effect of plate slenderness ratio: Thick vs. Middle vs. Thin plate] In general, the effect of plate aspect ratio (a/b) was not significant from the calculated difference (Δ) shown in thick plate (= R1). In the case of middle (= R2) and thin (= R3) plates, similar trends have been observed, but the case of 5o of flank angle should be carefully taken into account.
• [Effect of flank angle] Apart from the typical flank angle (θ=5), it is generally observed that the greater the flank angle, the more significant the difference (Δ) defined in Eq. (5). This means that additional consideration may be required as the flank angle increases. The effect of mesh-size or NoE is not significantly affected when the plate is getting thicker. Details may be referred to as Table 4.
Limitation of this study & Further study required
• In this study, only three (3) plate thicknesses, such as 8, 14, and 28mm, were selected in Table 4. Addition scenarios of plate slenderness ratio could be considered by selecting the different thicknesses of the plate.
• The effect of secondary buckling behaviour should be further investigated how and when it occurs. The condition that causes secondary buckling should also be studied by investigating the effect of initial deflection shape, amount, plate thickness, material properties, applied loading, boundary condition, and others.
• In this study, the 1:1 mesh aspect ratio, mostly preferred by FE engineers, is only considered. Different mesh-aspect ratios and element types, and formulations can also be investigated further.
Declaration of Competing Interest
The authors declare that they have no known competing financial interests or personal relationships that could have appeared to influence the work reported in this paper.
Acknowledgments
This work was supported under the framework of international cooperation program managed by the National Research Foundation of Korea (NRF-2022K2A9A2A23000266). This study is also supported by the start-up funding provided by Seoul National University. Some part of this study has been presented in MSc final report by Mr Im-jun Ban, supervised by Dr Do Kyun Kim, when he studied at Newcastle University.
