
1. Introduction
Energy is an indispensable factor in human life. Because of energy depletion, geopolitical-induced energy crises and demands for environmental protection, many countries have begun to seek new energy sources as supplements to traditional fossil energy. Ocean energy has attracted attention due to its high energy density and renewable characteristics. The production of renewable energy from multiple sources, including ocean waves, is key to satisfying the increasing demand for energy without further increasing pollution. To achieve a cost-efficient solution for harnessing wave energy, key stakeholders in the commercial wave energy market have unanimously advocated the grouping of multiple wave energy converters (WECs) into wave parks with specific unit layouts; see Ocean Energy Forum [1] and Al Shami et al. [2].
Many wave energy converter concepts are under development, such as oscillating water column devices, overtopping devices, and point absorbers. The point absorber is one of the most prevalent archetypes because it can harvest wave energy from all wave directions. It can also be efficiently used and installed in wave parks. The shape of wave parks requires careful design—hydrodynamic interaction effects (e.g., absorption, radiation, and diffraction between WECs) significantly influence the power performance of the whole wave park. This was shown by Ringsberg et al. [3] and Göteman et al. [4], who compared WECs’ performance and levelized cost of energy (LCoE) for different candidates of wave park designs and dimensions. Shao et al. [5] compared and discussed the power performance and LCoE of three different wave park layouts, including two 6-WEC arrays and one 10-WEC array. It was found that each layout had pros and cons under different environment conditions, for different incoming wave directions and using different WEC versions. However, the influence of the WEC version and wave park layout on mooring line fatigue damage was not explored. Other factors, such as environment conditions, incoming wave direction and WEC distance also affect the durability of the mooring system but have not been systematically evaluated for the wave parks studied in previous work by Shao et al. [5].
Thies et al. [6] and Qiao et al. [7] showed that the amount of fatigue damage accumulated by mooring lines in a wave park is influenced by interaction effects because the axial mooring force is directly dependent on the motion of the WEC units The design of the mooring system should therefore take into account both wave park layout and fatigue damage. According to Johanning et al. [8], the hydrodynamic interaction between WEC units is related to the unit array layout, the mooring arrangement, and the material properties of the mooring lines. The structural responses of mooring lines to such interactions are usually non-linear, see, e.g., Johanning et al. [9]. Given the nonlinearity of the hydrodynamic interactions and moorings, fatigue damage is case-dependent and deserves a thorough investigation before proceeding with on-site installation.
Moorings account for a significant share of the LCoE. For example, approximately 10% of the capital costs of a WEC installation were allocated to moorings, according to Dalton et al. [10]. This highlights the importance of the mooring design and installation, which should have high safety standards and be economical. Cost optimization for mooring solutions is therefore in high demand, as investigated by Thomsen et al. [11].
Moorings have been studied for a single generic point-absorber WEC using the frequency domain method described by Fitzgerald and Bergdahl [12]. They showed that moorings can produce either beneficial or detrimental effects on power output performance, depending on their design and installation. As found in a numerical study for a single WEC by Pols et al. [13], the damping coefficient of moorings is critical to influencing WEC motion. Since single point-absorbers are nondirectional in the horizontal free surface of water, the moorings in these studies were found to be insensitive to wave direction. Wave energy converter buoys moored independently and with connections between buoys were studied by Oikonomou et al. [14] and Ringsberg et al. [15]. These two strategies were found to be equivalently effective in responding to buoy motion. However, the independent mooring strategy is more expensive than the shared mooring strategy. The latter is therefore more economically attractive, as reported by Touzon et al. [16].
Waves4Power AB (see www.waves4power.com for a description of the WEC technology) has developed several generations of wave energy heaving point absorbers called WaveEL™. A full-scale prototype of WaveEL 3.0 has been tested in Runde, Norway, see Fig. 1. The newest generation WaveEL 4.0 has, compared to 3.0, a longer water tube and a larger buoy diameter; however, the mooring system is the same, i.e., unchanged. These geometric modifications were made in consideration of the ease of installation in wave parks and the robustness of structural and hydrodynamic performances. In previous studies, WaveEL 3.0 has been thoroughly studied in terms of the single-unit WEC performance, the array interaction effects, the fatigue life of mooring lines [17], the mechanical characteristics of power cables [18], and the effect of biofouling on moorings and cables on fatigue life and power performance [19]. For the new generation WaveEL 4.0, it is of interest to quantitatively and qualitatively clarify the extent of the improvements introduced by the geometric modifications. Since the interaction between waves and the WEC structure is nonlinear, it is not straightforward to simply extrapolate the power and mooring line fatigue performance data of WaveEL 3.0 for the prediction of WaveEL 4.0.
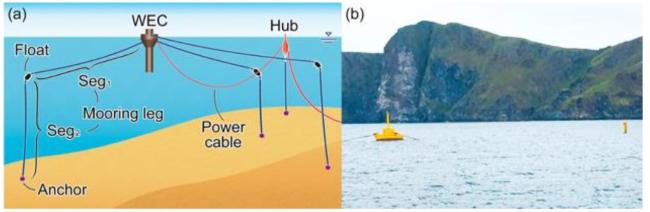
Fig. 1. (a) Schematic layout of the WaveEL 3.0 system, and (b) photograph of the full-scale installation in Runde, Norway. |
The purpose of this study is to present a systematic analysis of the single unit of WaveEL 4.0 and compare it with WaveEL 3.0 to address the pros and cons of the geometric modifications regarding hydrodynamic power performance, motion response, and mooring force responses. The benefit of installing several WEC units in wave parks is simulated, analysed and discussed. By comparing a single-unit WEC's performance with the collection of multiple units in a park, interaction effects on power performance and the accumulated fatigue damage of the moorings, are studied. A parameter study is presented where the distance between the WECs in the wave park is varied, as well as the wave encounter direction and irregular sea state conditions.
Section 2 presents the simulation models and evaluation methods. It also includes a description of the studied WECs and wave park layout. Section 3 presents an analysis of the results from the numerical simulations with single-unit WEC in the frequency domain and fully-coupled simulations in the time domain, whereas Section 4 presents the analysis of the results from fully-coupled simulations in the time domain for WECs installed in wave parks. The conclusions of the study are presented in Section 5.
2. Simulation models and evaluation methods
2.1. Description of the WEC systems
Fig. 2 presents the two generations of Waves4Power's WEC WaveEL used in the study. As shown in the figure, WaveEL 3.0 has a shorter water tube and less wide buoy than WaveEL 4.0. The upper part of the buoy of the former generation has a cylindrical shape, whereas the upper part of the buoy of the new generation is a prism with nine edges. In Fig. 3, the WEC system for both generations of WECs, i.e., the WEC and its moorings, is illustrated. The taut mooring system consists of three mooring legs evenly distributed and attached around the outer rim of the WEC buoy. Each mooring leg consists of two sections with a submerged floater positioned in the connection between them. The point at which a mooring line connects to the WEC buoy is called the fairlead. The anchor on the seabed is a gravity anchor made of concrete; it is not included in the numerical simulation model. Fig. 4 and Table 1 present the geometric characteristics and main properties of both generations of WECs, the mooring lines, the floaters, and their PTOs. Note that the water depth made it possible to use identical mooring system configurations for this type of WEC and its two generations presented in this study.

Fig. 2. (a) WaveEL 3.0, and (b) WaveEL 4.0. |
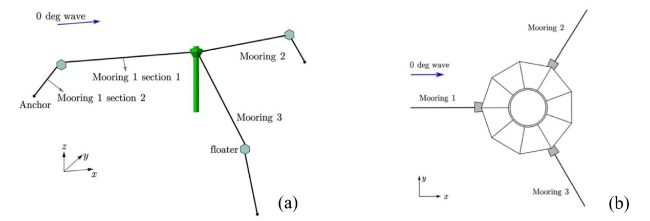
Fig. 3. (a) Mooring line configuration, and (b) the shape of the upper part and mooring line fixing locations. The protruded grey blocks indicate the fairleads. |
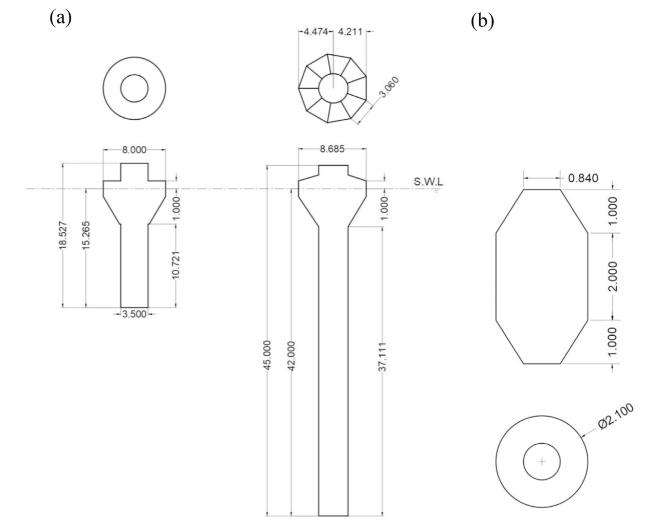
Fig. 4. Profile view and geometrical dimensions of (a) the WaveEL 3.0 and 4.0 WEC buoys, and (b) the floater [m]. |
Table 1. Basic properties of the WaveEL WEC systems. |
| Property | WaveEL 3.0 | WaveEL 4.0 |
|---|---|---|
| Mass, Mw [kg] | 140.0 × 10³ | 217.0 × 10³ |
| Draft, Dw [m] | 15.3 | 42.0 |
| Centre of gravity, COGw [m]a | −1.9 | −10.6 |
| Roll inertia relative to COGw, Ixx [kg × m2] | 2.55 × 10⁶ | 5.79 × 10⁷ |
| Pitch inertia relative to COGw, Iyy [kg × m2] | 2.55 × 10⁶ | 5.79 × 10⁷ |
| Depth of the anchor [m] | 50.0 | 50.0 |
| Radius of the anchor [m] | 160 | 160 |
| Height of the fairlead (from still water level) [m] | 1.0 | 1.0 |
| Pretension force at the fairlead [N]b | 47.0 × 10³ | 47.0 × 10³ |
| Dry mass of each mooring section [kg/m] | 4.900 | 4.900 |
| Submerged weight of each mooring section [N/m] | 35.868 | 35.868 |
| Nominal diameter of each mooring section [m] | 0.08 | 0.08 |
| Axial stiffness of mooring sections [N] | 701.671 | 701.671 |
| Length of section 1 [m] | 105.0 | 105.0 |
| Length of section 2 [m] | 40.0 | 40.0 |
| Mass of the floater [kg]c | 2700 | 2700 |
| Height of the floater [m] | 3.6 | 3.6 |
| Volume of the floater [m3] | 9.0 | 9.0 |
| Power Take Off (PTO) system damping, BPTO [N × s/m] | 40.0 × 10³ | 50.0 × 10³ |
aThe origin of the reference Cartesian coordinate is placed in the plane of water surface at the geometric centre of the WEC buoy, when it is in its unloaded neutral position. bStill water conditions. cThe COG of the floater is located at the geometrical centre of the floater. |
As described in Section 1, the same mooring system with identical installation configurations is applied to WaveEL 3.0 and 4.0. To avoid snap loads in the mooring lines, the mooring system is designed to always be in tension by a pretension load and the submerged floaters. The material properties of the polyester mooring lines are referred to in the study by Yang et al. [17]. According to their study, the axial load of the mooring line varying with respect to the relative elongation is shown in Fig. 5, and this characteristic was used to model the moorings in the current study.
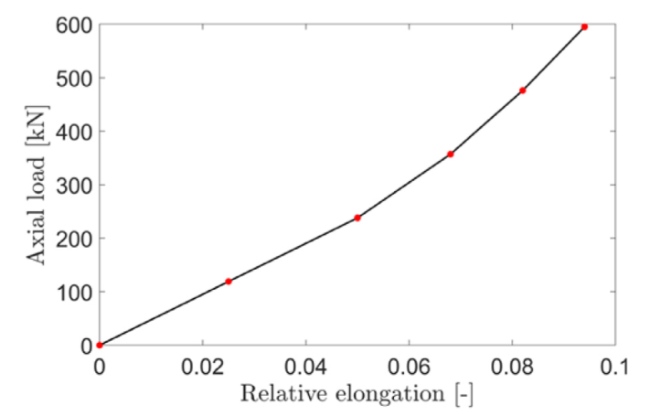
Fig. 5. Axial load of the polyester mooring varying with relative elongation, from Yang et al. [17]. |
2.2. Description of the numerical model
The numerical models were developed using the data presented in Section 2.1 and the commercial software package DNV SESAM [20]. SESAM was used to simulate the hydrodynamic and structural response of the WEC systems. A numerical analysis combines the boundary element method to simulate and solve the potential flow theory for the wave structure interaction and the finite element method to simulate and calculate the motions and structural responses of the mooring lines.
Owing to the mechanical coupling between the WEC and the slender mooring line structures, a fully-coupled simulation procedure in the time domain was adopted. The fully-coupled procedure simultaneously solves the equation of motions of the WEC buoy and the mooring lines using time-domain analysis, and thus the motion and force of the slender structures implicitly influence the instantaneous dynamics of the WEC buoy and vice versa. The coupled simulation model and procedure used in the study are described by Yang et al. [17]. HydroD [21] was used for frequency-domain analysis. The motion responses of the WEC were solved in SIMO [22], whereas the hydrodynamic and structural analyses (mooring line dynamic analysis) of all components were performed in RIFLEX [23]. In summary, this can be briefly described as follows: in the first step of a numerical simulation, the hydrodynamic response was calculated in the frequency domain to obtain the added mass and added damping using HydroD. Then, the frequency-dependent added mass and damping were condensed as a retardation function, and the effect of mooring forces was added to the equation system. The equation system was solved with fully-coupled simulations in the time domain, for which SIMO and RIFLEX were utilized.
A WEC subjected to environment loads, such as waves, ocean currents and winds, shows varying motion with six degrees-of-freedom. Its motion induces cyclic axial forces in the mooring lines, resulting in the accumulation of fatigue damage for every load cycle. To better estimate the fatigue life of mooring lines, the equations of the WEC's motions and the mooring line forces can be solved simultaneously using a fully coupled method. According to Yang [24] are more accurate results expected with the fully-coupled method than with an uncoupled method—not only does the mooring force influence the motion of the WECs but the motion of the WECs, in turn, affects the mooring force.
The numerical models of WaveEL 3.0 and 4.0 were built to be identical except for the different dimensions and properties of the buoys; see Section 2.1. Each floater in the mooring system was modelled as a nodal body, i.e., it only added concentrated mass, weight or buoyance forces to the system while having no motion degrees of freedom by itself. In addition, the optimal condition for power absorption is when the WEC is at resonance. This effect happens when the PTO damping, BPTO [N × s/m], is equal to the hydrodynamics damping, see Alves [25]. In this study, the PTO system was simplified as a linear damper, where the PTO damping values for both WECs are presented in Table 1.
2.3. Array layout of wave parks
The array layout of the wave parks is shown in Fig. 6; it was selected from three favourable layouts that were presented in a previous study by Shao et al. [5], in which it showed a preferable LCoE. The numbering of the mooring lines in Fig. 6 follows the rules that the first number after the letter ‘M’ stands for the numbering of the WEC that the mooring belongs to and the second number stands for the numbering of each mooring. The fatigue life of its mooring lines is of great interest as it enables its performance to be estimated more systematically.
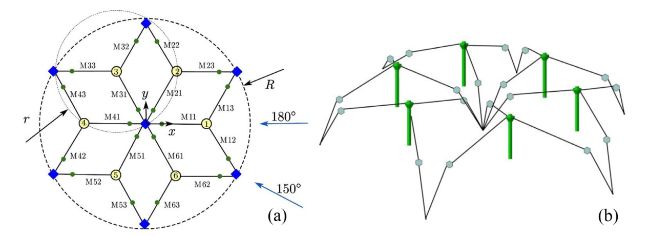
Fig. 6. The Hex1 array layout was proposed by Shao et al. [5]: (a) top view, and (b) side view. The yellow circular markers containing numbers represent the wave energy converters, the blue diamonds represent the anchors, and the small green dots represent the floaters. Each mooring line is numbered. Two wave incoming directions 180° and 150° are also indicated. |
The array layout contains 6 WECs. To reduce costs, the central anchor is shared by all WECs. The distance between each WEC varied between the simulations - 80 m, 100 m, and 120 m - with the length of the horizontal mooring line (section 1) changing accordingly, keeping the draft of the floaters similar to the single-unit WEC installation presented in Section 1. The radii (r, R) in Fig. 6 for the three hexagon-shaped arrays were, for the WEC distances 80 m, 100 m, and 120 m, set to (80 m, 139 m), (100 m, 173 m), and (120 m, 208 m), respectively.
2.4. Environment load conditions
Linear wave theory was adopted in the fully-coupled time-domain simulations. Nonetheless, this assumption should be examined in practice since the assumption becomes inaccurate under extreme conditions where nonlinear effects appear. To simplify the simulation setup, loads from ocean currents and winds were not considered in this study. Thus, it is worth noting that the terms ‘environment conditions’ and ‘sea state conditions’ are equivalent since the effects of ocean currents and winds were not considered.
Several numerical simulations are presented in Sections 3 and 4, where the environment conditions have been modelled as regular waves and irregular sea states, with different wave encounter directions, depending on the purpose of the simulation. For clarity, the environment load conditions that defined a numerical simulation are presented before the results and analyses from it in Sections 3 and 4, respectively.
2.5. Analysis of power performance, hydrodynamic efficiency, and fatigue
The two generations of WECs and their mooring systems are analyzed and compared in Sections 3 and 4 with regard to power performance, hydrodynamic efficiency, and accumulated fatigue damage in the mooring lines. In the following, it is presented how values of each one of these assessment criteria were calculated.
The PTO system was simplified as a linear damper acting only on the heave direction even if the WEC could move in all six degrees-of-freedom. However, since the WEC mainly extracts energy from the heave motion, its power performance is defined as:
$ P=\frac{1}{T_{\text {sim }}} \int_{0}^{T_{\text {sim }}} B_{\text {PTO }}[\dot{\xi}(t)]^{2} d t$
where, ξ [m] is the translation in the heave direction, and Tsim [s] is the simulated physical time.
In the comparison of the two WECs, their hydrodynamic efficiency was calculated and compared with other WEC types. The hydrodynamic efficiency is defined by Aderinto and Li [26] as the ratio of the absorbed power to the power available within the width of the WEC:
$ \eta=\frac{\text { Power absorbed }}{\text { Power available within device width }}$
The available power for the whole buoy (here, of the WEC), Pavailable [W], can be estimated as:
$ P_{\text {available }}=\frac{\rho g^{2} T H^{2}}{32 \pi} \times D_{W E C}$
where, ρ [kg/m3] is the water density, g [m3/(kg × s2)]is the gravitational acceleration, T [s] is the wave period, H [m] is the wave height, and DWEC [m] denotes the cross-sectional width of the buoy. Note that the first term on the right-hand side is interpreted as the wave-energy transport as proposed by Falnes and Kurniawan [27].
The elastic mooring lines are made of polyester. According to the position mooring standard DNV [28], the calculation of the fatigue life of fibre ropes, for example, polyester mooring lines, should follow the RN (relative tension-number of cycles to failure) approach rather than the SN (stress-number of cycles to failure) approach. Therefore, the mooring line damage, D [-], was calculated as follows:
$ D=\sum_{i} \frac{R_{i}^{m}}{\alpha} \cdot \gamma_{D}$
where i denotes the ith tension cycle identified by the rainflow counting (RFC) method, and Ri [N] is the relative tension amplitude, which is the ratio between the identified tension amplitude and the breaking strength of the polyester mooring lines used in this study (which is 720 kN). As suggested by the DNV standard [28], the parameters α and m represent the intercept and slope of the RN curve, which for this study's polyester mooring lines were set to 0.259 and 13.46, respectively. The safety factor γD was set to 60 in this study, which is recommended by the DNV standard [28] to cover uncertainties in fatigue analyses of polyester ropes.
3. Results from single-unit WEC simulations
The following subsections present several simulations of different wave conditions. The simulated regular wave periods start from 2 s, and end at 11 s with 1 s as the interval. The wave height is represented as the wave amplitude (i.e., half of the wave height), where the range of it is from 0.25 m to 3 m with 0.25 m as the interval. In the time-domain simulation with regular waves, the incoming wave direction is aligned with the x-axis, as indicated in Fig. 3. In the simulations with irregular waves, three irregular sea state conditions described by the JONSWAP wave spectrum are studied using a peak enhancement factor of 2.4.
3.1. Frequency-domain analysis
WaveEL 3.0 and 4.0 were initially compared in a frequency-domain analysis. Fig. 7 shows the response of the heave motions in the frequency domain. For both WECs, a peak is seen at a characteristic wave period. This peak is a specific feature of point absorbers, which have the largest power generation at the resonance. WaveEL 4.0 has a larger heave magnitude than 3.0 at the characteristic wave period, where resonance appears. In addition, the characteristic wave period of WaveEL 4.0 is approximately 5 s, which is larger than the characteristic wave period for 3.0, which is nearly 4 s. The discrepancies between the two WECs are associated with the differences in the buoy and tube geometries, as well as the COG and total mass that are sourced from the geometric differences. In the following subsections, it is studied how the characteristics of the two WECs relate to power performance, hydrodynamic efficiency, WEC motions, and forces in the mooring lines.
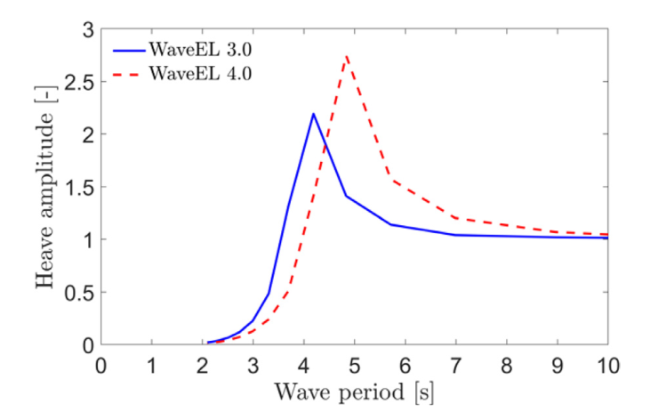
Fig. 7. Results from frequency-domain simulations: heave amplitude response per unit wave height with respect to wave periods. |
3.2. Time-domain analysis for regular waves
In addition to the frequency-domain analysis that identified the resonance period and response amplitude, time-domain simulations were performed to compute variables such as the axial forces in the mooring lines, the time-averaged power generation rate, and the time-averaged hydrodynamic efficiency. Four representative regular sea state conditions with wave periods (T) from 4 to 7 s with 1 s as the interval but different wave amplitudes (Ha, 0.5 m and 1.5 m) were chosen for the simulations. The wave amplitude of 0.5 m accounts for a linear sea state condition, given that the buoy cross-sectional shape along the axial axis is the same at the wave amplitudes ranging from −1 to 1 m. Here, the positive value indicates the position above the waterline. In contrast, the wave amplitude of 1.5 m leads to nonlinear effects to some extent since waves can pass through part of the buoy with gradually changing sectional shapes.
Fig. 8 shows the heave motions of the WECs under the simulated sea state conditions. WaveEL 4.0 has over 13% higher heave amplitudes than WaveEL 3.0 under all conditions except for the 4 s wave period simulations, where WaveEL 3.0 has higher heave motions. Moreover, WaveEL 4.0 had a notably larger slope of the heave motion variations, except for the 4 s wave period simulations, indicating a better power generation capacity, according to Eq. (1).
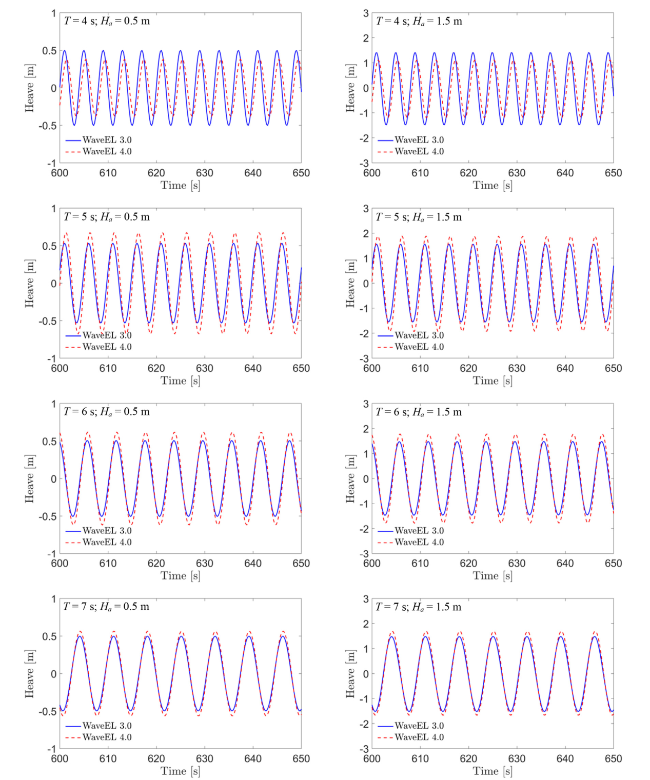
Fig. 8. Heave motions at different wave periods (T) and wave amplitudes (Ha). |
The axial forces in the upper mooring line (section 1) of mooring 1 are plotted in Fig. 9; see Fig. 3 for the position of mooring 1. This mooring line is presented specifically because it is aligned with the incoming wave direction and is subjected to the most intensive wave interactions. WaveEL 4.0 exhibits a slightly larger heave amplitude and slope than WaveEL 3.0 for all wave period simulations except for when the wave period is 4 s.
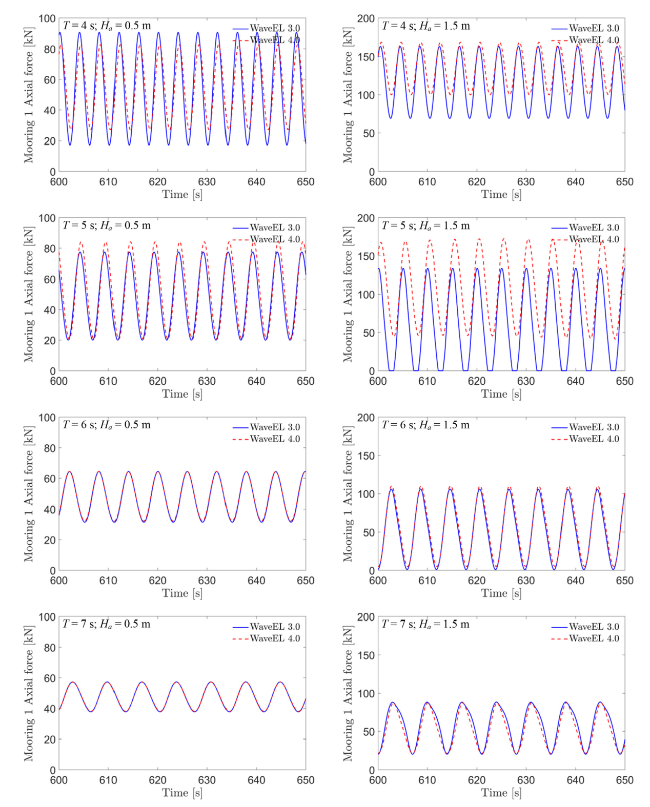
Fig. 9. The axial force in the upper rope (section 1) of mooring 1 at different wave periods (T) and wave amplitudes (Ha). |
The time-averaged power production under regular sea state conditions was computed based on Eq. (1). In Fig. 10, the largest power performance is achieved at the resonant wave periods obtained in the frequency-domain simulations presented in Section 3.1. Nonetheless, as aforementioned, real sea state conditions can introduce nonlinear effects, which are discussed in Section 4 and will be studied in further work. In addition, Fig. 11 presents the hydrodynamic efficiency computed based on Eq. (2). The largest efficiency is seen at the resonant period, and the maximum efficiencies are 40% and 47% for WaveEL 3.0 and WaveEL 4.0, respectively. These findings are consistent with the results observed in Fig. 7, for which the results are obtained from the frequency-domain simulations.

Fig. 10. Power produced by (a) WaveEL 3.0, and (b) WaveEL 4.0. |
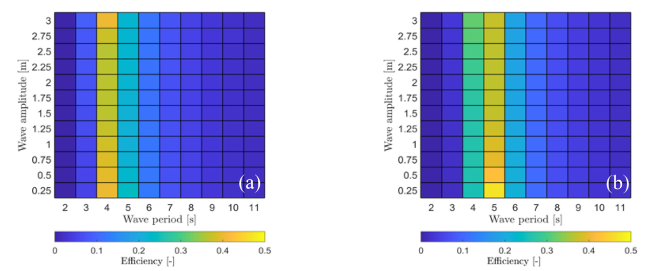
Fig. 11. Efficiencies of (a) WaveEL 3.0, and (b) WaveEL 4.0. |
Aderinto and Li [26] reviewed and compared the efficiencies and power performance of different types of WECs. According to their classification method, WaveEL can be classified as a heaving WEC system. The hydrodynamic efficiencies of different concepts are highly dependent on the characteristic width of the WEC component that directly interacts with the incoming wave. For the WaveEL concept, the characteristic width is the diameter of the upper part of the buoy. Fig. 12 compares the two versions of WaveEL with other heaving WEC concepts; the data of the other WECs are referred to Aderinto and Li [26]. The WaveEL WECs exhibit remarkably better hydrodynamic efficiency than other WECs with similar characteristic widths. In addition, the WaveEL WECs reach the efficiencies of those WECs with a characteristic width of 15 m, which is two times larger than the characteristic width of the WaveEL WECs. Therefore, the WaveEL structure is more compact, which may be beneficial for the large-scale installation of WEC arrays that require small footprints.
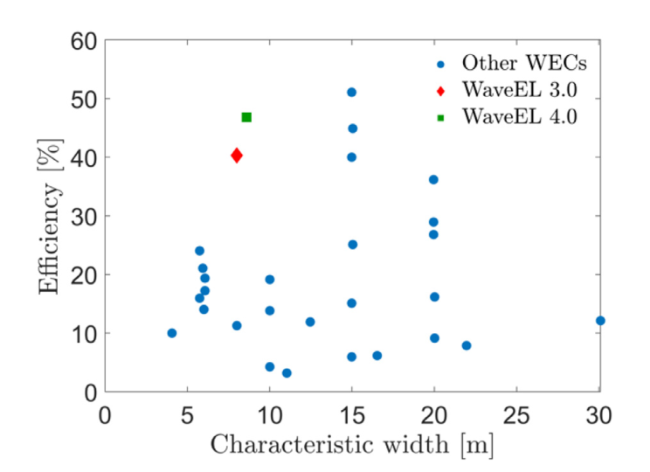
Fig. 12. Comparison of the efficiencies between the WaveEL WECs with others available on the market. |
3.3. Time-domain simulations for irregular waves
A full-scale prototype of WaveEL 3.0 has been tested by Waves4Power [29] in 2017 in Runde, Norway. The motions of the WEC and the axial forces of the mooring lines were measured over several months. Ringsberg et al. [15] presented results from these measurements and used the data to verify a former numerical model of WaveEL 3.0. In the current study, this full-scale installation has been modelled and re-simulated using the numerical models of WaveEL 3.0 and 4.0 presented in Section 2. The purpose was to compare the performances between them when they are installed in the same location and subjected to the same environment conditions, as part of a verification of their numerical models against real measurement data from the full-scale measurements. It was assumption was that a verification of this study's WaveEL 3.0 model against the measurement data will per se verify the WaveEL 4.0 model since the same modelling procedures and methods are used to design and create both WEC models.
In the numerical modelling of WaveEL 3.0 and 4.0 against the Runde installation, the installation conditions as defined in Ringsberg et al. [15] were followed except for the pretension of the axial force in the mooring lines. In the former study, Ringsberg et al. [15] used the design values of the pretension axial force, which differed slightly against the as-installed and measured pretension forces. Nevertheless, it was concluded in that study that, despite this discrepancy, the WaveEL 3.0 model was verified against the real measurement data, but it was recommended to include the as-measured pretension axial forces in the mooring lines in future use of the numerical simulation model. Thus, the pretension axial mooring forces in the current study used the measured pretension axial force in each mooring line, respectively, in the WaveEL 3.0 and 4.0 numerical models.
Data sets from three days of measurements were selected for simulation. The sea state conditions were modelled as irregular waves based on the JONSWAP wave spectrum using a peak enhancement factor of 2.4. Table 2 presents the sea state modelling parameters (long-crested waves), which refer to the work by Ringsberg et al. [15]. Here, Hs [m] is the significant wave height, Tp [s] is the wave peak period, and θ [deg] is the wave direction (see Fig. 3 for the definition of its orientation). Fig. 13 shows the time-averaged axial forces in section 1 of mooring 1. The overall trends of the simulation results are consistent with the measurement data. Although the two WECs utilize the same mooring system, they present different forces under the conditions of 2017-06-18 and 2017-06-19. The forces of WaveEL 4.0 are generally larger than the forces of WaveEL 3.0.
Table 2. Sea state conditions (long-crested waves), from Ringsberg et al. [15]. |
| Date and time | Hs [m] | Tp [s] | θ [deg] |
|---|---|---|---|
| 2017-06-16 10:00-13:00 | 0.95 | 10.00 | 30 |
| 2017-06-18 08:00-11:00 | 1.40 | 6.75 | 30 |
| 2017-06-19 15:00-18:00 | 1.75 | 7.50 | 30 |
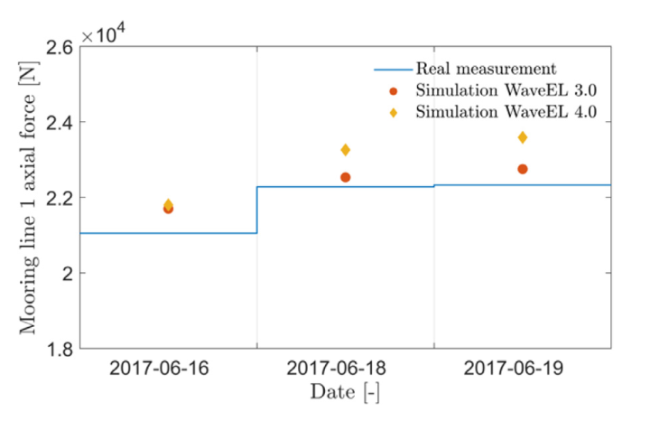
Fig. 13. The time-averaged axial force in the upper rope (section 1) of mooring 1. The measurement data are for WaveEL 3.0. |
The time-averaged axial forces in the upper mooring line (section 1) of mooring 2 are shown in Fig. 14. Similar to mooring 1, the overall trends of the numerical and experimental results are consistent. However, the trends of mooring 2 are opposite to mooring 1 in Fig. 11. As the forces of mooring 2 decrease, those of mooring 1 increase. In addition, mooring 2 of WaveEL 4.0 has lower forces than the former version. Moreover, the forces at mooring 1 are larger than the forces at mooring 2. The reason is that mooring 1 is aligned with the incoming wave direction and directly subjected to the incoming wave motions, as can be seen in Fig. 3.
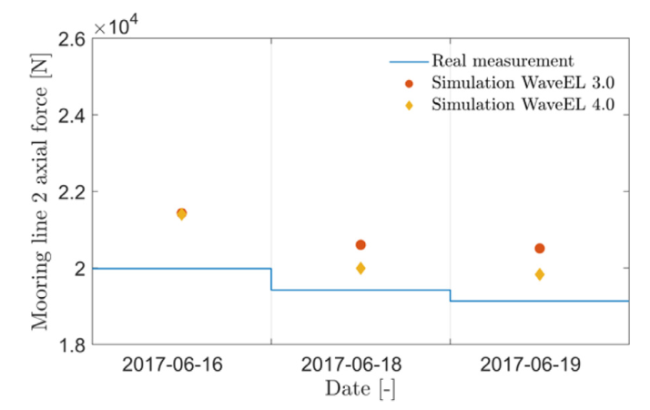
Fig. 14. The time-averaged axial force in the upper rope (section 1) of mooring 2. The measurement data are for WaveEL 3.0. |
The time series of the transient mooring forces is shown in Fig. 15. For both WECs, the forces in mooring 1 are overall higher than in mooring 2. The highest transient value at mooring 1 is over two times the time-averaged value, as seen in Fig. 13. The change in the WEC design from WaveEL 3.0 to 4.0 results in a change in the mooring forces.

Fig. 15. The time series of the axial force in the upper mooring lines (section 1) of moorings 1 and 2 under the sea state condition of 2017-06-18: (a) WaveEL 3.0, and (b) WaveEL 4.0. |
The transient buoy motions along the three axes are plotted in Fig. 16. The motions of WaveEL 4.0 have larger fluctuating amplitudes in all directions than the motions of WaveEL 3.0. The motions in the y-axis (motion y) follow a varying trend very similar as those in the x-axis (motion x). Aside from this response, high-frequency fluctuations in motion z are more intensive than the other motions.
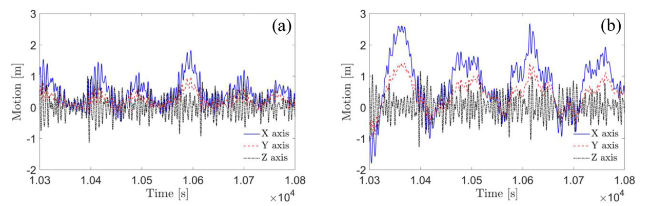
Fig. 16. The time series of motions in three directions under the sea state condition of 2017-06-18: (a) WaveEL 3.0, and (b) WaveEL 4.0. |
Fig. 17 shows the history of WEC (buoy) positions in the horizontal water surface and the vertical plane parallel to the incoming wave direction. The first sea condition in Table 2, 2017-06-16, is considered in the comparison of the simulations and experiments. The experimental data are available only for WaveEL 3.0. The buoy position points recorded in the experiments are scattered in the regions overlapping with the envelopes identified from the simulations. The approach of recording buoy positions in Fig. 17 was also applied to analyse the sea state conditions of 2017-06-18 and 2017-06-19 listed in Table 2. The results are shown in Fig. 18, Fig. 19, respectively.
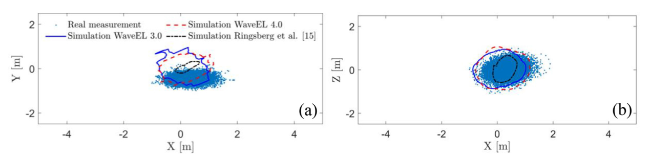
Fig. 17. WEC buoy locations at the sea state condition of 2017-06-16 recorded in (a) the horizontal water surface, and (b) the vertical plane parallel to the incoming wave direction. |

Fig. 18. WEC buoy locations at the sea state condition of 2017-06-18 recorded in (a) the horizontal water surface, and (b) the vertical plane parallel to the incoming wave direction. |
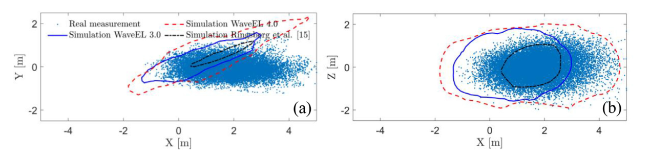
Fig. 19. WEC buoy locations at the sea state condition of 2017-06-19 recorded in (a) the horizontal water surface, and (b) the vertical plane parallel to the incoming wave direction. |
As shown in Figs. 18a and 19a, the measured buoy positions are scattered in larger regions in the water surface plane compared to the simulations. In addition, the envelopes predicted in the simulations are inclined. According to Ringsberg et al. [15], these discrepancies are caused by incoming wave direction in the measurements varying over time, but the direction was fixed in the simulations due to the limitation of the software. Figs. 18b and 19b show that the measured buoy positions in the vertical plane are also scattered in larger regions than the simulation results, possibly because the sea state was not fully stationary during the tests, and that the tides affected the measurement process; see Ringsberg et al. [15] for a discussion.
Note that the results for the present simulations show better agreement with the measured data than the results in Ringsberg et al. [15], especially under the mild sea state condition in Fig. 17. The explanation for this agreement is that the pretension mooring forces in the current study were adjusted to match the ‘as-installed’ pretension forces from the tests, while these forces in Ringsberg's work were the ‘as-designed’ forces that were artificially defined before the installation of the WEC. Since the mooring forces have a large influence on WEC motions, keeping modelled forces close to the measured data is useful to reduce motion discrepancies between the numerical prediction and the experimental measurement.
Comparing the buoy motions in Figs. 17 to 19, the two versions of WECs share similar ranges of horizontally and vertically varying buoy positions under mild sea state condition, for example, the test period in 2017-06-16. However, WaveEL 4.0 shows significantly larger envelopes in both the horizonal and vertical planes along the incoming wave direction than the former version under sea state conditions with large wave heights, for example, the sea state conditions during the test period in 2017-06-18 and 2017-06-19. These effects should be considered in the design of WEC array layouts, where every unit is installed with a distance to the neighbouring units to not lose efficiency due to hydrodynamic interaction effects. Nonetheless, considering the increases in the power generation and hydrodynamic efficiency introduced by the geometric modifications of WaveEL 4.0, the extra caution in the array layout design is deemed to be worthwhile.
4. Results from wave park simulations
The environment conditions used in the wave park simulations are based on the wave conditions from the full-scale WEC test and measurements in 2017 in Runde, Norway; see Ringsberg et al. [15] for details. Table 3 lists three sets of environment conditions (EC) at the Runde test site and the likelihood of those conditions being observed. According to the wave scatter diagram from the Runde test site, each of these conditions has a high probability of occurrence, and the same values have been used in Shao et al. [5]. EC1 and EC2 represent relatively ‘mild’ and ‘moderate’ environment conditions, respectively; these were the conditions most frequently observed during the Runde full-scale test period in 2017. EC3 is a ‘harsh’ condition that is representative of a challenging sea state.
Table 3. Definitions of three sets of environment conditions, and the probabilities of their occurrence (%) at the Runde test site. |
| EC | Significant wave height [m] | Wave period [s] | Wavelength [m] | Occurrence probability [%] |
|---|---|---|---|---|
| EC1 | 0.5 | 4.5 | 31.6 | 6.84% |
| EC2 | 1.5 | 5.5 | 47.2 | 10.14% |
| EC3 | 3.5 | 7.5 | 87.8 | 5.63% |
Several factors affect the power generation performance of WEC arrays, including the environment conditions, the incoming wave direction, and the array shape and distance between the WECs. As the generation of power depends on a WEC's motions, which, in turn, are affected by the moorings’ force characteristics, such factors play important roles in the moorings’ force responses. In the following subsections, the influences of these factors on the accumulated fatigue damage of the moorings are discussed. The simulations were run for a physical time of 1 h. The fatigue analysis was based on the 1 h mooring force response series, which is adequate for the purposes of a preliminary comparison presented in this study.
4.1. Effects of environment conditions
The effects of different arrays and environment conditions were studied by setting the WEC distance to 80 m and the incoming wave direction to 180° according to Fig. 6, while varying the environment conditions and the WEC version. A failure criterion for the WEC arrays was defined such that the whole array was deemed to have failed at the instant at which a single mooring line reached its fatigue life. That means the fatigue life of an array was determined by whichever mooring line constituted the ‘weakest link’, i.e., the largest accumulated fatigue damage over the simulated physical time. This may not be a realistic or practical criterion, but it was decided that it would be used in this study. Furthermore, the study is limited to a comparison between the three environment conditions and the accumulated fatigue damage for each of them. In future work, sea state conditions for the full wave scatter diagram at the Runde test site are planned.
Fig. 20 shows the fatigue damage accumulated of the ‘weakest link’ of all mooring lines of the arrays for each environment condition and both WEC versions. Under the mild environment condition (EC1), the WEC array using WaveEL 4.0 exhibits less accumulated fatigue damage than WaveEL 3.0. Under EC2 and EC3, however, the WaveEL 3.0 array exhibits less accumulated fatigue damage. More specifically, two of the mooring lines of the WaveEL 4.0 array accumulated large amounts of fatigue damage. As shown in Fig. 21, the two mooring lines in question are M12 and M13, which correspond to the two most upstream mooring lines under an incoming wave direction of 180°. In Fig. 21, the mooring lines of WEC 2, WEC 4, WEC 5 and WEC 6 in the WaveEL 4.0 array exhibit less accumulated fatigue damage than their counterparts in the WaveEL 3.0 array. By contrast, the mooring lines of WEC 3 in the WaveEL 4.0 array suffer from more fatigue damage than those of the WaveEL 3.0 array. It is worth noticing that the mooring lines with symmetric locations, for example, M21 and M61, do not exhibit the same amount of fatigue damage. This is due to the harsher sea state that defines EC3.
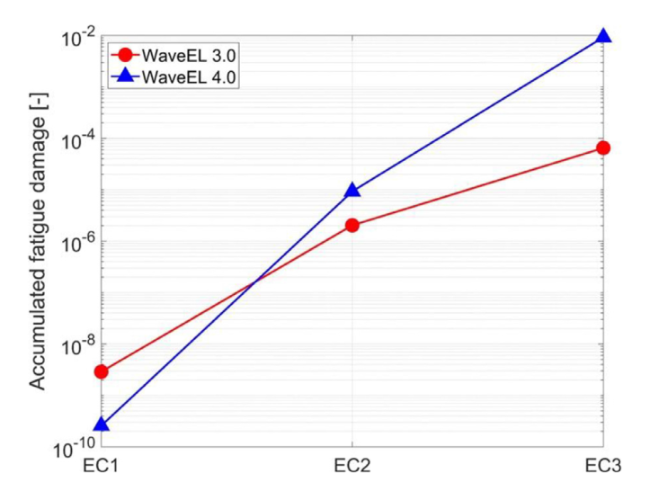
Fig. 20. Accumulated fatigue damage of the ‘weakest link’ of all mooring lines of arrays (WEC distance = 80 m) with different WEC versions and environment conditions; see the text for definitions and details. |
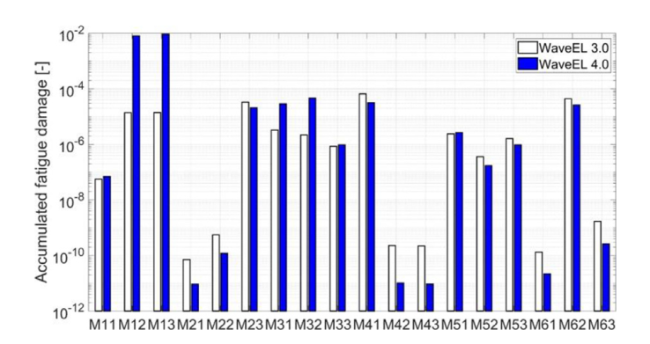
Fig. 21. Accumulated fatigue damage in each mooring line for two arrays (WEC distance = 80 m) with two WEC versions under EC3. |
Fig. 22 shows the time series of mooring axial force for M12 for a duration of 500 s. Most of the time, a similar level of axial force is observed for M12 in the two arrays with different WEC versions, apart from some high spikes that occur over a few short time periods. Those high peaks manifest themselves as the high relative tension amplitude cycles in the rainflow counting amplitude diagram, as shown in Fig. 23. According to Eq. (4), a double relative tension amplitude will increase the fatigue damage 213.46 times. This explains why the fatigue life (accumulated fatigue damage) of the WaveEL 3.0 and WaveEL 4.0 arrays differ to such a large extent.
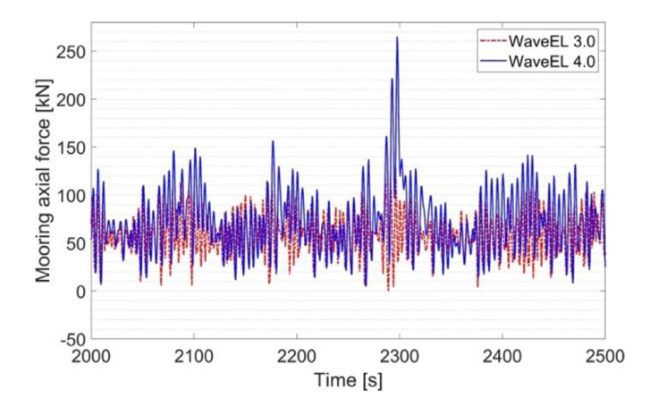
Fig. 22. Mooring axial force time series of M12 in two versions of WEC array. |
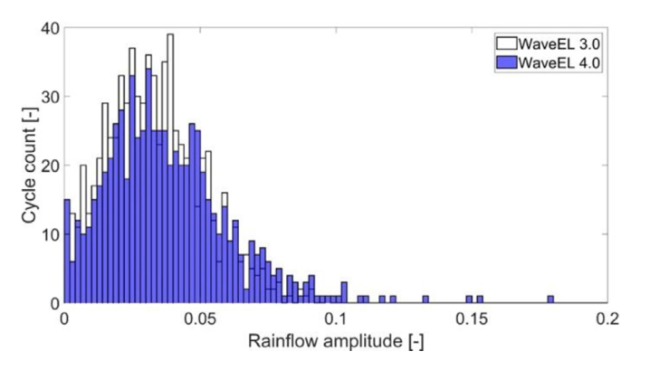
Fig. 23. Rainflow amplitude count of relative tension in M12 of the WaveEL 4.0 array under EC3. |
Fig. 24 shows the x- and z-axis motion (i.e., the surge and heave motion) for WEC 1 in Fig. 6, respectively. For both WaveEL 3.0 and 4.0, heave motions are at similar level. The power output difference is mainly due to BPTO in Eq. (1). However, the surge motion differed considerably, with a larger oscillation amplitude for WaveEL 4.0 than WaveEL 3.0. The large oscillation of surge motion induced the large spikes in mooring axial force shown in Fig. 22.
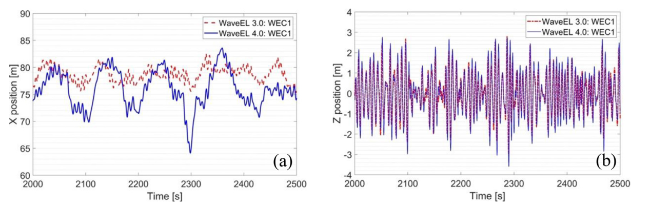
Fig. 24. (a) x-axis (surge) motion, and (b) z-axis (heave) motion of WEC 1 in Fig. 6 under EC3. |
4.2. Effects of incoming wave direction
The incoming wave direction also plays an important role in the accumulation of fatigue damage in the mooring lines. Two representative incoming wave directions, 150° and 180°, defined in Fig. 6, were chosen to investigate the effects of incoming wave direction on mooring line fatigue damage. These two incoming wave directions are chosen since the layout has 12 axes of symmetry separated by 30°. 150° and 180° are two directions align with 2 axes of symmetry. EC2 is used as the representative environment condition hereafter, since, from Table 3, EC2 has the largest probability of occurrence.
Fig. 25 shows the amount of fatigue damage accumulated by each mooring line and the highest accumulated fatigue damage values for each WEC unit. Note that the failure criterion of a WEC unit also applies to a whole WEC array: the WEC mooring system is deemed to have failed when a single mooring line reaches its fatigue limit. The decisive mooring line for the fatigue life of the whole WEC array should therefore be the one which suffers the largest amount of fatigue damage. The largest amounts of damage were observed for the two most upstream mooring lines, M12 and M13, for both incoming wave directions. Overall, mooring lines tend to exhibit a smaller amount of fatigue damage with an incoming wave direction of 180°, with a few exceptions (e.g., M11 and M13). From severe EC3 to moderate EC2, the asymmetry in the amount of fatigue damage accumulated by mooring lines reduces; Fig. 25 shows that the amount of fatigue damage accumulated by WECs at symmetric locations (relative to the incoming wave direction) is similar. Fig. 26 gives an insight into where the mooring lines suffer the largest amounts of fatigue damage. The parallel-to-water-surface section 1 has a shorter fatigue life than section 2.
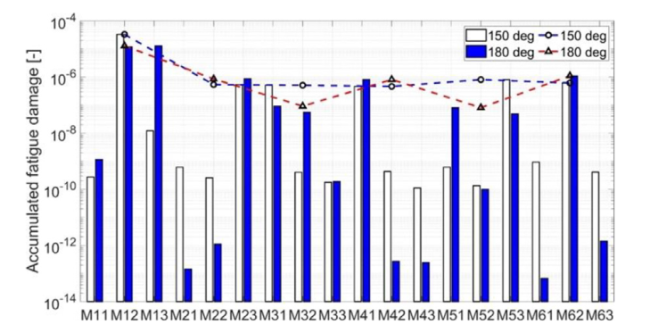
Fig. 25. The accumulated fatigue damage of each mooring line in the WaveEL 4.0 array with incoming wave directions of 150 and 180° under EC2. The lines show the accumulated fatigue damage of each WEC unit. |
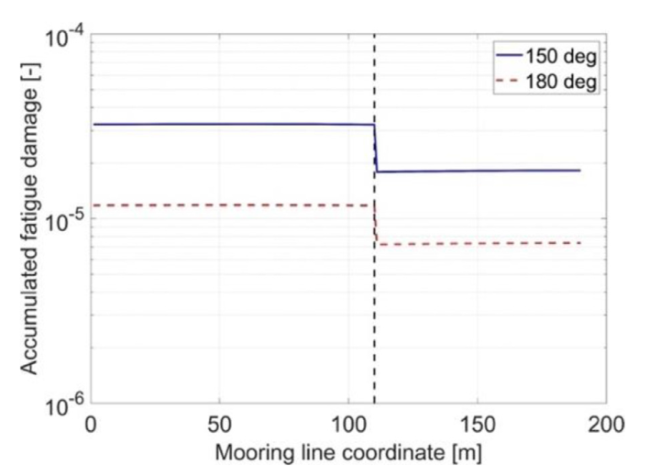
Fig. 26. M12 accumulated fatigue damage along the mooring line coordinate when the incoming wave direction is 150 and 180°. The parts of the coloured lines to the left of the black dashed vertical line represent the accumulated fatigue damage of section 1; the parts to the right represent section 2. |
4.3. Effects of WEC distance
The distance between the WECs in a WEC array is another factor that affects not only the power output but also the fatigue damage to mooring lines. Fig. 27 shows how both the fatigue damage and power vary with WEC distance. The update from WaveEL 3.0 to WaveEL 4.0 increases the power output at all three WEC distances. However, an increase in WEC distance does not always lead to an increase in power output. The power outputs of the WaveEL 3.0 and WaveEL 4.0 arrays exhibit a drop when the WEC distance increases from 80 m to 100 m and return to their previous levels with a further increase to 120 m. The fatigue damage to the WEC arrays decreases, or at least does not increase dramatically, as the WEC distance increases. The WaveEL 4.0 array accumulates less fatigue damage than the WaveEL 3.0 array when the WEC distance increases from 80 m to 100 m and again to 120 m. For the WEC distances 100 m and 120 m, WaveEL 4.0 array is far beyond WaveEL 3.0 array from both power and fatigue damage perspectives. At 80 m, it is hard to say which array performs better—WaveEL 4.0 has a higher power output but also accumulates more fatigue damage.
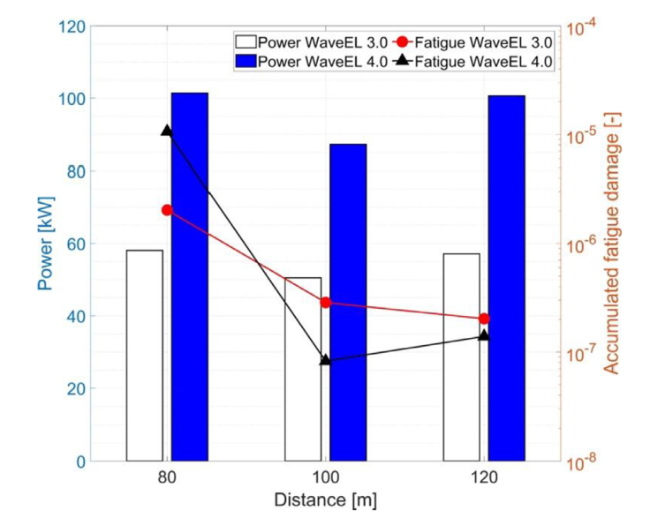
Fig. 27. The accumulated fatigue damage and hydrodynamic power output of WEC arrays with different WEC distances. |
The findings from the results in Fig. 27 are that WaveEL 4.0 has a higher hydrodynamic power production compared to WaveEL 3.0, and a lower accumulation of fatigue damage of the mooring lines if the distance between the WECs in the wave park is larger than 80 m. From an LCoE perspective, this is positive, and WaveEL 4.0 seems to perform better compared to WaveEL 3.0. However, this can be installation site-dependent due to different water depths and environment load conditions. Since the study was limited to few irregular sea states of the full wave scatter diagram in Runde, Norway, several issues can be addressed in future work. For the Runde site, the full wave scatter diagram should be simulated together with loads from ocean currents and winds; see Yang [24] for examples. The influence of biofouling can affect both the power performance and the fatigue characteristics of the mooring lines and power cable connected to the WEC, as was shown by Yang et al. [19]. The influence of wave directions can also be extended, as studied by Shao et al. [5]. Finally, a comparison of the WECs for different installation sites is also recommended; see Vance et al. [30] for an example.
5. Conclusions
In this study, two generations of heaving point absorber WECs, WaveEL 3.0 and 4.0, were investigated using the DNV SESAM software package in the frequency and time domains. In the first part of the study, results from single-unit WEC simulations were presented. They emphasised hydrodynamic and mechanical performance regarding the heave motion resonances, WEC motions, the mooring line axial forces, and the hydrodynamic power production under different sea state conditions. The simulation models were verified against a full-scale installation of the WaveEL 3.0 WEC in Runde, Norway.
With respect to WaveEL 3.0, the water tube of WaveEL 4.0 was lengthened, and the buoy diameter was slightly extended. The upper part of the buoy was changed from a cylindrical shape to a prism shape with nine edges. These geometric changes, especially the water tube length, result in changes in the COG location and total weight. The simulations showed that WaveEL 4.0 has a higher heave amplitude and larger resonant frequency than WaveEL 3.0. Consequently, it shows higher hydrodynamic power production performance and hydrodynamic efficiency. Another observation is that it moves in a larger region than WaveEL 3.0. Therefore, installing units of 4.0 needs to set a larger distance among the neighbouring units to avoid losing efficiency due to hydrodynamic interaction effects. This is, however, deemed to be worthwhile considering the increased power production and hydrodynamic efficiency gained from the geometric modifications.
In reference to the characteristic buoy width, both WaveEL 3.0 and 4.0 have shown significantly competitive hydrodynamic efficiencies in comparison to other WECs under development. The WaveEL designs are compact and consequently easy to install in wave parks.
In the second part of the study, numerical simulations of different wave park configurations with WaveEL 3.0 and 4.0 were presented. The objective was to assess the hydrodynamic performance of the wave parks and to compare the fatigue characteristics of the mooring lines due to variations in several factors: the environment conditions, the direction of incoming waves, the WEC version and the distance between the WECs in the wave park.
By simulating the three most commonly occurring environment conditions in Runde (Norway), the effects of environment conditions were investigated. For the array with the shortest distance between the WECs (80 m), the results show that the WaveEL 4.0 array moorings accumulated an extremely large amount of fatigue damage under harsh environment condition. It was found that the upstream mooring lines suffered high axial force peaks which were caused by large surge-motion oscillations. From the severe environment condition to the moderate environment condition, the asymmetry in the amount of fatigue damage accumulated by mooring lines with symmetric locations (relative to the wave direction) was reduced.
Two different incoming wave directions, 150 and 180°, were studied. It was found that the majority of mooring lines exhibited a lower degree of fatigue damage for a 180° wave direction than a 150° direction. This indicates that the orientation of a WEC array should be carefully designed/oriented with respect to the dominant incoming wave direction at the installation site.
WEC arrays with three WEC distances were simulated. The amount of fatigue damage accumulated by the WEC arrays’ mooring lines decreased or remained at a similar level as the distance between the WECs increased. However, power output did not increase consistently with WEC distance. Instead, a drop in power output was observed when the distance increased from 80 m to 100 m; when the distance increased further from 100 m to 120 m, the power output returned to its previous level. It was found that the WaveEL 4.0 array performed better than its counterpart at WEC distances of 100 m and 120 m, exhibiting a higher power output and less accumulated fatigue damage.
Declaration of Competing Interest
The authors declare that they have no known competing financial interests or personal relationships that could have appeared to influence the work reported in this paper.
Acknowledgments
This work was performed within the projects ’Control of wave energy converters based on wave measurements, for optimal energy absorption’, funded by the Swedish Energy Agency through contract agreement no. 50197-1, and ‘INTERACT—Analysis of array systems of wave energy converters with regard to interaction effects in the LCoE and fatigue analyses’, funded by the Swedish Energy Agency through contract agreement no. 50148-1. This work also received funding from the Chalmers University of Technology Foundation for the strategic research project ‘Hydro- and aerodynamics’.
