
1. Introduction
This work examines counter-current imbibition processe in two immiscible fluids via homogeneous and heterogeneous porous media using various porous materials such as Fragmented Mixture, Touchet Silt Loam, and Glass Beads. Flows in petroleum reservoirs have been studied extensively in the last few decades.Many scholars have worked on various sorts of porous medium models, employing a variety of methodologies to deal with the governing equations of these types of models [1], [2], [3], [4]. Oil recovery includes three phases: primary, secondary, and enhanced. The primary oil recovery technique drains oil that naturally flows to the well's bottom due to reservoir pressure and gravity. First-stage oil recovery averages 10%, thus secondary and tertiary methods are needed. In the secondary recovery, Fluids like water are injected into oil formations to drive the oil into the production wells, resulting in the imbibition of oil. Some substance (oil) is brought into contact with another fluid in a porous medium that is heterogeneous or homogeneous. Counter-current imbibition occurs due to difference in wetting ability of water and oil. When the flow of the originating fluid (oil) and the flow of the fluid (water) injected is in the opposite direction [5]. Numerous researchers examined this topic from a variety of perspectives. Patel et al. [6] investigated this phenomenon in heterogeneous porous media, taking into account capillary pressure. For this study, Patel et al. [7], [8], [9] took into consideration Corey's model and investigated the phenomenon in a heterogeneously porous medium under the influence of capillary pressure as well as an inclined heterogeneously porous medium under the consideration of different porous materials, among other things. Ghosh et al. [10] investigated non-classical flow simulations of spontaneous imbibition in spatially diverse reservoirs. Pooladi-Darvish et al. [11], [12] covered the experimental investigation of cocurrent and countercurrent flows in water-wet fractured porous media. Ashruf et al. [13] proposes a generalised model for spontaneous imbibition in a porous material with many layers. Khan et al. [5] used LeNN-WOA-NM Algorithm to analyse multi-phase flow through porous media for this phenomena. It is commonly believed, when discussing imbibition of saltwater into an oil-filled porous rock, that the flow rates of the seawater and oil are equal and moving in opposing directions. Recently, Meher et al. [14] discussed temporal-fractional porous medium model in fractured media. The proposed model is analysed for saturation profile with different parametric effect for various types of porous materials.
This paper proposes Purcell relative permeability model for imbibition phenomenon.The imbibition phenomenon plays an important role in petroleum technology while secondary oil recovery process. The oil recovery rate is proportional to saturation of injected fluid. The main purpose of the work is to study the parametric saturation behaviour for different types of sands. Effect of relative permeability, capillarity, and heterogeneity on a saturation rate for different types of porous materials like Fragmented Mixture, Touchet silt loam, and Glass Beads have been carried out in the present study. Reduced differential transform method is used to solve the governing second-order partial differential equation [15], [16], [17], [18], [19].
The remainder of the report is structured as follows: The model's mathematical construction is discussed in Section 2. Sections 3 and 4 give some basic definitions and properties of RDTM, as well as applications of the proposed approaches. Section 5 contains a discussion of the numerical results and their implications. Section 6 concludes with closing remarks.
2. Mathematical construction
The mathematical model assumes that a cylindrical piece of a porous matrix with an oil-formatted region has a length “ ” that is completely saturated with oil. Except for one end, a common interface (the lowermost section of the matrix), the supposed cylinder is enclosed by an impermeable surface. This end is near an injected water formation. The water saturates the right side of the imbibition face because of the difference in viscosity between oil and water. Due to the capillary pressure action generated by imbibition, it travels only a short distance “ ” (without external effort) [20]. The problem under consideration is depicted schematically in the diagram below (Fig. 1):
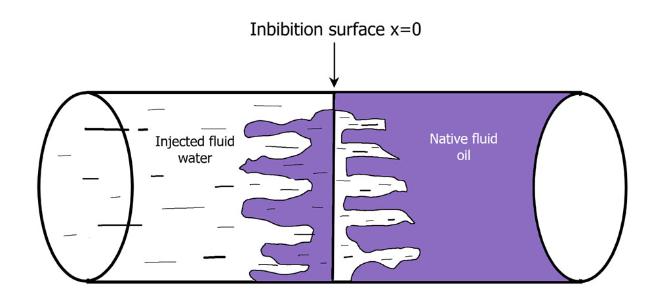
Fig.1 Natural mechanism of imbibition phenomenon. |
According to the Darcy's law [20],
where , are seepage velocities, , are relative permeabilities, , are pressures, , are viscosities of water and oil respectively. is permeability of the medium and suffix stands for injected water, stands for native oil. The equation of conservation of mass for double phase flow with respect to volume can be written as Patel and Meher [20]
where is porosity of the medium and , are mass, , are saturation of wetting and non-wetting fluid.
If the compressibility of the injecting fluid is ignored, the values of 's are constant, and Eq. (2) is simplified
According to Patel et al. [6], the condition for imbibition can be described as follows:
Capillary pressure can written as follows:
where , and are constants.
The relationship (Purcell relative permeability model [22]) can be expressed as
where is entry pressure, is effective saturation, is wetting phase residual saturation and is grain size distribution.
Combining Eqs. (1), (4) and (5), it obtains
Hence, Continuity Eq. (3) with Eq. (9) can be expressed as
Using Eqs. (7) and (8) with Eq. (10), it gives
where [6] Simplifying Eq. (11), we get
Now, this phenomenon is studied for homogeneous and heterogeneous porous medium.
Case: 1 Heterogeneous porous media
If is considered in variable form in Eq. (12), then the obtained equation is the governing equation for heterogeneous porous media. Here we have considered the variable form of as
Then using dimensionless variables , and simplification of as
(Neglecting higher order term of )
The dimensionless form of Eq. (12) for this case is
Case:2 Homogeneous porous media
If is considered as constant in Eq. (12), then obtained equation is form as governing equation for homogeneous porous media, which is given by
Initial saturation for the present study is considered as [20]
3. Analysis of RDTM
In order to demonstrate the fundamentals of RDTM, we can look at the general nonlinear partial differential equation
According to the RDTM and Table 1, we can construct the following iteration formula:
where , , and are the transformed functions of , , and respectively.
Table 1 Reduced differential transformation [19]. |
| Functional form | Transformed form |
|---|---|
From the initial condition, We write
We can obtain by substituting Eq. (19) into Eq. (18) and performing easy iterative calculations on the results. Then the inverse transformation of the set of values gives the approximation solution as,
where is order of approximation solution. Therefore, the exact solution of the problem is given by

Fig.2 Water saturation in Fragmented mixture, Touchet silt loam and Glass beads for homogeneous porous media. |
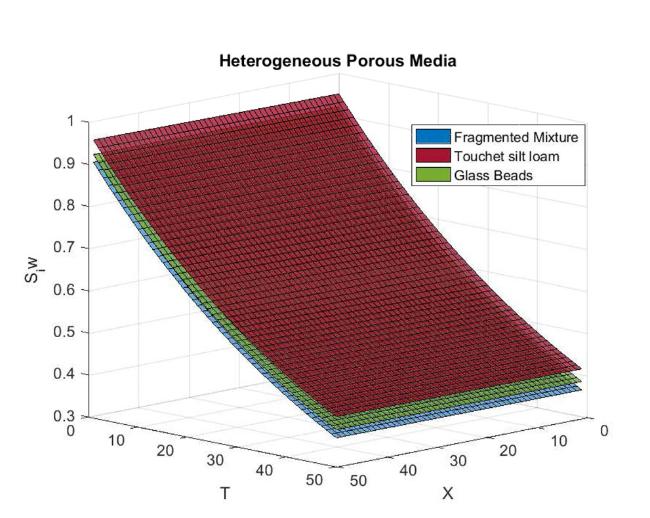
Fig.3 Water saturation in Fragmented mixture, Touchet silt loam and Glass beads for heterogeneous porous media. |
4. Mathematical solution
The approximate analytical solution is obtained in the series form by applying the aforesaid procedure to Eqs. (14) and (15) and Table 1 for three different porous materials.
We use the same initial condition for both homogeneous and heterogeneous porous media in order to produce results that can be compared for this occurrence in both cases.
For the entire study, the values of parameters are considered as Table 2.
Table 2 Parametric value of parameters [23]. |
| Property | Fragmented mixture | Touchet silt loam | Glass beads |
|---|---|---|---|
| 2.89 | 1.82 | 7.3 | |
| 0.276 | 0.270 | 0.085 | |
| 17.2 | 75 | 29 | |
| 11.3 | 0.60 | 6.30 | |
| 0.443 | 0.485 | 0.370 |
Case - 1: Fragmented mixture
Homogeneous porous media
From Eq. (15), the solution of this case is
Heterogeneous porous media
From Eq. (14), the solution of this case is
Case - 2: Touchet silt loam
Homogeneous porous media
Heterogeneous porous media
Case - 3: Glass beads
Homogeneous porous media
Heterogeneous porous media
5. Results and discussions
From the saturation rate of injected fluid at various distances and time levels, we can study the recovery rate of oil. If saturation level is increased, more oil can be recovered. In this section, we have discussed the saturation level at different time and distance level for various sands. Also, we have studied the behaviour of saturation level for fixed time and distance. In this section, we have also studied the variations in saturation level with the different parametric effect like capillary pressure, relative permeability, and heterogeneity.
5.1. Effect of types of porous media on saturation profile for different porous materials
Tables 3 and 4 show the saturation rate for Fragmented Mixture for different distances and time levels for homogeneous and heterogeneous porous media. The saturation rates at Touchet silt loam for homogeneous and heterogeneous porous media are shown in Tables 5 and 6 for varying distances and time levels, respectively. The saturation rates for Glass Beads are shown in Tables 7 and 8 for homogeneous and heterogeneous porous media, depending on the distance and time level being considered. Fig. 2 compares the saturation rate of all sands for homogeneous porous media for different spaces and times. Fig. 3 compares the saturation rate of all sands for heterogeneous porous media at different distances and times. At a fixed distance, and , Figs. 4, 6, and 8 show the variations in saturation rate in homogeneous and heterogeneous porous media for Fragmented Mixture, Touchet silt loam, and Glass Beads, respectively. We can see that the saturation level increases as time increases for all sands for a fixed distance, which is consistent with the underlying physical phenomenon. For simplicity, we have considered and only. Figs. 5, 7, and 9 indicate the saturation rate at a fixed and for all the porous materials in homogeneous and heterogeneous porous media. The saturation rate decreases with increasing distance for the specified time. For simplicity, we have considered and . Also, for all types of sands, the saturation rate is higher in the homogeneous porous media than in the heterogeneous porous medium.
Table 3 Water saturation in Fragmented mixture in homogeneous porous media. |
| X T | 0.001 | 0.002 | 0.003 | 0.004 | 0.005 | 0.006 | 0.007 | 0.008 | 0.009 | 0.01 |
|---|---|---|---|---|---|---|---|---|---|---|
| 0.1 | 0.905252 | 0.905668 | 0.906084 | 0.906501 | 0.906918 | 0.907336 | 0.907755 | 0.908174 | 0.908593 | 0.909014 |
| 0.2 | 0.819087 | 0.819444 | 0.819802 | 0.820160 | 0.820518 | 0.820877 | 0.821237 | 0.821597 | 0.821957 | 0.822318 |
| 0.3 | 0.741125 | 0.741433 | 0.741741 | 0.742049 | 0.742358 | 0.742667 | 0.742976 | 0.743286 | 0.743596 | 0.743907 |
| 0.4 | 0.670585 | 0.670851 | 0.671117 | 0.671383 | 0.671649 | 0.671916 | 0.672183 | 0.672451 | 0.672718 | 0.672986 |
| 0.5 | 0.606760 | 0.606990 | 0.607220 | 0.607451 | 0.607681 | 0.607912 | 0.608143 | 0.608375 | 0.608606 | 0.608838 |
| 0.6 | 0.549011 | 0.549210 | 0.549410 | 0.549610 | 0.549810 | 0.550010 | 0.550211 | 0.550412 | 0.550612 | 0.550813 |
| 0.7 | 0.496759 | 0.496932 | 0.497106 | 0.497280 | 0.497454 | 0.497628 | 0.497802 | 0.497977 | 0.498151 | 0.498326 |
| 0.8 | 0.449480 | 0.449632 | 0.449783 | 0.449935 | 0.450086 | 0.450238 | 0.450390 | 0.450542 | 0.450694 | 0.450847 |
| 0.9 | 0.406702 | 0.406834 | 0.406966 | 0.407099 | 0.407231 | 0.407364 | 0.407497 | 0.407630 | 0.407763 | 0.407896 |
| 1 | 0.367995 | 0.368111 | 0.368227 | 0.368343 | 0.368459 | 0.368575 | 0.368692 | 0.368808 | 0.368924 | 0.369041 |
Table 4 Water saturation in Fragmented mixture in heterogeneous porous media. |
| X T | 0.001 | 0.002 | 0.003 | 0.004 | 0.005 | 0.006 | 0.007 | 0.008 | 0.009 | 0.01 |
|---|---|---|---|---|---|---|---|---|---|---|
| 0.1 | 0.905117 | 0.905397 | 0.905678 | 0.905958 | 0.906239 | 0.906521 | 0.906803 | 0.907085 | 0.907367 | 0.907650 |
| 0.2 | 0.818969 | 0.819208 | 0.819447 | 0.819686 | 0.819925 | 0.820165 | 0.820405 | 0.820645 | 0.820886 | 0.821127 |
| 0.3 | 0.741022 | 0.741226 | 0.741430 | 0.741634 | 0.741839 | 0.742043 | 0.742248 | 0.742453 | 0.742659 | 0.742864 |
| 0.4 | 0.670494 | 0.670669 | 0.670844 | 0.671019 | 0.671194 | 0.671369 | 0.671544 | 0.671720 | 0.671896 | 0.672072 |
| 0.5 | 0.606680 | 0.606830 | 0.606980 | 0.607130 | 0.607281 | 0.607431 | 0.607582 | 0.607732 | 0.607883 | 0.608034 |
| 0.6 | 0.548941 | 0.549070 | 0.549199 | 0.549328 | 0.549457 | 0.549587 | 0.549716 | 0.549846 | 0.549975 | 0.550105 |
| 0.7 | 0.496697 | 0.496808 | 0.496919 | 0.497031 | 0.497142 | 0.497254 | 0.497366 | 0.497477 | 0.497589 | 0.497701 |
| 0.8 | 0.449425 | 0.449521 | 0.449618 | 0.449714 | 0.449811 | 0.449907 | 0.450004 | 0.450100 | 0.450197 | 0.450294 |
| 0.9 | 0.406653 | 0.406737 | 0.406820 | 0.406904 | 0.406987 | 0.407071 | 0.407155 | 0.407238 | 0.407322 | 0.407406 |
| 1 | 0.367952 | 0.368025 | 0.368097 | 0.368170 | 0.368242 | 0.368315 | 0.368388 | 0.368461 | 0.368534 | 0.368606 |
Table 5 Water saturation rate in Touchet silt loam in homogeneous porous media. |
| X T | 0.001 | 0.002 | 0.003 | 0.004 | 0.005 | 0.006 | 0.007 | 0.008 | 0.009 | 0.01 |
|---|---|---|---|---|---|---|---|---|---|---|
| 0.1 | 0.905605 | 0.906375 | 0.907147 | 0.907922 | 0.908700 | 0.909480 | 0.910262 | 0.911047 | 0.911835 | 0.912625 |
| 0.2 | 0.819374 | 0.820020 | 0.820667 | 0.821317 | 0.821968 | 0.822621 | 0.823277 | 0.823934 | 0.824593 | 0.825254 |
| 0.3 | 0.741359 | 0.741901 | 0.742445 | 0.742990 | 0.743537 | 0.744085 | 0.744635 | 0.745186 | 0.745739 | 0.746293 |
| 0.4 | 0.670775 | 0.671232 | 0.671690 | 0.672148 | 0.672608 | 0.673069 | 0.673531 | 0.673995 | 0.674459 | 0.674925 |
| 0.5 | 0.606915 | 0.607300 | 0.607686 | 0.608073 | 0.608460 | 0.608849 | 0.609238 | 0.609629 | 0.610020 | 0.610412 |
| 0.6 | 0.549136 | 0.549462 | 0.549788 | 0.550115 | 0.550443 | 0.550771 | 0.551100 | 0.551429 | 0.551759 | 0.552090 |
| 0.7 | 0.496861 | 0.497136 | 0.497413 | 0.497690 | 0.497967 | 0.498245 | 0.498523 | 0.498802 | 0.499082 | 0.499361 |
| 0.8 | 0.449563 | 0.449797 | 0.450032 | 0.450267 | 0.450502 | 0.450738 | 0.450974 | 0.451211 | 0.451448 | 0.451685 |
| 0.9 | 0.406769 | 0.406968 | 0.407168 | 0.407368 | 0.407568 | 0.407769 | 0.407970 | 0.408171 | 0.408373 | 0.408574 |
| 1 | 0.368049 | 0.368219 | 0.368390 | 0.368560 | 0.368731 | 0.368902 | 0.369074 | 0.369245 | 0.369417 | 0.369589 |
Table 6 Water saturation in Touchet silt loam in heterogeneous porous media. |
| X T | 0.001 | 0.002 | 0.003 | 0.004 | 0.005 | 0.006 | 0.007 | 0.008 | 0.009 | 0.01 |
|---|---|---|---|---|---|---|---|---|---|---|
| 0.1 | 0.905375 | 0.905915 | 0.906455 | 0.906998 | 0.907541 | 0.908087 | 0.908634 | 0.909182 | 0.909732 | 0.910283 |
| 0.2 | 0.819179 | 0.819628 | 0.820079 | 0.820530 | 0.820983 | 0.821437 | 0.821892 | 0.822348 | 0.822806 | 0.823264 |
| 0.3 | 0.741192 | 0.741567 | 0.741943 | 0.742320 | 0.742697 | 0.743076 | 0.743455 | 0.743835 | 0.744216 | 0.744598 |
| 0.4 | 0.670633 | 0.670946 | 0.671260 | 0.671575 | 0.671890 | 0.672206 | 0.672523 | 0.672841 | 0.673159 | 0.673477 |
| 0.5 | 0.606793 | 0.607055 | 0.607318 | 0.607581 | 0.607845 | 0.608110 | 0.608375 | 0.608640 | 0.608906 | 0.609173 |
| 0.6 | 0.549031 | 0.549252 | 0.549472 | 0.549693 | 0.549914 | 0.550136 | 0.550358 | 0.550580 | 0.550803 | 0.551026 |
| 0.7 | 0.496770 | 0.496955 | 0.497140 | 0.497326 | 0.497512 | 0.497698 | 0.497884 | 0.498071 | 0.498258 | 0.498446 |
| 0.8 | 0.449485 | 0.449640 | 0.449796 | 0.449953 | 0.450109 | 0.450266 | 0.450423 | 0.450580 | 0.450737 | 0.450895 |
| 0.9 | 0.406701 | 0.406832 | 0.406964 | 0.407096 | 0.407228 | 0.407360 | 0.407492 | 0.407625 | 0.407758 | 0.407891 |
| 1 | 0.367990 | 0.368102 | 0.368213 | 0.368324 | 0.368436 | 0.368548 | 0.368660 | 0.368772 | 0.368884 | 0.368996 |
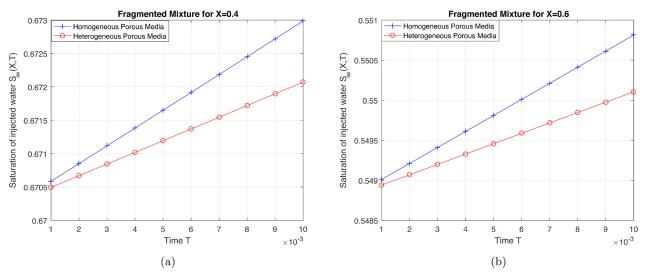
Fig.4 Water saturation vs. time in Fragmented mixture for fixed distance (a) (b) . |
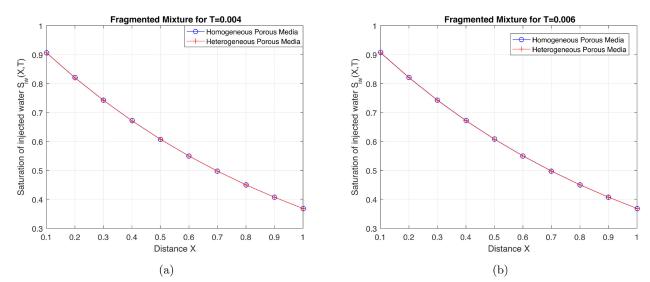
Fig.5 Water saturation vs. distance in Fragmented mixture for fixed time (a) (b) . |
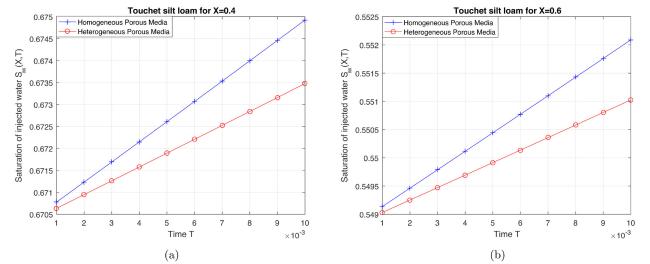
Fig.6 Water saturation vs. time in Touchet silt loam for fixed distance (a) (b) . |
Table 7 Water saturation in Glass beads in homogeneous porous media. |
| X T | 0.001 | 0.002 | 0.003 | 0.004 | 0.005 | 0.006 | 0.007 | 0.008 | 0.009 | 0.01 |
|---|---|---|---|---|---|---|---|---|---|---|
| 0.1 | 0.904975 | 0.905113 | 0.905251 | 0.905389 | 0.905528 | 0.905666 | 0.905804 | 0.905942 | 0.906080 | 0.906219 |
| 0.2 | 0.818853 | 0.818975 | 0.819097 | 0.819219 | 0.819342 | 0.819464 | 0.819586 | 0.819709 | 0.819831 | 0.819954 |
| 0.3 | 0.740927 | 0.741035 | 0.741143 | 0.741252 | 0.741360 | 0.741469 | 0.741577 | 0.741686 | 0.741794 | 0.741903 |
| 0.4 | 0.670416 | 0.670513 | 0.670609 | 0.670705 | 0.670801 | 0.670898 | 0.670994 | 0.671090 | 0.671187 | 0.671283 |
| 0.5 | 0.606616 | 0.606702 | 0.606787 | 0.606873 | 0.606959 | 0.607044 | 0.607130 | 0.607216 | 0.607302 | 0.607387 |
| 0.6 | 0.548888 | 0.548964 | 0.549040 | 0.549117 | 0.549193 | 0.549269 | 0.549346 | 0.549422 | 0.549498 | 0.549575 |
| 0.7 | 0.496653 | 0.496721 | 0.496789 | 0.496857 | 0.496925 | 0.496994 | 0.497062 | 0.497130 | 0.497198 | 0.497266 |
| 0.8 | 0.449390 | 0.449450 | 0.449511 | 0.449572 | 0.449633 | 0.449693 | 0.449754 | 0.449815 | 0.449876 | 0.449937 |
| 0.9 | 0.406624 | 0.406678 | 0.406733 | 0.406787 | 0.406841 | 0.406896 | 0.406950 | 0.407004 | 0.407059 | 0.407113 |
| 1 | 0.367928 | 0.367977 | 0.368025 | 0.368074 | 0.368122 | 0.368171 | 0.368220 | 0.368268 | 0.368317 | 0.368366 |
Table 8 Water saturation in Glass beads in heterogeneous porous media . |
| X T | 0.001 | 0.002 | 0.003 | 0.004 | 0.005 | 0.006 | 0.007 | 0.008 | 0.009 | 0.01 |
|---|---|---|---|---|---|---|---|---|---|---|
| 0.1 | 0.904930 | 0.905023 | 0.905115 | 0.905208 | 0.905301 | 0.905394 | 0.905486 | 0.905579 | 0.905672 | 0.905765 |
| 0.2 | 0.818812 | 0.818894 | 0.818976 | 0.819057 | 0.819139 | 0.819221 | 0.819303 | 0.819385 | 0.819466 | 0.819548 |
| 0.3 | 0.740890 | 0.740962 | 0.741035 | 0.741107 | 0.741179 | 0.741251 | 0.741323 | 0.741395 | 0.741468 | 0.741540 |
| 0.4 | 0.670384 | 0.670448 | 0.670511 | 0.670575 | 0.670639 | 0.670703 | 0.670767 | 0.670831 | 0.670894 | 0.670958 |
| 0.5 | 0.606587 | 0.606644 | 0.606700 | 0.606757 | 0.606813 | 0.606870 | 0.606926 | 0.606983 | 0.607040 | 0.607096 |
| 0.6 | 0.548862 | 0.548912 | 0.548962 | 0.549012 | 0.549062 | 0.549113 | 0.549163 | 0.549213 | 0.549263 | 0.549314 |
| 0.7 | 0.496630 | 0.496674 | 0.496719 | 0.496764 | 0.496808 | 0.496853 | 0.496897 | 0.496942 | 0.496987 | 0.497031 |
| 0.8 | 0.449369 | 0.449408 | 0.449448 | 0.449488 | 0.449527 | 0.449567 | 0.449607 | 0.449647 | 0.449686 | 0.449726 |
| 0.9 | 0.406605 | 0.406640 | 0.406676 | 0.406711 | 0.406747 | 0.406782 | 0.406817 | 0.406853 | 0.406888 | 0.406923 |
| 1 | 0.367911 | 0.367943 | 0.367974 | 0.368006 | 0.368037 | 0.368069 | 0.368100 | 0.368132 | 0.368164 | 0.368195 |
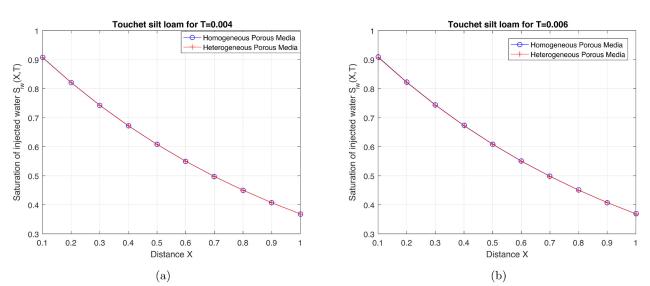
Fig.7 Water saturation vs. distance in Touchet silt loam for fixed time (a) (b) . |
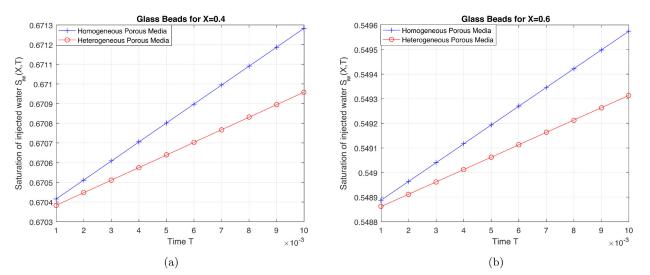
Fig.8 Water saturation vs. time in Glass beads for fixed distance (a) (b) . |
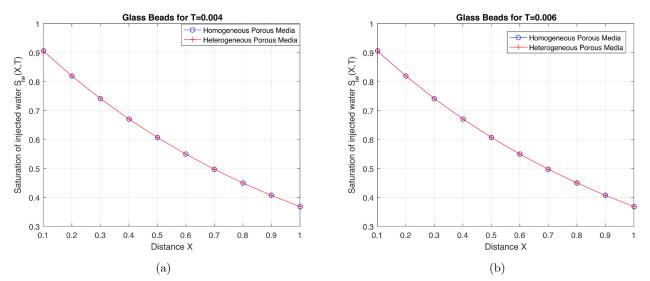
Fig.9 Water saturation vs. distance in Glass beads for fixed time (a) (b) . |
5.2. Effect of capillary pressure and heterogeneity on saturation rate
Figs. 10 -12 show the variations in capillary pressure at a fixed distance and in homogeneous and heterogeneous porous media for Fragmented Mixture, Touchet silt loam, and Glass Beads, respectively. We can see that capillary pressure increases as saturation rates decrease for all sands for a fixed distance. It demonstrates that capillary pressure has a more significant influence on heterogeneous than homogeneous porous media. Fig. 13 compares the capillary pressure of all sands for homogeneous porous media at different distances and times. Fig. 14 show the capillary pressure of all sands for heterogeneous porous media for different spaces and times. Saturation rates concerning capillary pressure have been explored numerically in detail in Table 9 for Fragmented Mixture, Touchet silt loam, and Glass Beads for homogeneous and heterogeneous porous media at fixed time . Table 10 shows the saturation rates concerning capillary pressure for Fragmented Mixture, Touchet silt loam, and Glass Beads for homogeneous and heterogeneous porous media at a fixed time of .
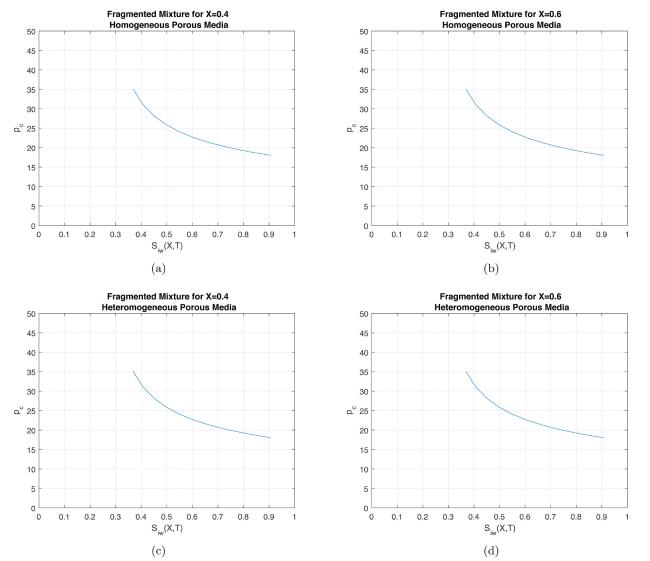
Fig.10 Comparison between capillary pressure vs. water saturation in Fragmented mixture for fixed (a) (b) , for homogeneous porous media and for fixed (c) , (d) , for heterogeneous porous media. |
Table 9 Capillary pressure vs. water saturation in Fragmented mixture, Touchet silt loam, and Glass beads. |
| Fragmented mixture | Touchet silt loam | Glass beads | |||||||||
|---|---|---|---|---|---|---|---|---|---|---|---|
| Homogeneous porous media | Heterogeneous porous media | Homogeneous porous media | Heterogeneous porous media | Homogeneous porous media | Heterogeneous porous media | ||||||
| 0.906501 | 18.04297 | 0.905958 | 18.04834 | 0.907922 | 80.76708 | 0.906998 | 80.83147 | 0.905389 | 29.43685 | 0.905208 | 29.43774 |
| 0.820160 | 18.98625 | 0.819686 | 18.99197 | 0.821317 | 87.50868 | 0.820530 | 87.57734 | 0.819219 | 29.88775 | 0.819057 | 29.88865 |
| 0.742049 | 20.03201 | 0.741634 | 20.03819 | 0.742990 | 95.19552 | 0.742320 | 95.26975 | 0.741252 | 30.35093 | 0.741107 | 30.35185 |
| 0.671383 | 21.20485 | 0.671019 | 21.21161 | 0.672148 | 104.0721 | 0.671575 | 104.1537 | 0.670705 | 30.82748 | 0.670575 | 30.82842 |
| 0.607451 | 22.53928 | 0.607130 | 22.54682 | 0.608073 | 114.4853 | 0.607581 | 114.5768 | 0.606873 | 31.31864 | 0.606757 | 31.3196 |
| 0.549610 | 24.08569 | 0.549328 | 24.09429 | 0.550115 | 126.9478 | 0.549693 | 127.0531 | 0.549117 | 31.8259 | 0.549012 | 31.82688 |
| 0.497280 | 25.92142 | 0.497031 | 25.93153 | 0.497690 | 142.2565 | 0.497326 | 142.3815 | 0.496857 | 32.35099 | 0.496764 | 32.352 |
| 0.449935 | 28.17327 | 0.449714 | 28.18564 | 0.450267 | 161.7341 | 0.449953 | 161.8891 | 0.449572 | 32.89599 | 0.449488 | 32.89703 |
| 0.407099 | 31.06877 | 0.406904 | 31.0848 | 0.407368 | 187.7818 | 0.407096 | 187.9864 | 0.406787 | 33.46337 | 0.406711 | 33.46444 |
| 0.368343 | 35.07412 | 0.368170 | 35.09692 | 0.368560 | 225.3588 | 0.368324 | 225.6559 | 0.368074 | 34.05614 | 0.368006 | 34.05727 |
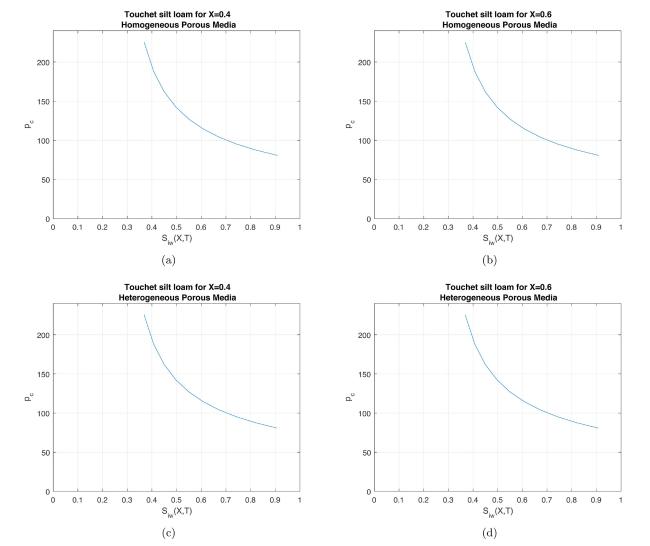
Fig.11 Comparison between capillary pressure vs. water saturation in Touchet silt loam for fixed (a) (b) , for homogeneous porous media and for fixed (c) , (d) , for heterogeneous porous media. |
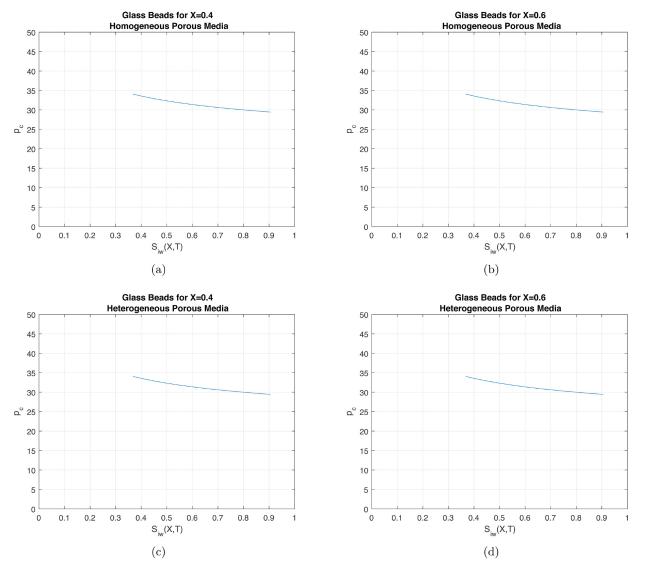
Fig.12 Comparison between capillary pressure vs. water saturation in Glass beads for fixed (a) (b) , for homogeneous porous media and for fixed (c) , (d) , for heterogeneous porous media. |
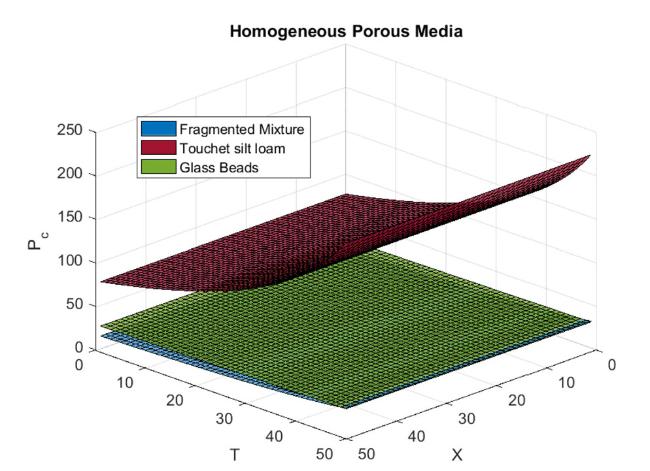
Fig.13 Comparison of capillary pressure in Fragmented mixture, Touchet silt loam and Glass beads for homogeneous porous media. |
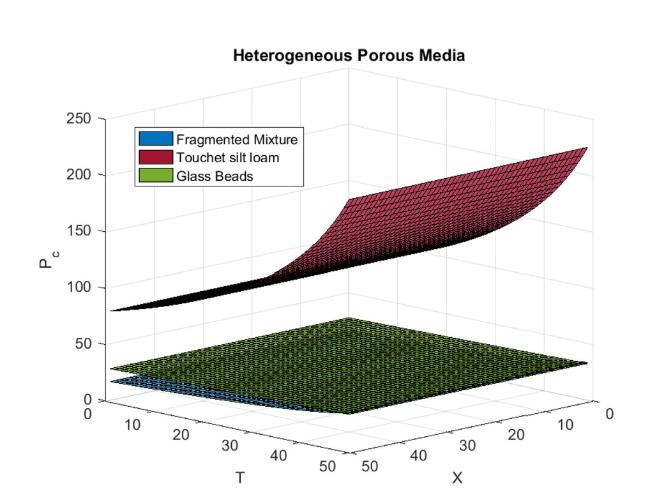
Fig.14 Comparison of capillary pressure in Fragmented mixture, Touchet silt loam and Glass beads for heterogeneous porous media. |
Table 10 Capillary pressure vs. water saturation in Fragmented mixture, Touchet silt loam, and Glass beads. |
| Fragmented mixture | Touchet silt loam | Glass beads | |||||||||
|---|---|---|---|---|---|---|---|---|---|---|---|
| Homogeneous porous media | Heterogeneous porous media | Homogeneous porous media | Heterogeneous porous media | Homogeneous porous media | Heterogeneous porous media | ||||||
| 0.907336 | 18.0347 | 0.906521 | 18.04277 | 0.909480 | 80.65894 | 0.908087 | 80.75564 | 0.905666 | 29.43549 | 0.905394 | 29.43683 |
| 0.820877 | 18.9776 | 0.820165 | 18.98619 | 0.822621 | 87.39512 | 0.821437 | 87.4982 | 0.819464 | 29.88639 | 0.819221 | 29.88774 |
| 0.742667 | 20.02283 | 0.742043 | 20.0321 | 0.744085 | 95.07466 | 0.743076 | 95.18608 | 0.741469 | 30.34956 | 0.741251 | 30.35094 |
| 0.671916 | 21.19496 | 0.671369 | 21.20511 | 0.673069 | 103.9414 | 0.672206 | 104.0638 | 0.670898 | 30.82609 | 0.670703 | 30.8275 |
| 0.607912 | 22.52843 | 0.607431 | 22.53974 | 0.608849 | 114.3411 | 0.608110 | 114.4784 | 0.607044 | 31.31724 | 0.606870 | 31.31867 |
| 0.550010 | 24.07351 | 0.549587 | 24.08641 | 0.550771 | 126.7848 | 0.550136 | 126.9426 | 0.549269 | 31.82447 | 0.549113 | 31.82594 |
| 0.497628 | 25.90732 | 0.497254 | 25.92248 | 0.498245 | 142.0663 | 0.497698 | 142.2536 | 0.496994 | 32.34953 | 0.496853 | 32.35104 |
| 0.450238 | 28.15628 | 0.449907 | 28.17481 | 0.450738 | 161.5023 | 0.450266 | 161.7346 | 0.449693 | 32.89448 | 0.449567 | 32.89605 |
| 0.407364 | 31.04705 | 0.407071 | 31.07107 | 0.407769 | 187.4814 | 0.407360 | 187.7876 | 0.406896 | 33.46182 | 0.406782 | 33.46344 |
| 0.368575 | 35.04364 | 0.368315 | 35.07778 | 0.368902 | 224.9304 | 0.368548 | 225.3747 | 0.368171 | 34.05454 | 0.368069 | 34.05622 |
5.3. Effect of relative permeability and heterogeneity on Saturation rate
Figs. 15 -17 show the variations in relative permeability at a fixed distance and in homogeneous and heterogeneous porous media for Fragmented Mixture, Touchet silt loam, and Glass Beads, respectively. We can see that for a fixed distance, relative permeability decreases as saturation rates decrease for all sands. It demonstrates that relative permeability has a greater influence on homogeneous than heterogeneous porous media. Fig. 18 compare the relative permeability of all sands for homogeneous porous media at different distances and time. Fig. 19 shows the relative permeability of all sands for heterogeneous porous media for different distances and times. Saturation rates for relative permeability have been explored numerically in detail in Table 11 for Fragmented Mixture, Touchet silt loam, and Glass Beads for homogeneous and heterogeneous porous media at fixed time . Table 12 shows the saturation rates for relative permeability for Fragmented Mixture, Touchet silt loam, and Glass Beads for homogeneous and heterogeneous porous media at a fixed time of .
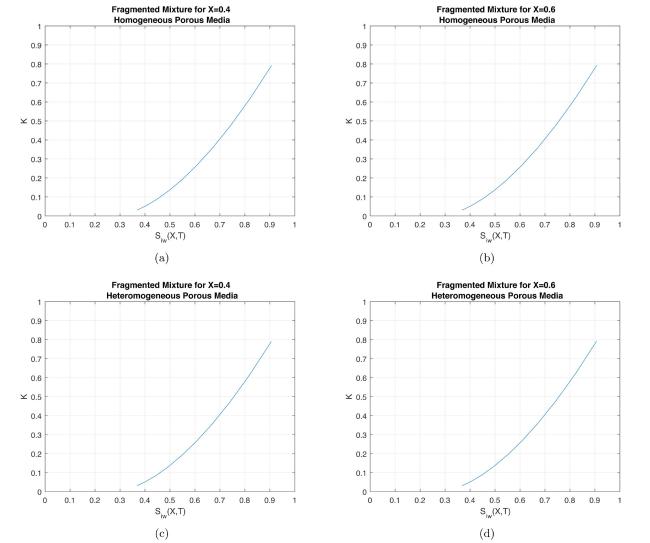
Fig.15 Comparison between relative permeability vs. water saturation in Fragmented mixture for homogeneous porous media for fixed (a) (b) , for homogeneous porous media and for fixed (c) , (d) , for heterogeneous porous media. |
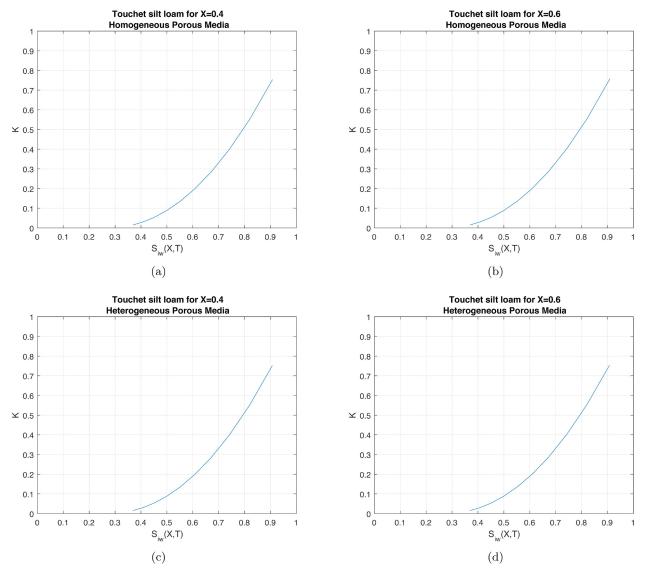
Fig.16 Comparison between relative permeability vs. water saturation in Touchet silt loam for fixed (a) (b) , for homogeneous porous media and for fixed (c) , (d) , for heterogeneous porous media. |
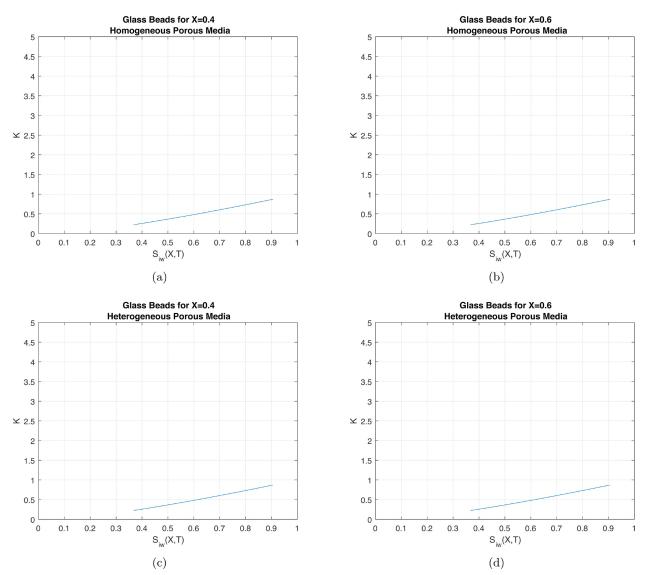
Fig.17 Comparison between relative permeability vs. water saturation in Glass beads for fixed (a) (b) , for homogeneous porous media and for fixed (c) , (d) , for heterogeneous porous media. |
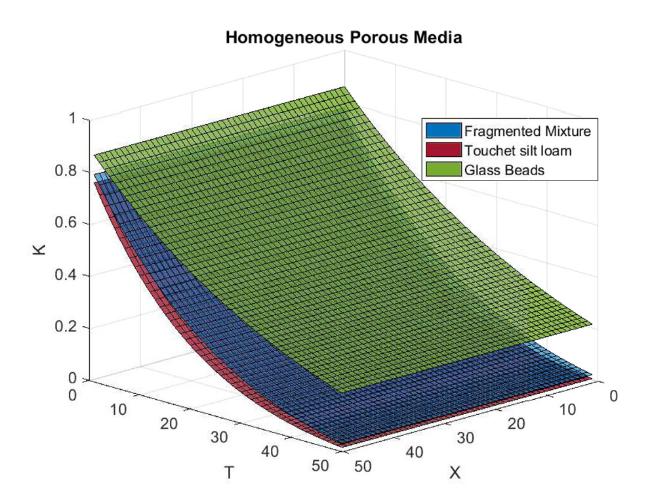
Fig.18 Comparison of relative permeability in Fragmented mixture, Touchet silt loam and Glass beads for homogeneous porous media. |
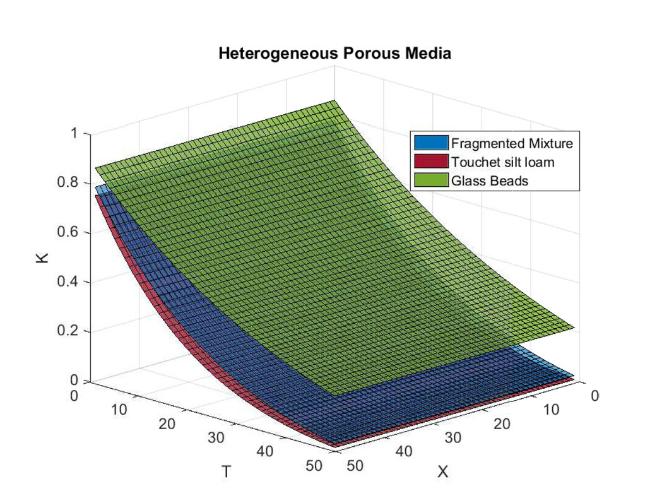
Fig.19 Comparison of relative permeability in Fragmented mixture, Touchet silt loam and Glass beads for heterogeneous porous media. |
Table 11 Relative permeability vs. water saturation in Fragmented Mixture, Touchet silt loam, and Glass beads. |
| Fragmented mixture | Touchet silt loam | Glass beads | |||||||||
|---|---|---|---|---|---|---|---|---|---|---|---|
| Homogeneous porous media | Heterogeneous porous media | Homogeneous porous media | Heterogeneous porous media | Homogeneous porous media | Heterogeneous porous media | ||||||
| 0.906501 | 0.791386 | 0.905958 | 0.790234 | 0.907922 | 0.753527 | 0.906998 | 0.751236 | 0.905389 | 0.870187 | 0.905208 | 0.869942 |
| 0.820160 | 0.616832 | 0.819686 | 0.615923 | 0.821317 | 0.554752 | 0.820530 | 0.553092 | 0.819219 | 0.755465 | 0.819057 | 0.755253 |
| 0.742049 | 0.474571 | 0.741634 | 0.473856 | 0.742990 | 0.402179 | 0.742320 | 0.400983 | 0.741252 | 0.654789 | 0.741107 | 0.654604 |
| 0.671383 | 0.359307 | 0.671019 | 0.358747 | 0.672148 | 0.2861 | 0.671575 | 0.285245 | 0.670705 | 0.566471 | 0.670575 | 0.566311 |
| 0.607451 | 0.266598 | 0.607130 | 0.266162 | 0.608073 | 0.198751 | 0.607581 | 0.198146 | 0.606873 | 0.489028 | 0.606757 | 0.488889 |
| 0.549610 | 0.192722 | 0.549328 | 0.192386 | 0.550115 | 0.133932 | 0.549693 | 0.133509 | 0.549117 | 0.421154 | 0.549012 | 0.421033 |
| 0.497280 | 0.134568 | 0.497031 | 0.134312 | 0.497690 | 0.086696 | 0.497326 | 0.086406 | 0.496857 | 0.361698 | 0.496764 | 0.361593 |
| 0.449935 | 0.089543 | 0.449714 | 0.089351 | 0.450267 | 0.053102 | 0.449953 | 0.052908 | 0.449572 | 0.309651 | 0.449488 | 0.30956 |
| 0.407099 | 0.055497 | 0.406904 | 0.055357 | 0.407368 | 0.030018 | 0.407096 | 0.029893 | 0.406787 | 0.264122 | 0.406711 | 0.264042 |
| 0.368343 | 0.030672 | 0.368170 | 0.030575 | 0.368560 | 0.014954 | 0.368324 | 0.014879 | 0.368074 | 0.224328 | 0.368006 | 0.224259 |
Table 12 Relative permeability vs. water saturation in Fragmented mixture, Touchet silt loam, and Glass beads. |
| Fragmented mixture | Touchet silt loam | Glass beads | |||||||||
|---|---|---|---|---|---|---|---|---|---|---|---|
| Homogeneous porous media | Heterogeneous porous media | Homogeneous porous media | Heterogeneous porous media | Homogeneous porous media | Heterogeneous porous media | ||||||
| 0.907336 | 0.79316 | 0.906521 | 0.791428 | 0.909480 | 0.757393 | 0.908087 | 0.753935 | 0.905666 | 0.87056 | 0.905394 | 0.870192 |
| 0.820877 | 0.618208 | 0.820165 | 0.616841 | 0.822621 | 0.55751 | 0.821437 | 0.555006 | 0.819464 | 0.755786 | 0.819221 | 0.755467 |
| 0.742667 | 0.475636 | 0.742043 | 0.474561 | 0.744085 | 0.404135 | 0.743076 | 0.402331 | 0.741469 | 0.655064 | 0.741251 | 0.654788 |
| 0.671916 | 0.360127 | 0.671369 | 0.359286 | 0.673069 | 0.287477 | 0.672206 | 0.286187 | 0.670898 | 0.566709 | 0.670703 | 0.566469 |
| 0.607912 | 0.267227 | 0.607431 | 0.266571 | 0.608849 | 0.19971 | 0.608110 | 0.198797 | 0.607044 | 0.489233 | 0.606870 | 0.489024 |
| 0.550010 | 0.1932 | 0.549587 | 0.192694 | 0.550771 | 0.134591 | 0.550136 | 0.133953 | 0.549269 | 0.42133 | 0.549113 | 0.421149 |
| 0.497628 | 0.134927 | 0.497254 | 0.134541 | 0.498245 | 0.08714 | 0.497698 | 0.086703 | 0.496994 | 0.361851 | 0.496853 | 0.361693 |
| 0.450238 | 0.089807 | 0.449907 | 0.089519 | 0.450738 | 0.053394 | 0.450266 | 0.053102 | 0.449693 | 0.309782 | 0.449567 | 0.309646 |
| 0.407364 | 0.055687 | 0.407071 | 0.055477 | 0.407769 | 0.030202 | 0.407360 | 0.030014 | 0.406896 | 0.264235 | 0.406782 | 0.264116 |
| 0.368575 | 0.030803 | 0.368315 | 0.030657 | 0.368902 | 0.015063 | 0.368548 | 0.01495 | 0.368171 | 0.224426 | 0.368069 | 0.224323 |
5.4. Rate of convergence
Theorem: If is given series,
[1] If then given series is convergent.
[2] If then given series is divergent [24].
Proof. Let be the Banach Space of all continuous functions on with the norm .Also, assume that ,where M is a positive integer. Let be a partial sum
If we prove, is Cauchy sequence in Banach Space then sequence of partial sum is convergent in Banach Space. Therefore, Now We will prove that sequence of partial sum is Cauchy sequence. We take
Therefore, We have
Now here , We obtain
Hence is Cauchy sequence in Banach Space. Therefore, given series is convergent.
From the Eq. (18), the solution of the problem is of the series form
So, the convergence of series solution for Fragmented Mixture in homogeneous is discussed as below:
Homogeneous porous media
Similarly, the convergence of series solution for Fragmented Mixture in heterogeneous is discussed as below:
Similarly, the convergence of series solution for Touchet silt loam and Glass beads in homogeneous and heterogeneous porous media are discussed as below:
Hence, the obtain series solution is convergent.
6. Conclusion
From the present study, we can say that saturation rates are higher in homogeneous porous media than in heterogeneous porous media for all types of porous material. Also, the saturation rate for Touchet silt loam is higher than other sands. It is observed that saturation rate increases as capillary pressure decreases, and saturation rate decreases as relative permeability decreases. If we maintain the capillary pressure level as low as possible, we can recover more oil through the reservoir, and high relative permeability gives a high rate of saturation and more oil recovery. The study of the effect of the relative permeability, capillarity, and heterogeneity on saturation rate with different types of materials in homogeneous as well as heterogeneous porous media concludes that saturation strongly depends on the type of external force, type of materials, relative permeability, capillarity, and the types of the porous medium. Also, the obtained results show that RDTM is a very powerful method to handle the non-linear partial differential equations. The findings are intriguing and useful for hydrologists and geologists working on reservoir problems and secondary oil recovery techniques.
Declaration of Competing Interest
The authors declare that they have no known competing financial interests or personal relationships that could have appeared to influence the work reported in this paper.
