
1. Introduction
As of 2021, the global prevalence of diabetes among people aged 20-79 years is 10.5% (537 million people). It is estimated that this will rise to 12.2% (783 million people) in 2045.1,2 Diabetes poses a severe threat to public health, especially its cardiovascular complications, which are the leading cause of death from diabetes. From a “glucocentric” point of view, there are three glycemic disorders (hyperglycemia, glycemic fluctuations (GF) and hypoglycemia), which can be put at the heart of the risk for cardiovascular diseases in persons with diabetes mellitus.3 Research4 has confirmed that atherosclerosis is the common pathological basis of cardiovascular diseases, and ECD is an early significant event that leads to atherosclerosis as well as structural and functional abnormalities in blood vessels. Patients with diabetes are more susceptible to developing ECD.5,6,7 Therefore, how to repair the endothelial dysfunction caused by diabetes, delaying or even reversing the occurrence and development of atherosclerosis, has become a crucial focal point for preventing and treating cardiovascular complications in diabetes.8,9
Arterial endothelial cells (ECs), located in the innermost layer of arteries, serve as a barrier between blood flow and arterial wall tissues, responding to hemodynamic SS and biochemical substances like blood glucose. These cells recognize SS and blood glucose signals, then transduce and transmit them to the cell interior.10 When SS and blood glucose undergo alterations, the concentration of intracellular Ca2+ and ROS within ECs are altered, leading to a series of downstream cellular biological events (e.g., oxidative stress (OS) and inflammatory responses) that ultimately affect endothelial cell function.11,12,13 Ca2+ and ROS are pivotal as secondary messengers within ECs, engaging in intricate interactions that collectively involve in signaling and regulating cellular functions.14,15,16
Diabetes-associated hyperglycemia modulates the Ca2+ signaling pathway in ECs and generates excessive ROS, leading to endothelial cell proliferation and apoptosis.13,17 Moreover, GF cause more severe damage to ECs compared to chronic hyperglycemia.18,19 Exercise training induces simultaneous increases in the amplitude and frequency of SS, eliciting Ca2+ and ROS responses in ECs, thereby regaining their functions.20,21 Different amplitudes of SS and dysglycemia can result in distinct Ca2+ and ROS responses.22,23
Here, we elucidated the impact of dysglycemia on ECs and the influence of SS on repairing ECD. Dysglycemia, including hyperglycemia, hypoglycemia and GF, was described. Then, we introduced SS as a treatment strategy that can repair ECD caused by dysglycemia. Afterwards, we summarized microfluidic technology as a novel technology for simulating the microenvironment of ECs during repair processes, aiming to construct a microfluidic system that can achieve synergistic effects of accurate pulsatile SS loading and dysglycemia stimulating. Finally, we explored the critical roles of Ca2+ and ROS. Brief schematic diagram of the content is presented in Fig. 1. Besides, we discussed the limitation and future challenges of using microfluidic technology for simulating realistic GF and pulsatile SS, as well as the necessity of synchronous detection of ROS and Ca2+ signals.
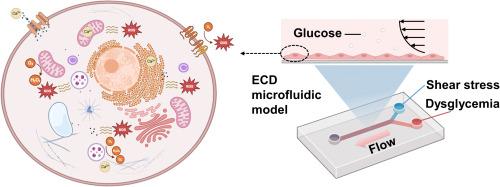
Fig. 1. Microfluidic investigation for SS-mediated repair of dysglycemia-induced ECD. Employing microfluidic technology, an ECD microfluidic model is constructed to achieve synergistic effects of accurate pulsatile SS loading and dysglycemia stimulating. This model allows the investigation of the interplay between cellular ROS and Ca2+ signals, aiming to seek interventions that utilize appropriate SS to repair ECD. Picture created with BioRender.com. |
2. ECD caused by dysglycemia
2.1. Hyperglycemia
Hyperglycemia is blood glucose greater than 125 mg/dL while fasting and greater than 180 mg/dL 2 h postprandial, which is a hallmark of diabetes and a major risk factor for endothelial dysfunction and vascular complications. Hyperglycemia induces vascular endothelial cell apoptosis,24,25 OS,26,27 and inflammatory responses,28 further leading to ECD and vascular pathogenesis.6,29 Currently, the mechanisms of ECD induced by hyperglycemia can be broadly classified into four categories: 1) the polyol (sorbitol) pathway flux, 2) increased advanced glycation end-product (AGE) formation, 3) activation of protein kinase C isoforms, and 4) increased hexosamine pathway flux.26,30,31 These pathways are all activated by the same upstream event, i.e., hyperglycemia induces the excessive generation of intracellular ROS, which triggers OS responses.26,27,31 Tao et al.32 demonstrated an elevation in ROS levels after 10 h of exposure to high glucose in ECs. Dymkowska et al.33 investigated the mechanisms of glucose-induced ROS formation in human umbilical vein endothelial cells (HUVECs) and concluded that the increased ROS generation under high glucose conditions depends on NOX rather than mitochondrial electron transport. NOX are enzyme complexes that have received much attention as key molecules in the development of vascular dysfunction. NOX have the primary function of generating ROS, and are considered as the main source of ROS production in ECs.34 Zhang et al.35 reported biological changes in HUVECs induced by hyperglycemia. They concluded that regardless of the magnitude of glucose concentration, the duration of glucose exposure exacerbates OS and activates inflammation-mediated signaling pathways, inducing endothelial dysfunction and apoptosis. This suggests that, in studying diabetes-induced endothelial dysfunction, the duration of high glucose exposure is more critical than the concentration itself.
2.2. Hypoglycemia
Hypoglycemia is often defined by a plasma glucose concentration below 70 mg/dL, which is often associated with diabetes and increased mortality.36,37 Unlike hyperglycemia, the effects of hypoglycemia on endothelial function remain largely unknown, and the effects may vary depending on the severity and duration of low glucose. Some studies have confirmed that hypoglycemia causes ECD. Wang et al.38 demonstrated that low glucose induces endothelial dysfunction by reduced nitric oxide (NO) bioavailability, mitochondrial hyperpolarization, increased mitochondrial ROS production and vasomotor dysfunction. He et al.39,40 clarified the regulation of endothelial nitric oxide synthase (eNOS) phosphorylation and its activity change under hypoglycemia. They found that hypoglycemia-dependent vascular dysfunction is mediated through altered eNOS activity and inducible nitric oxide synthase expression. Furthermore, hypoglycemia induces inflammatory responses, which are associated with endothelial dysfunction.41,42
2.3. GF
GF, also known as glycemic variability, refer to the dynamic changes in blood glucose levels between low and high levels in the body, which can provide more information about blood glucose changes.43 A common occurrence in diabetic patients is GF, including postprandial hyperglycemia and interprandial hypoglycemia, which may play a crucial role in the pathogenesis of diabetic cardiovascular complications.44,45 In vitro and in vivo studies have shown that GF are more harmful than hyperglycemia. Maeda et al.17 confirmed that intermittent hyperglycemia promotes vascular endothelial aging more severely than constant hyperglycemia due to the greater production of superoxide under intermittent hyperglycemic conditions. Wu et al.46 investigated the effects of fluctuating and sustained hyperglycemia on endothelial cell apoptosis, function, OS, and inflammation. They found that fluctuating hyperglycemia could significantly increase OS and inflammation in ECs, enhance monocyte adhesion to ECs, elevate apoptosis and dysfunction of ECs, and lead to more severe cardiovascular damage in vivo. Toma et al.47 demonstrated that oscillating glucose induces inflammatory stress, increases ROS production and NF-kB activation, and stimulates transendothelial transport. Wang et al.48 found that GF increase inflammatory responses and OS in ECs, along with elevated expression of apoptosis-related proteins. Therefore, compared to hyperglycemia, GF elevate OS and inflammatory responses in ECs, secrete excessive ROS, affect endothelial cell function, promote endothelial cell apoptosis, and cause greater damage to ECs.49,50
3. SS repairs ECD induced by dysglycemia
3.1. SS and ECs
SS induced by blood flow plays a significant role in maintaining the structure and function of ECs.51,52 SS can change the morphology of ECs and make them undergo morphological remodeling. Under low SS, ECs show a flat morphology with tight intercellular connections, whereas under high SS, ECs show a streamlined morphology with loose intercellular connections.53,54 SS can regulate the permeability and inflammatory responses of ECs, and its impact on ECs involves multiple signaling pathways and molecular mechanisms. Reviews of SS and ECs have recently been published.10,52,55,56,57,58
3.2. SS as a treatment strategy
Pulsatile SS generated by exercise can activate the production of cardiac and cellular protective mediators, such as eNOS, prostacyclin, and tissue plasminogen activator, which can help maintain vascular function and homeostasis.55 Mechanosensors in ECs can perceive and distinguish these different SS signals. The waveform of SS in arteries is linked to the flow patterns near the arterial wall. Under normal physiological conditions, wall SS waveforms in regions of arterial branching and curving exhibit characteristics of low mean value oscillations.59 Low oscillatory SS reduces Ca2+ signaling-dependent NO activity, causing OS in ECs, generating excessive ROS, and prompting increased secretion of adhesion factor ICAM-1, inflammatory factor IL-6, and tumor necrosis factor TNF-α. These ultimately lead to arterial endothelial dysfunction.51 Under conditions of exercise training, the amplitude and frequency of SS signals on the arterial wall increase simultaneously.20,21 Moderate-intensity exercise training induces a moderate increase in the amplitude and frequency of SS signals, which can enhance NO secretion via the Ca2+ signaling pathway. However, high-intensity exercise training results in a simultaneous dramatic increase in the amplitude and frequency of blood flow SS oscillations, causing excessive ROS and inhibiting NO secretion.20,21 Therefore, the regulation of endothelial cell function by SS is like a double-edged sword, and its efficacy depends on the waveform characteristics of SS. For atherosclerosis complications caused by diabetes, many clinical studies use exercise as a treatment.60,61,62,63 In other words, appropriate SS can repair endothelial cell dysfunction. Recent excellent reviews have demonstrated that SS can serve as a potential therapeutic strategy for ECD caused by dysglycemia.9,31,64
4. Microfluidic technology for loading SS and simulating blood glucose environment
4.1. Microfluidic technology
The conclusions of the above studies are mostly obtained through animal experiments, clinical trials, or in vitro cell culture experiments. However, animal experiments and clinical trials face various uncertainties, such as individual variability, challenges in measuring biomechanical, biochemical, and molecular biology markers in complex microenvironments, and ethical controversies. In vitro cell culture experiments are limited by static cultivation, which cannot stimulate the dynamic cellular microenvironment. To overcome these limitations, it is necessary to establish an objective, standardized, and quantifiable in vitro model that simulates the hemodynamic microenvironment and easily monitors ECD.56
Sulistyowati et al.65 cultured cells in high glucose medium using a 6-well plate, and used a cone-and-plate apparatus applying SS to investigate changes in endothelial cell morphology, density, VE-cadherin structure, and actin filaments. Their research revealed that ECs exposed to physiological glucose transformed from cobblestone-like shapes to elongated shapes because of SS, and were arranged in the same direction as the SS. When ECs were under contraction due to high glucose, SS resulted in decreased cell density and formation of intracellular ROS, reduced VE-cadherin and actin filaments. However, the SS they employed is a physiological value at levels, which cannot reflect the in vivo microenvironment. Avari et al.66 developed an in vitro hemodynamic system to quantify and study the impact of SS on ECs. This system utilized a parallel plate flow chamber to generate various flow conditions, including stable laminar, pulsatile, and turbulent flows. However, this system just alters SS conditions and cannot simulate the blood glucose microenvironment. Fortunately, microfluidic technology, as a disruptive technology, offers a fluid dynamic control system that better mimics the in vivo microenvironment. It has been widely utilized to conduct endothelial cell biomechanical experiments.64
Microfluidic technology is a rapidly emerging field of science characterized by precisely controlling and manipulating a small amount of fluid on the microscale. It integrates multiple processes into a small chip that normally requires a lot of laboratory equipment. The technology has found its place in various application-based streams ranging from micro-arrays to cellular biophysics.67 It is utilized in different biomedical applications such as precision medicine,68 model organisms69 and single-cell analysis.70 With the development of microfluidic technology, an increasing number of studies employ microfluidic technology to simulate the SS in vivo mechanical conditions. There are lots of comprehensive and excellent reviews on the application of SS to ECs available for reference.57,71,72,73,74,75,76,77
4.2. SS generation using microfluidic technology
4.2.1. Various SS stimuli
After the emergence of microfluidic technology, scientists began to design various microfluidic chips to generate different SS stimuli, studying the effect of SS on ECs in different parts of the arterial blood flow.77 Sonmez et al.78 developed a microfluidic device that can generate three different levels of wall SS and six different wall SS gradients. The device was used to study how different SS modalities affect ECs morphology and behavior (Fig. 2A). Zhang et al.79 developed a diamond-shaped microfluidic device with high and low SS regions arranged in parallel within a single culture chamber. Experimental validation with HUVECs demonstrated that the device could reveal SS makes amplitude-dependent and duration-dependent cell responses (Fig. 2B). Hattori et al.80 designed a microfluidic perfusion cell culture chip that provided three distinct SS intensities and a large culture area for analyzing vascular endothelial function (Fig. 2C). Table 1 summarizes the various SS generated by microfluidic systems in the past ten years to simulate the in vivo flow environment. These studies using microfluidic technology to investigate various SS changes have laid the foundation for constructing microenvironments that integrate dysglycemia and SS.
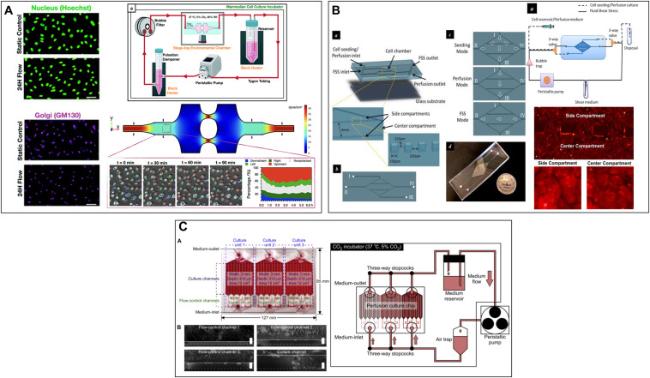
Fig. 2. Microfluidic device that can exert SS on ECs. (A). A novel microfluidic multimodal SS generator for studying endothelial cell polarization and orientation to flow (Adapted from reference 78 with permission). (B) A diamond-shaped microfluidic device that simultaneously generates high and low SS for revealing stress amplitude-dependent and load duration-dependent cellular responses (Adapted from reference 79 with permission). (C) A microfluidic perfusion cell culture chip for analyzing the influence of different SS on vascular endothelial function (Adapted from reference 80 with permission). |
Table 1. Summary of microfluidic systems for recapitulating SS of in vivo flow environment. |
| Microfluidic device | SS | Stimulation time | Main characterization | Reference |
|---|---|---|---|---|
| Microfluidic SS gradients generator | 0∼86 dyn/cm2 | 24 h | •Cell morphology | 81 |
| 20−150 dyn/cm2 | 48 h | •Cell growth | 82 | |
| 1∼9 dyn/cm2 | 1 h | •Cell adhesion | 83 | |
| 4∼40 dyn/cm2 | 24 h | •Golgi-nucleus polarization and orientation | 78 | |
| 0.01-0.09 Pa | 12 h | •Cell morphology •Cell apoptosis •Cellular ROS levels | 84 | |
| 0∼2.2 Pa | 24 h | •Cell morphology •Inflammatory responses | 85 | |
| Wall SS signal changes as a square wave with a period of 60 s between 1.875 and 2.813 Pa | 45min | •Intracellular Ca2+ dynamics | 86 | |
| •Constant shear: 17.6 dyn/cm2 •Stepped shear: 23.7-35-58.1 dyn/cm2 | 14 h | •Cell morphology •VE-cadherin expression | 87 | |
| 1∼1.7 Pa | 30min each day, three days | •Cell viability •Cell morphology | 88 | |
| A micro-vasculature-on-a-chip device | •96 h at 0.4 Pa •96 h at 0.4 Pa + 1 h at 0.08 Pa •96 h at 0.4 Pa + 6 h at 0.08 Pa •96 h at 0.08 Pa | •Actin skeleton | 53 | |
| 0, 0.02, 0.37, 1.12, 1.86 dyn/cm2 | 4 days | •Cell morphology •Mechanical properties | 89 | |
| Microfluidic cardiac profile generator | •7-11 dyn/cm2 •9-17 dyn/cm2 •13-27 dyn/cm2 •26-56 dyn/cm2 With 0.8, 1.2, 2 Hz frequencies | 48 h | •Cell morphology | 90 |
| Estimated maximum and average SS: 0.42 Pa, 0.09 Pa | 48 h | •Cell morphology | 91 | |
| Wall SS waveforms at rest, low, middle, and high intensities of exercise states | 420s | •Intracellular Ca2+ response | 21,92 | |
| Pulsatile SS: 4 dyn/cm2 & 20 dyn/cm2; 1 Hz & 2 Hz | 24 h | •Actin filaments' orientation •β-catenin distribution •Nucleus size and shape | 93 | |
| Others | Disturbed flow | 16 h | •Actin stress fibers' orientation and nuclear shape | 94 |
| Oscillatory flow | •Dye visualization | 95 |
4.2.2. Accurate pulsatile SS stimulus
In diabetes, investigating how pulsatile SS induced by exercise repairs ECD caused by dysglycemia represents a significant research direction. This requires novel microfluidic devices that can accurately simulate SS and blood glucose environments. For the accurate construction of SS, as shown in Fig. 3A, Na et al.92 proposed a microfluidic system that accurately reproduced physiologically relevant blood pressure and wall SS in vitro. This system included a microfluidic chip integrated with a cell culture chamber and on-chip load components to recreate the impedance needed for physiological waveform input. They used this system to study the intracellular Ca2+ response of ECs to SS variation. The results indicated that with increasing SS stimulus intensity, the Ca2+ periodic response waveform increased while the amplitude decreased. Subsequently, they used this system to simulate pulsatile SS induced by low, moderate, and high-intensity exercise to determine the dynamic Ca2+ response in HUVECs. They observed that the dynamic Ca2+ response within cells did not correlate positively with pulsatile SS induced by different levels of exercise, and moderate-intensity exercise training induced the most prominent dynamic Ca2+ response.21 Their results illustrate the necessity of simulating real SS in vivo. Chen et al.91 designed a microfluidic device to simulate microcirculation and study endothelial cell response to pulsatile SS (Fig. 3B). Their microfluidic design can generate a series of shear rates and arterial waveforms to mimic arterial blood flow. Chen et al.96 designed a microfluidic device with spatial and temporal wall SS and ATP signaling for studying endothelial cell intracellular Ca2+ dynamics (Fig. 3C). They found that the synergistic effect of WSS and ATP signaling played a crucial role in HUVECs signal transduction. Despite recent advances in these studies, our understanding of how accurate pulsatile SS resulting from exercise affects endothelial cell function remains limited. Moreover, there is a lack of simulation of the in vivo glucose microenvironment for repairing ECD caused by dysglycemia.
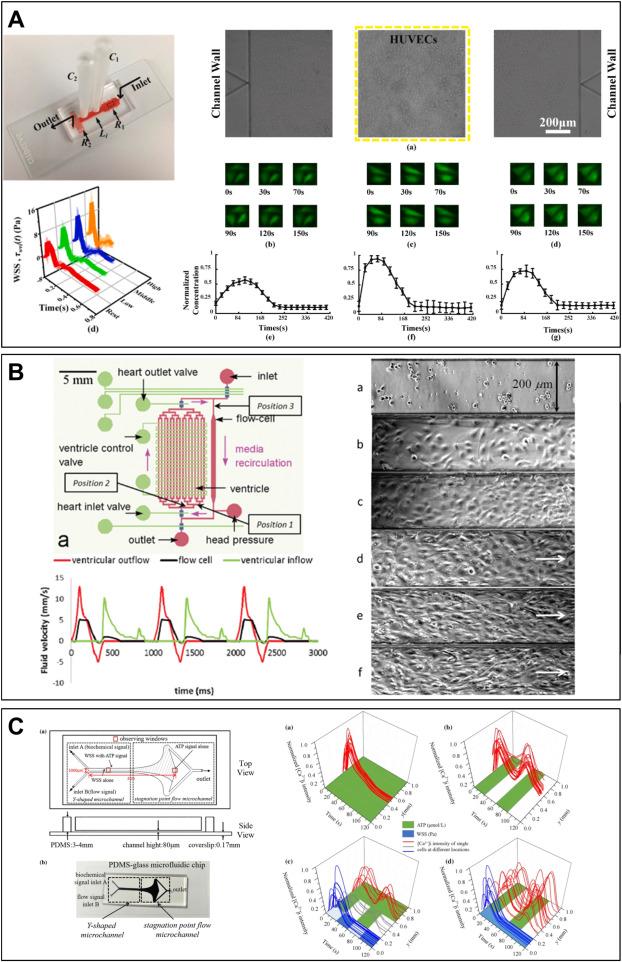
Fig. 3. Using a microfluidic system to construct accurate in vivo SS waveforms acting on ECs. (A) A microfluidic system for precise and stable construction of physiological blood pressure and SS to study the Ca2+ response of ECs (Adapted from reference 21 with permission). (B) A microfluidic device to simulate microcirculation for studying endothelial cell response to pulsatile SS (Adapted from reference 91 with permission). (C) A microfluidic device for synergizing SS and ATP signaling for studying their key roles in HUVECs signal transduction (Adapted from reference 96 with permission). |
4.3. Synergistic effects of pulsatile SS and dysglycemia
In addition to the precise SS loading of 4.2.2, further research needs to be carried out by adding the simulation of blood glucose environment on the microfluidic device. In recent years, numerous researchers have utilized microfluidic technology to study the synergistic effects of SS and blood glucose concentration on ECs. For instance, Yu et al.97 cultured ECs in a microfluidic chip and exposed them to different high glucose and SS, which resulted in excessive ROS generation and mitochondrial damage, and further led to increased cell apoptosis. This study elucidates the role of diabetes as a factor in endothelial dysfunction and cardiovascular diseases. Subsequently, their research group refined the microfluidic design and developed a hemodynamic chip to investigate ROS production and apoptosis in ECs under different pulsatile SS and glucose concentrations22,98 (as illustrated in Fig. 4A&C). Compared to static conditions, more ROS were detected when applying normal or high pulsatile SS to cells under 10 mM glucose. This indicates the necessity of using pulsatile SS to represent physiological blood flow conditions. Furthermore, their team used microfluidic technology to simulate the microenvironment of pathological blood, revealing the mechanism of blood components in diabetic patients under dynamic conditions99 (as shown in Fig. 4B). Table 2 provides a summary of all microfluidic devices that stimulate SS and blood glucose. These microfluidic device systems demonstrate that microfluidic device can better mimic the complex microenvironment.
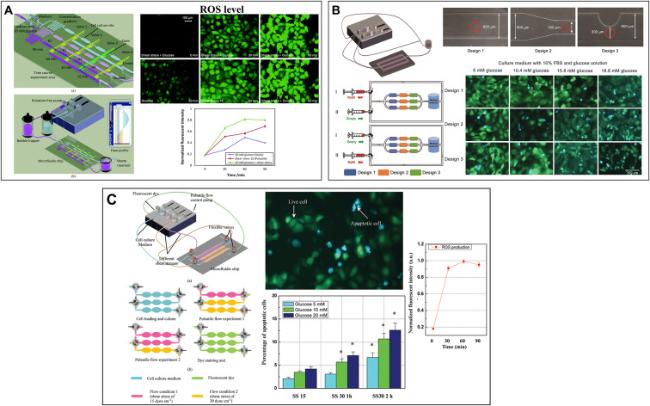
Fig. 4. Microfluidic devices that synergize SS and dysglycemia. (A) A hemodynamic chip system for studying endothelial cell ROS production and apoptosis under different pulsatile SS and glucose concentrations (Adapted from reference 22 with permission). (B) A hemodynamic chip system for simulating the microenvironment of pathological blood (Adapted from reference 99 with permission). (C) Integration of microfluidic chip system and FRET biosensor to study endothelial cell apoptosis (Adapted from reference 98 with permission). |
Table 2. Microfluidic systems for simulating the synergistic effect of SS and blood glucose. |
| Microfluidic system | SS | Glucose concentrations | Stimulation time | Main characterization | Reference |
|---|---|---|---|---|---|
| Wall plate microfluidic device system | 1 dyn/cm2 | Hyperglycemia: 80 and 200 mg/dl | 60 and 180 min | •Glycocalyx thickness •ROS generation | 100 |
| Endothelial cell culture model | Normal flow: frequency: 80 bmp & amplitude: 35 dyn/cm2; Disturbed flow | Normal glucose: 1 g/L; High glucose: 4.5 g/L | 24 h | •Cellular organization and actin alignment •eNOS phosphorylation (p-eNOS) •Akt and p-Akt •p-FAK | 59 |
| Hemodynamic lab-on-a-chip system | 70 bmp & average SS: 15 dyn/cm2; 110bmp & average SS: 23.6 dyn/cm2; | Control group: 5 mM; Experimental group: DM patients' plasma | 8 h | •Cell apoptpsis | 99 |
| Hemodynamic lab-on-a-chip system | 70 bmp & 15 dyn/cm2 (SS15); 140 bmp & 30 dyn/cm2 (SS30); | 5 mM; 10 mM; 20 mM | •12 h SS15 •1 h SS30 + 11 h SS15 •2 h SS30 + 10 h SS15 | •Cell apoptosis and necrosis | 99 |
| Hemodynamic lab-on-a-chip system | Constant SS: 30 dyn/cm2; SS15; SS30 | 5.5 mM; 10 mM; 20 mM | •0∼120min; •0∼3 h | •ROS production •Mitochondrial morphology | 22 |
| 3D microfluidic device | 0.4 Pa | 5.5 mM; 30 mM | 7 days | •Actin alignment •Cell apoptosis •Glycocalyx thickness | 101 |
5. Crucial roles of ROS and Ca2+
5.1. Imbalance of ROS and Ca2+ induced by dysglycemia
ROS exist at moderate levels within ECs and participate in various physiological activities as signaling molecules, while high levels of ROS can cause dysfunction, disease, and even cell death.102,103,104 Ca2+ are important second messengers that control virtually all functions of ECs. More and more evidence suggests that there is an interconnection between Ca2+and ROS signaling systems, which is of great significance for regulating cellular signaling networks.14,15,16,105,106,107
Figuring out the key role of ROS can provide a new strategy for precise prevention and treatment of diabetes. During hyperglycemia-induced ECD and OS response, the signaling of ROS in the vascular system may play a crucial role. Yano et al.108 investigated the effect of insulin on ROS production induced by high glucose concentration, demonstrated that endothelial OS may be determined by the interaction between NO and superoxide generation. Wu et al.109 reveals that ROS-related mechanisms of antioxidant intervention and moderate exercise for the management of diabetes, providing theoretical evidence for precise management of diabetes or other metabolic diseases by antioxidants and exercise. In contrast with research on the pivotal roles of ROS in ECD induced by hyperglycemia, there is a scarcity of studies investigating the involvement of ROS signaling in ECD caused by GF and hypoglycemia. Compared with sustained hyperglycemia, acute GF lead to a greater increase in ROS levels.110 Using rats as a model, Wu et al.46 found that rats injected with acutely fluctuating glucose produced more ROS in ECs compared to those injected with sustained high glucose. Sala et al.111 cultured ECs in wells and revealed that microRNA-21 in ECs is induced by GF and hyperglycemia and influences ROS production. Voronova et al.112 used a mechanophysiological modeling approach to quantitatively study the impact of glucose on OS and metabolic memory, suggesting that GF result in higher OS, while cells exposed to constant high glucose gradually reduce ROS production due to adaptive mechanisms. Ohara et al.,113 in clinical research, discovered that the improvement of glycemic variability effectively reduces OS. They concluded that as most of the glucose variability index is significantly influenced by the mean glucose level, higher mean glucose levels are associated with higher glucose variability. In recent studies, although it is known that GF have a greater impact on the generation of OS in ECs, the specific mechanisms involved need to be further explored.114
During hyperglycemia-induced ECD, the signaling of Ca2+ in the vascular system may play a crucial role in regulating one or more downstream processes.115 Endothelial cell function is greatly influenced by variations in intracellular concentrations of Ca2+. Bishara et al.116 demonstrated that hyperglycemia enhances the expression of the non-selective cation channel TRPC1 on the endothelial cell membrane, leading to inward flow of Ca2+. Naser et al.117 investigated the impact of AGEs on Ca2+ signaling in bovine aortic endothelial cells (BAECs), revealing that AGEs cause a rapid depletion of intracellular Ca2+ stored in BAECs. However, there are fewer mechanisms related to the effects of GF and hypoglycemia on Ca2+. The earliest relevant work dated back to 1997. Graier et al.118 proposed that increased ROS due to acute hyperglycemia affects Ca2+ signal transduction, subsequently leading to increase NO formation. Subsequently, Kimura et al.119 found that acute glucose overload accumulates superoxide anions in BAECs, thereby disrupting Ca2+ homeostasis and reducing ATP-induced Ca2+ oscillations. Therefore, further research is needed to delve into whether ROS and Ca2+ signaling interact and the roles they play in GF and hypoglycemia.
5.2. Ca2+ and ROS signals during repair of SS using microfluidic technology
As depicted in Fig. 5, Ca2+ and ROS signals participate in the regulation of SS on endothelial cell function.51,120 SS can activate non-selective cation channels like TRPV4/TRPC1 on the endothelial cell membrane, leading to extracellular Ca2+ influx. Additionally, SS can induce ATP release from ECs, which directly activates cell membrane Ca2+ channels (P2X4 receptors), resulting in extracellular Ca2+ influx.121,122,123 Yamamoto et al.11,124 demonstrated that SS enhances mitochondrial ATP production, triggering ATP release and subsequent Ca2+ signaling within vascular ECs. Patel et al.125 reported that SS and mitochondrial Ca2+ uniporter channels synergistically induce Ca2+ oscillations. Zeng et al.126 established a dynamic model that describes NO and ROS production in ECs activated by SS. This model of SS-induced ROS production aligns remarkably well with experimental findings. These studies demonstrate that Ca2+ and ROS signals are involved in the process of SS repair of ECD.

Fig. 5. Hemodynamic microenvironment in arterial ECs and Ca2+ and ROS-related signaling pathways. |
Numerous recent studies have investigated the roles of Ca2+ and ROS signals using microfluidic technology. For example, Chen et al.86 developed a Y-shaped microfluidic device to investigate the combined effects of wall SS and dynamic ATP signals on the intracellular Ca2+ dynamic in ECs. They suggest that the combination of wall SS and ATP signals might play a more significant role in Ca2+ dynamic of ECs. Afterwards, they improved their microfluidic device to further refine the stimulus of SS, and found that the amplitudes and frequencies of the intracellular Ca2+ dynamic signals are closely related to the amplitudes and frequencies of WSS or ATP signals.96 Na et al. 21,92 designed a microfluidic system that can mimic the on-chip global hemodynamic behaviors to study the intracellular Ca2+ response after exposure to different intensities of exercise-induced blood pressure and wall SS waveforms. Their microfluidic system validated the involvement of Ca2+ in SS repair of ECD. In the section 4.3, Yu et al.22,97,98,99 considered the production of ROS as an important characterization when studying the synergistic effects of SS and blood glucose on ECs. Therefore, the precise roles of Ca2+ and ROS signaling in the modulation of endothelial cell function by SS remain incompletely understood and require further elucidation.
5.3. Interplay between ROS and Ca2+
The homeostasis of intracellular ROS and Ca2+ is crucial for maintaining normal cardiovascular function. When endothelial cell function becomes impaired, there is an interplay between ROS and Ca2+ that regulates each other.127 Moderate ROS induce intracellular Ca2+ signaling to regulate vascular function, whereas excessive ROS utilize dysregulated Ca2+ to induce ECD.20,107 The interplay between ROS and Ca2+ signaling can be considered bidirectional. Because ROS can regulate intracellular Ca2+ signaling and Ca2+ signaling is vital for ROS generation.14 For example, Ding et al.128 reviewed the expression and effects of TRPM2-mediated Ca2+ signaling induced by ROS in various vascular ECs. Sokolowski et al.16,129 investigated and reviewed the interrelationship between ROS and Ca2+ in aging and age-related diseases. Jaliah et al.130 demonstrated that intracellular Ca2+ and ROS are elevated in diabetic patients, and that high Ca2+ and ROS-mediated OS could dissipate into neighboring cells, exacerbating the pathological deterioration of untreated carpal tunnel syndrome. Increasing evidence suggests that the interaction between ROS and Ca2+ plays an integral role in cardiovascular diseases.105,107
An increasing body of evidence suggests that ROS and Ca2+ not only individually affect endothelial cell function, but they also interact to disrupt cellular homeostasis, consequently triggering vascular disorders.131,132,133,134 For instance, Dragomir et al.135 observed an increase in intracellular Ca2+ and elevated ROS levels in ECs exposed to hyperglycemia. They treated hyperglycemia with aspirin and found that aspirin ameliorated the intracellular Ca2+ increase and ROS elevation induced by high glucose. Hsieh et al.136 provided a review on the crosstalk between ROS and NO induced by SS. They demonstrated that ROS increase when ECs are exposed to stable or pulsatile SS, which enhances the expression of NF-E2-related factor 2, Kruppel-like factor 2, superoxide dismutase, and ICAM-1. Despite recent advances in these studies, our understanding of how accurate pulsatile SS resulting from exercise and blood glucose affect endothelial cell function, as well as the interplay between ROS and Ca2+, remains limited. In the section 5.2, Some microfluidic devices have been used to study the effects of Ca2+ and ROS signals in SS-mediated repair of dysglycemia-induced ECD. Therefore, microfluidic technology can be used to construct a more realistic hemodynamic environment for comprehending the downstream pathways and mechanisms.
6. Conclusions and outlook
In total, dysglycemia leads to endothelial dysfunction, while SS can regulate endothelial dysfunction, and Ca2+ and ROS signals play crucial roles in this process. Microfluidic technology, as a novel technology for constructing hemodynamic environment, has become a mainstream technology. Using microfluidic technology to simulate the glucose and pulsatile flow environment can establish more realistic in vitro models for studying SS-mediated repair of ECD caused by dysglycemia. Based on current research findings, GF share similar mechanisms with hyperglycemia, but the difference lies in the severity of damage caused, and specific mechanism still requires further investigation. SS exhibits a double-edged sword on endothelial cell function, and the interplay between Ca2+ and ROS signals in this process remains unclear and needs to be further investigated. There are several challenges in studying SS-mediated repair of dysglycemia-induced ECD based on microfluidic technology.
(1) Construction of accurate SS and dynamic blood glucose waveform
Current research is stuck in loading fixed glucose concentration and constant SS using microfluidic technology. Its limitation is that it has not yet been able to replicate blood glucose environment and accurate pulsatile SS in vitro. How to establish a microfluidic chip system that can accurately apply SS and dysglycemia signals to ECs is an important way to study the repair of dysglycemia-induced ECD. It is a key technology that needs to be solved to study the functional damage of ECs induced by dysglycemia and its mechanobiological mechanism. The study of pulsatile SS in repairing ECD caused by dysglycemia has important scientific significance and clinical application value for finding reasonable mechanical intervention methods such as exercise training to delay or even reverse the endothelial dysfunction, and then to prevent and treat vascular disease complications caused by diabetes.137
(2) Synchronized detection of ROS and Ca2+
Synchronized detection of ROS and Ca2+ signals can better reveal the mechanism of their interaction and mutual regulation. The concentrations and distributions of intracellular ROS and Ca2+ are dynamically changing over time and space. Synchronous detection can offer more accurate spatiotemporal information to understand their intracellular delivery pathways, activation mechanisms and dynamic regulatory processes. In addition to biosensors138 and high-throughput fluorescence screening techniques,139 multi-pathway fluorescence microscopy and dual-channel fluorescence probes have also been employed to synchronously detect changes in intracellular ROS and Ca2+ concentrations. It is easier to achieve simultaneous detection by optimizing optical microscopy techniques than to design and synthesize dual-channel fluorescent probes capable of responding to ROS and Ca2+ simultaneously.140 Therefore, in future research, multi-pathway fluorescence microscopy techniques could be chosen for the synchronous detection of ROS and Ca2+ signals. Using appropriate fluorescence probes to label intracellular ROS and Ca2+ (e.g., DCFH-DA, Rhod-2), the two probes will emit specific fluorescent signals when the intracellular ROS and Ca2+ concentrations change, so as to realize the synchronous detection of ROS and Ca2+. This technique can also provide spatiotemporal dynamic information about intracellular signals. The dynamic process of intracellular Ca2+ and ROS interactions is revealed by recording the fluorescence signaling changes of Ca2+ and ROS and observing their distribution and change patterns in time and space.
(3) Interaction mechanism between ROS and Ca2+
The interplay of ROS and Ca2+ signaling occurs during ECD induced by dysglycemia, as well as their involvement in the regulation of endothelial cell function by SS. The mechanisms of Ca2+ and ROS interactions are relevant to physiological and pathological signal transduction processes.106,107,141,142 Numerous pharmacological studies have demonstrated that drugs can induce bidirectional signaling between Ca2+ and ROS to treat diabetes and reduce OS.143,144,145 SS repairs ECD induced by diabetes, which may also be mediated by the bidirectional signaling of Ca2+ and ROS.62,146 Besides ion exchange across cell membranes, intracellular compartments (e.g., mitochondria and endoplasmic reticulum) also participate in Ca2+ and ROS signaling. Existing studies on ROS and endothelial Ca2+ homeostasis are variable and contradictory, and comprehensive investigations into the interplay between ROS and Ca2+ under diabetic microenvironment conditions are lacking. It is a very complex and worthwhile mechanism to be explored.147,148,149 The interplay between these pathways can be enhanced or attenuated in a context-dependent manner, contingent on factors such as target protein types, ROS species, dosage, exposure duration, and so on. Therefore, there is an urgent need to design devices and systems based on microfluidics to study SS-mediated repair of ECD caused by dysglycemia and to further investigate the interaction between Ca2+ and ROS. Gaining deeper insights into these processes not only provide a scientific basis for finding rational exercise training methods to delay or even reverse diabetes-induced endothelial dysfunction, but also hold academic significance for the advancement and refinement of endothelial cell mechanobiology.
Ethical approval
This study does not contain any studies with human or animal subjects performed by any of the authors.
Declaration of competing interest
The authors declare that they have no known competing financial interests or personal relationships that could have appeared to influence the work reported in this paper.
Acknowledgment
This work was supported by the National Natural Science Foundation of China (grant numbers 12372304, 12172081).
