
1. Introduction
The ongoing COVID-19 pandemic has emphasized the crucial need for affordable and decentralized quantitative immunodiagnostic tests.1,2,3,4,5,6,7,8,9,10,11 Traditional diagnostic methods, such as Enzyme-linked immunosorbent assay (ELISA),12 often dependent on centralized laboratories and costly equipment, have limitations when it comes to scalability and accessibility. In contrast, decentralized tests could facilitate rapid and extensive screening, especially in resource-constrained regions. These tests could yield quantitative data on viral load, assisting in the early identification of infections, tracking disease progression, and informing treatment decisions. Furthermore, such a diagnostic approach would not only be indispensable during pandemics but could also have applications in various other infectious diseases and healthcare settings, such as detecting cancer biomarkers.
Immunoassays utilize the specificity of antigen-antibody reactions to investigate and quantify target molecules in biological samples, such as blood, urine, nasal swabs, and more.13,14,15 The detection process relies on technologies that facilitate interactions between analytes and antibodies, allowing the identification of bound analyte-antibody complexes. Moreover, quantitative immunoassays demand the capability to accurately measure the abundance of these specifically bound analyte-antibody complexes. Currently, the most frequently employed immunoassay technologies include ELISAs,16,17,18,19,20 chemiluminescent immunoassays (CLIAs),21 and lateral flow assays (LFAs).22,23,24,25,26,27,28,29 Each of these technologies has its own advantages in certain aspects, but often comes with trade-offs that can limit their suitability for decentralized and point-of-care (POC) diagnostics.
We have recently pioneered a cost-effective and rapid quantitative diagnostic technology specifically designed for decentralized immunoassays, with potential applications in point-of-care (POC) diagnostics.30 This innovative approach, hereafter referred single-particle mechanical selection (SPMS) technology, is based on a mechanism that exploits the distinct force-dependent dissociation kinetics between specific antigen-antibody immunocomplexes and nonspecific signals, thereby greatly enhancing the assay's specificity.
In this review, we explore the fundamental principles of immunodiagnostic tests, elucidate the core principles behind SPMS, and make insightful comparisons with other established immunodiagnostic techniques. Furthermore, we introduce the current applications of SPMS and offer a forward-looking glimpse into its promising future potential.
2. General principles of current immunodiagnostic tests
Immunodiagnostic tests can be implemented through a variety of approaches, with one of the most widely employed methods being the sandwich assay.31 This technique relies on the strategic pairing of probes, serving as the signal readout, with a surface utilizing the analyte molecules as intermediaries. To accomplish this, two distinct sensing antibodies, sensor A and sensor B, are employed, both of which bind specifically to the same analyte but at different binding sites. Sensor A is typically immobilized on a solid surface, while sensor B is conjugated to the probes. As a result, when analyte molecules are present, they act as bridges, connecting the probes to the surface for subsequent detection, as illustrated in Fig. 1.
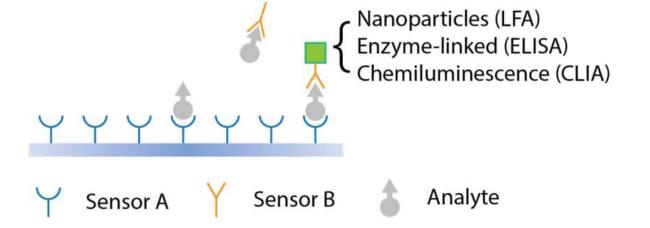
Fig. 1. Schematic illustration of sandwich-type components used in immunodiagnostic tests. |
In typical immunoassays, small probes that diffuse within a liquid medium are often utilized. At specific concentrations of both analyte and probes, the analyte binds to sensor A and sensor B, with the probabilities of these binding events contingent on the respective analyte-sensor affinities. The sensing molecules are frequently optimized to achieve a high affinity for the target analyte to minimize false-negative signals and low affinities for background molecules in the sample to avoid cross-reactivity that could lead to false-positive signals.
3. Commonly applied immunodiagnostic technologies
ELISAs, CLIAs, and LFAs are three widely used immunodiagnostic technologies, each offering a unique set of advantages and challenges within the field.
ELISA involves coating solid surfaces with sensor A and utilizing an antibody-enzyme conjugate as sensor B. When analytes bind to the surface, introducing a substrate solution for the enzyme triggers an enzymatic reaction, resulting in a detectable signal, often in the form of a color change or fluorescence.16,17,18 The signal intensity correlates with the quantity of linked probes and the duration of the enzymatic reaction. In contrast, CLIA differs from traditional ELISA in its use of chemical luminescence as the detection signal, allowing for high signal intensity and the detection of rare signals at low analyte concentrations.21 Both ELISA and CLIA typically require multiple solution exchanges before generating final readout signals, and quantitative measurements are achieved through specialized equipment or calibration with standard samples (Fig. 2).
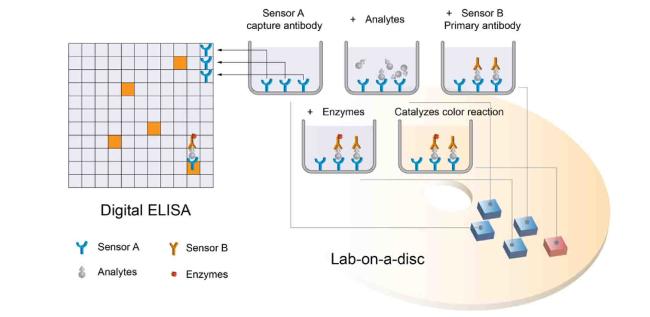
Fig. 2. Illustrates the crucial steps in a sandwich ELISA. Following the incubation of analyte molecules with the sensor A-coated surface, it is essential to eliminate the free analyte molecules before introducing the sensor B solution. Likewise, the removal of free sensor B is necessary before adding the enzyme solution. The integration of Digit ELISA enables the achievement of single-molecule sensitivity, while lab-on-disc platforms extend its application to point-of-care testing (POCT).4,16 |
LFA offer a simplified, rapid-detection approach. When the sample solution is introduced, analyte molecules interact with colored probes coated with sensor B. The solution moves across a pad containing immobilized sensor A molecules, generating a visual signal upon binding. A key difference from traditional sandwich ELISAs lies in that LFAs do not involve multistep solution exchange. LFAs are advantageous for their simplicity and lack of specialized equipment but lack the ability to provide quantitative results. Additionally, the continuous solution movement in LFAs makes it challenging to fine-tune reaction times for optimal sensitivity.32,33 To address these inherent challenges, various strategies have been developed in recent years from improvement of each component of LFAs, leading to enhanced analytical capabilities (Fig. 3).

Fig. 3. Schematic of an LFA depicting its general working principle and the sandwich-type components. The numbers within the figure highlight the strategies derived from each component, aimed at addressing the limitations of current LFAs: (1) implementation of sample preconcentration,34,35,36 (2) improvement of receptor immobilization platforms to control the flow rate,37,38,39 (3) integration of novel nanomaterials as signal transducers40,41,42 and (4) innovation in new readers for signal amplification.43,44,45 |
Each of these technologies has its own strengths and weaknesses. ELISA and CLIA excel in sensitivity but may not be suitable for point-of-care applications requiring simplicity and cost-effectiveness. On the other hand, LFA offers operational convenience and affordability but cannot quantify analyte abundance.
4. Common challenges of immunodiagnostic technologies
Immunodiagnostic technologies encounter several common challenges, each representing an avenue for further technological development.
Non-Specific Interactions pose a significant hurdle in these technologies. Factors like attractive electrostatic forces and hydrophobic absorption can lead to the non-specific binding of sensor B-linked probes to the sensor A-coated surface. Furthermore, binding of sensor A or sensor B to off-target molecules in the sample can also occur, compromising assay specificity and potentially resulting in false positive results. Current strategies to mitigate non-specific binding primarily involve surface modifications, the use of blocking agents, and optimizing the specificity of sensor A and sensor B for target analytes.46
Maintaining a delicate balance between sensitivity and specificity is another crucial challenge. A highly sensitive test reduces false negatives but can inadvertently increase background noise, causing non-specific binding and false positives.47 Achieving this balance requires sophisticated technology and a deep understanding of the biological interactions involved.
The “Hook Effect” represents a unique challenge. At high analyte concentrations, it leads to a signal decrease, saturating both sensor A and sensor B molecules, potentially causing erroneous results.48 The free energy cost for the formation of a specific sensor A/analyte/sensor B complex is:
$\Delta g=-k_{B} T \ln \left(c_{a}\right)+k_{B} T \ln \left(K_{d}^{A}\right)+k_{B} T \ln \left(K_{d}^{B}\right)-k_{B} T \ln \left(c_{s}\right)$
where the ca is the analyte concentration, $K_{d}^{A}$ and $K_{d}^{B}$ are dissociation constants of the analyte to sensor A and sensor B, respectively, expressed in the unit of Molar concentration. For typical antibodies used in immunodiagnostic assays, the values of $K_{d}^{A}$ and $K_{d}^{B}$ for target analyte are in pM to nM range. The first term, −kBTln(c) and the last term, −kBTln(cs), arises from the loss of diffusion entropy of an analyte and a sensor B probe after formation of a sensor A/analyte/sensor B-complex. Formation of abundant specific ternary immunocomplexes is favoured when $c_{a}>k_{d}^{A}, c_{a}>k_{d}^{B} \text {, and } c_{a}<c_{s}$. Hook effect becomes significant when $c_{a} \gg k_{d}^{A}, c_{a} \gg k_{d}^{B} \text {, and } c_{a}>c_{s}$, which needs to saturated binding to both sensor A and sensor B, inhibiting the formation of sensor A/analyte/sensor B-complex.
Counteracting the Hook Effect often involves techniques like serial dilution of samples or multistep solution exchange procedures. However, these approaches increase test complexity and duration. The Hook effect is of particular concern in LFAs due to the absence of solution exchange.48
Operational complexity is a common issue in advanced immunodiagnostic assays. Complex protocols and precise conditions, such as specific temperatures, pH levels, and timed reactions, are often required. This complexity can be a significant bottleneck, especially in clinical settings where time is crucial. Additionally, for point-of-care diagnostics or resource-limited applications, such complexity can render advanced assays impractical. Simplifying operational aspects while maintaining sensitivity, specificity, and accuracy remains a substantial challenge.
In light of these challenges, the development of novel immunoassay technologies with high specificity, sensitivity comparable to ELISA and CLIA, and convenience approaching that of LFA is crucial. Such technologies would be ideal for decentralized or point-of-care settings.
5. The single-particle mechanical selection (SPMS) technology
The SPMS technology relies on the attachment of small superparamagnetic microbeads, saturated and coated with sensor B, to a glass sensor surface similarly saturated and coated with sensor A, using target analyte molecules from the sample solution.30 A calibrated magnetic force is then applied to the microbeads, swiftly removing any unlinked or non-specifically linked microbeads. This process leaves behind specifically linked microbeads, which serve as the signal for detection, as illustrated in Fig. 4A. The duration of the force-dependent dissociation step is calibrated to ensure a substantial surface density of remaining microbeads in positive control samples, at the required lower bound of analyte concentration, while rendering it negligible in negative control samples lacking the analyte.

Fig. 4. Schematic of general principle of SPMS. (A) Microbeads situated near the bottom surface generate hotspots conducive to the formation of specific sensor A/analyte/sensor B complexes. (B) Enhanced specificity is attained by utilizing force-dependent dissociation of microbeads, capitalizing on the extended lifespan of microbeads specifically bound compared to the majority of nonspecifically attached microbeads. Following the precise application of controlled force over a calibrated period, the predominant population of retained microbeads is affixed through the specific sensor A/analyte/sensor B immunocomplex. The density of these retained microbeads serves as a direct signal readout. (C) Images of the retained microbeads, automatically counted with an algorithm. (D-E) Images of retained microbeads at different concentrations of CR3022, an RBD IgG, spiked in RIPA buffer (D) or in diluted blood samples at a fixed initial CR3022 concentration of 20 nM (E). Reprinted (adapted) with permission from Ref. 30. |
5.1. Mechanically enhanced specificity
This technology capitalizes on the highly specific mechanical responses of antigen-antibody immunocomplexes. The specific sensor A/analyte/sensor B-complex exhibits a longer lifetime under force compared to most nonspecific biomolecular complexes. This characteristic allows the true-to-false signal ratio to exponentially increase over time until it reaches the background signal, resulting in mechanically enhanced specificity and rapid testing. This mechanical dissociation kinetics-dependent principle sets it apart from most traditional immunodiagnostic technologies, which rely on a higher probability of forming a specific sensor A/analyte/sensor B-complex than forming nonspecific biomolecular complexes. This approach also differs from the traditional application of using magnetic force primarily for separating or enriching superparamagnetic microparticles bound with analytes from the surrounding solution for detection.
5.2. Convenient readout signals
Rapid and convenient detection of the signal is achieved by directly imaging the retained microbeads on the surface using a low-cost optical microscope equipped with a low-magnification objective. Single-particle resolution can be attained, forming the basis for high sensitivity. These images are automatically processed using a custom-written imaging analysis Python code, which yields the density (σ) of the retained microparticles for quantitative tests.
5.3. Rapid formation of specific sensor A/analyte/sensor B immunocomplex
The formation of a specific sensor A/analyte/sensor B-complex involves three molecules coming together to form a ternary complex. The SPMS technology expedites this step through multivalent interactions. Due to the higher density of sensor B-coated microbeads compared to water, they sink to the sensor A-coated surface, bringing the two types of sensor molecules in close vicinity, with a distance between sensor A and sensor B molecules on the order of 100 nm (as shown in Fig. 4). This corresponds to an effective local concentration of sensor B molecules surrounding a sensor A on the surface, approximately $c_{s}=1 \mu \mathrm{M}$. This creates an effective hotspot for fast analyte binding, enabling the rapid formation of specific sensor A/analyte/sensor B complexes that attach the microbeads to the surface. Once the sensor B-coated microbeads are attached via the initially formed specific ternary immunocomplex, additional complexes can form since both the microbead and the surface are densely coated with sensor molecules, stabilizing the attached microbeads.
5.4. Decreased impact from the Hook Effect
The close proximity between sensor A and sensor B molecules also significantly reduces the impact of the Hook effect. Due to the effective high concentration (approximately μM) of sensor B on microbeads relative to sensor A on the surface, the SPMS technology provides a wide working range for analyte concentration, where $K_{d}^{A}$ and $k_{d}^{B}<c_{a}<\mu \mathrm{M}$. In this range, high binding efficiency can be easily ensured considering typical nM range of antigen-antibody dissociation constant. In addition, compared to LFA, fewer rounds of dilution is needed to overcome the Hook effect for samples with high concentrations of analyte molecules. In typical LFAs, the typical concentration of sensor B-conjugated nanoparticles is up to nM range.49 Thus, to avoid a significant Hook effect in LFT-based assays, the analyte concentration should be much smaller than nM. However, this compromise in concentration may lead to lower binding efficiency, potentially falling below $K_{d}^{A}$ and $K_{d}^{B}$.
6. Applications of the SPMS technology
The SPMS technology has recently achieved success in quantifying anti-SARS-CoV-2-RBD IgG antibodies, a significant fraction of which consists of neutralizing antibodies.30 This quantification is performed in a single droplet of finger-pricked whole blood, with a remarkable feature of no solution exchange steps. The sample-to-answer time is just 30 min. The measured anti-RBD IgG titer, represented by the dilution factor corresponding to ½ of the saturated retained microbead density, accurately reflects the dynamics of antibody levels following immunization, infection, and natural waning30 (Fig. 5A and B).
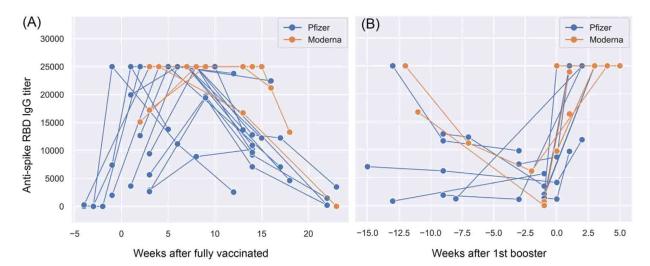
Fig. 5. Quantitative analysis of anti-RBD (Wuhan-Hu-1) antibodies level for infection and vaccine naïve individuals. (A) The titers of anti-RBD IgGs over time, measured in weeks after receiving the second dose on day zero of either the Pfizer-BioNTech (blue) or Moderna (organe) mRNA vaccine. (B) The impact of the first mRNA vaccine booster on the titer of anti-RBD antibodies. Reprinted with permission from Ref. 30. |
Notably, this antibody quantification assay doesn't necessitate solution exchanges, making it suitable for decentralized applications. However, titer quantification still poses challenges for further technology development, particularly for point-of-care (POC) or home-based use. These challenges can potentially be overcome by establishing a reference microbead density to distinguish between “high” and “low” levels. Using this approach, only a one-step dilution is required for the sample.
For example, concerning RBD IgG antibodies, evidence suggests a significant decline in serum neutralization strength post mRNA vaccination after 5-6 months.50,51 Based on a limited number of samples tested using the SPMS technology at a fixed 5000X dilution, the median post-vaccine retained microbead density decreases to approximately 150 per 100 μm × 100 μm. By setting this as a reference value, the SPMS technology can indicate whether the RBD IgG level significantly exceeds or falls below the reference.
The principles behind SPMS are generic, making the technology adaptable for a wide range of applications. Fig. 6 showcases a few examples, including the detection of nucleocapsid antigen (N-Ag) of SARS-CoV-2 and hCG spiked in working buffers, as well as GPR56, an adhesion GPCR, transfected in two different cell lines.

Fig. 6. Exploring diverse applications of SPMS: (A-B) The retained microbead density as a function of SARS-CoV-2 N-Ag (Omicron BA.2, Acrobiosystems) (A) and hCG antigen (BioResearch) (B) concentrations. (C-D) Detecting plasmid-expressed GPR56, an adhesion GPCR presented in HFF (C) and 293 T (D) cell lines, in 5X diluted cell lysates. In all these illustrative cases, we employed 30-min SPMS assays. |
7. Conclusion and future perspective
In this review, we have delved into the fundamental principles and common challenges that underlie immunodiagnostic technologies. Additionally, we introduced SPMS, a recently developed rapid immunodiagnostic technology distinguished by its unique feature of mechanically enhanced specificity.
For the SPMS assay, we elucidated the underlying principle of mechanically enhanced specificity and the swift formation of specific immunocomplexes. Furthermore, we discussed the signal readout and quantification methods, as well as its wide-ranging applications in the quantitative detection of liquid biomarkers. We highlighted its suitability for decentralized tests.
The current SPMS assay has several limitations that could be enhanced in the future. The current test kit design entails the utilization of a commercial microscope for imaging microbeads, thereby restricting the scalability of our application to point-of-care testing (POCT) diagnostics. Furthermore, our current imaging analysis depends on edge detection of the microbeads. At high density, the contrast between microbeads and the surrounding surface decreases, presenting a challenge for precise counting and diminishing the dynamic range of detection.
Our future efforts will focus on further refining SPMS technology to meet the requirements of POC diagnostic technology. These requirements emphasize affordability, sensitivity, specificity, user-friendliness, speed, robustness, equipment-free operation, and accessibility to end-users, as outlined by The World Health Organization (WHO).8 Specifically, our ongoing research revolves around developing an integrated test platform that includes a low-cost, easy-to-use compact optical reader and imaging analysis software. We aim to improve the microbead counting algorithm for a wider dynamic range and simplify sample preparation through one-time standard dilution, with the goal of enhancing user-friendliness suitable for POC diagnostic applications.
Ethical approval
This study does not contain any studies with human or animal subjects performed by any of the authors.
Declaration of competing interest
The authors declare that they have no known competing financial interests or personal relationships that could have appeared to influence the work reported in this paper.
Acknowledgment
The research was funded by the Singapore Ministry of Education Academic Research Funds Tier 2 (MOE-T2EP50220-0015), the Ministry of Education under the Research Centres of Excellence programme, the Ministry of Education, Decentralized GAP Funding (TAP2002020-05-18), NUS Efforts Against COVID-19 (NUSEAC) Funding, and National Research Foundation (NRF) of Singapore, through its NRF Investigatorship Programme (NRF-NRFI2016-03).
