
1. Introduction
Cell migration is a highly regulated and complex process that incorporates cell polarization, actin-driven protrusion, and cell adhesion [1]. Cell migration is regulated by many chemical and physical factors, such as biochemical cues (chemotaxis) [2], topography and chemical composition of the substrate (haptotaxis) [3], electric field (galvanotaxis) [4], and mechanical stimulation (mechanotaxis) [5]. The mechanical forces from extracellular environment usually include stretching force [6] or fluid shear stress (FSS) [7,8]. However, the responsive mechanism of cell migration to mechanical stimulation remains unclear.
The distribution of intracellular calcium ([Ca2+]i) influences cell migration. Researchers found a gradient of [Ca2+]i, i.e., it is higher in the rear side of a migrating cell than in the front side [9,10,11]. In addition, local Ca2+ signals called “Ca2+ flicker” or “Ca2+ pulse” occur at the leading edge of polarized and migrating cells [12,13,14]. FSS causes the rise of [Ca2+]i in cells. For example, [Ca2+]i distribution under 1-10 dyne/cm2 FSS stimulation reveals a repetitive intracellular “Ca2+ wave” originating from the upstream side to the downstream side of HUVECs [15]. Further research found that localized [Ca2+]i elevation appears inside the lamellipodium along the direction of cell migration [13,16]. However, the relation among mechanical stimulation, cell migration, and [Ca2+]i distribution remains unclear.
Osteoclasts are highly specialized multinucleated cells and responsible for the resorption of mineralized tissues, such as bone, dentin, and mineralized cartilage. The deformation caused by mechanical stimulation drives interstitial fluid within bone cavities to flow over the surface of trabeculae, causing osteoclasts or osteoblasts on the surface to suffer from oscillatory shear stress [17]. Compared with the molecular mechanism of osteoclast differentiation, the regulatory mechanism of the migration and localization of osteoclast precursors targeting the position of bone resorption are less well studied. Recent studies have demonstrated that extracellular Ca2+ regulates the localization and homing of osteoclasts or their precursors [18]. However, the functions of mechanical cues in this process are seldom considered.
The posture's change of human body, such as from sitting to standing, may create a unidirectional flow in the bones. Unidirectional flow induces calcium response in both osteoclasts and their precursors [19,20]. The oscillating flow is caused by the physiologically cyclic activity, such as walking or running. In addition, mechanosensitive cation-selective channels (MSCC), phospholipase C (PLC), and endoplasmic reticulum (ER) are the major signaling pathways for the mechanical stimulation-induced migration of osteoclast precursors [20]. In the present study, we tested the hypothesis that [Ca2+]i distribution is involved in FSS-induced cell migration. RAW264.7 monocytes were exposed to unidirectional or oscillatory flow (5 dyne/cm2) for 20 min, and then cell migration, [Ca2+]i distribution, and the effect of calcium signaling pathways were studied.
2. Materials and methods
2.1. Materials
The RAW264.7 cell was purchased from the European Collection of Cell Cultures (ECACC, Wiltshire, UK). Dulbecco's modified Eagle's medium (DMEM/high glucose), penicillin/streptomycin and trypsin-EDTA were purchased by Hyclone (Thermo Scientific, Beijing, China). Fetal Bovine Serum (FBS) and Pluronic F-127 were obtained from Invitrogen (Eugene, USA). Fluo-4 AM was purchased from Dojindo (Rockville, Japan). Gadolinium Chloride (Gd3+), Thapsigargin (TG) and Dimethyl sulfoxide (DMSO) were purchased from Sigma (St. Louis, USA). U73122 was purchased from MCE (New Jersey, USA) and EGTA was obtain from Gibco (Carlsbad, USA). Circular slides (d = 35 mm) were provided from Huanyujinying (Beijing, China).
2.2. Custom-made parallel flow chamber
We adopted a custom-made parallel flow chamber to apply FSS on cells (Fig. 1a). One hole in the cover made with plexiglass was connected to the vacuum pump to provide negative pressure so that the cover, the gasket, and the slide were mounted together (Fig. 1b). The rubbery gasket with a rectangular hole was used to form the chamber 5 mm in width (w) and 0.5 mm in height (h) (Fig. 1c). The flux Q in the flow chamber was precisely controlled by a peristaltic pump, and the wall FSS τ experienced by cells was calculated using the equation τ=6Qη/(wh2), where η is the viscosity coefficient of fluid. After the fluid was driven by the pump to flow in one direction, unidirectional flow was applied on the cells. In addition, the pump's rotation direction was changed every 5 min to expose the cells to oscillatory flow.
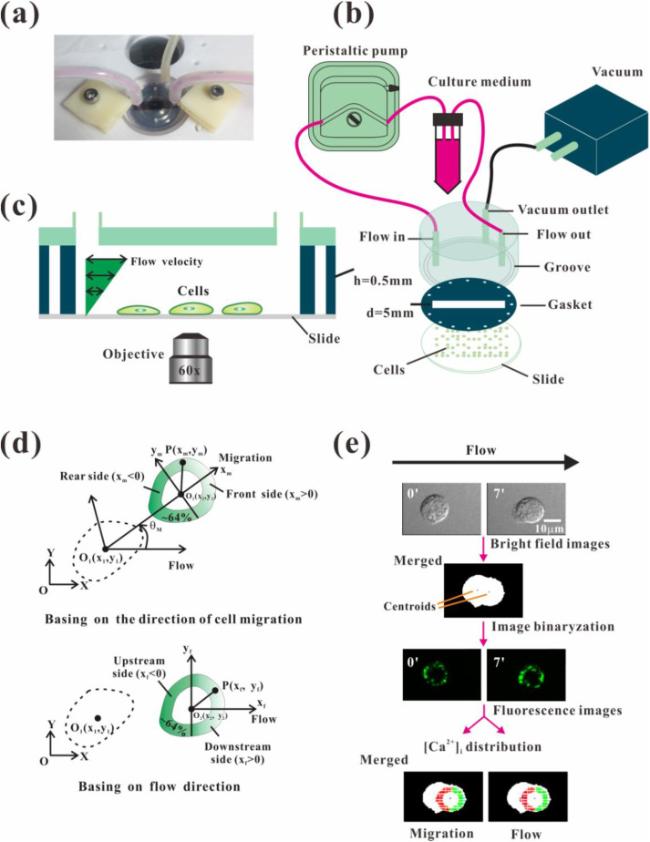
Fig. 1. Flow chamber and image processing. (a) Custom-made parallel flow chamber. (b) Schematic graph of experiment setup. (c) Schematic of flow chamber. (d) Definition of coordination systems for image processing, including local coordinate system xmO2ym along the migration direction and xfO2yf along the flow direction. The dotted and solid lines indicate the contours of a cell at its former and later location during migration. (e) Image processing for determining the parameters of cell migration and [Ca2+]i distribution under fluid flow. In the [Ca2+]i distribution graph, the red or green dots denote the points in the rear or front side along the migration direction and in the upstream or downstream side along the flow direction. |
2.3. Flow stimulation and [Ca2+]i measurements
The RAW264.7 cell line was cultured in DMEM supplemented with 10% heat-inactivated FBS and 1% penicillin/streptomycin solution at 37 °C in a humidified atmosphere of 5% CO2. The medium was changed every 48 h. Before flow stimulation experiments, RAW264.7 monocytes were seeded on circular slides at a density of 2 × 10⁴/cm2 for 5 h. The cytosolic calcium was stained with 5 μM Fluo-4 AM in DMSO and 0.04% Pluronic F-127 for 1 h in culture medium at 37°Cin a humidified atmosphere of 5% CO2. The circular slide was rinsed with dye-free medium twice and was mounted in a custom-made parallel flow chamber. Then the flow chamber was immobilized on Olympus IX71 confocal microscope with a xenon illumination system. The installation was carried out with extreme caution to minimized the early irritations. The 20-min resting period was waited to recover the normal state for calcium distribution in cytosolic. Two levels of wall FSS (0 and 5 dyne/cm2) were carried out to stimulate cells. The cell migration and [Ca2+]i distribution were recorded with PMT detector (FV1000) for 20-min. The pH value of flow medium was measured as about 7 by pH test paper.
We also investigated the influence of calcium signaling pathways by incubating the slides with blocking reagents before the cells were exposed to FSS. In brief, 10 μM Gd3+ was supplied as the MSCC blocker, the calcium stored in the ER was depleted with 1 μM TG, and 10 μM U73122 was adopted to inhibit PLC. During the above blocking tests, 10 min incubation of chemical reagents was applied. Extracellular calcium was removed by adding 4 μM EGTA in DMEM. The blocking reagents were maintained during FSS stimulation.
2.4. Assessment of [Ca2+]i distribution during flow-induced cell migration
Assessing the distribution of [Ca2+]i is important to investigate its relation to fluid flow and cell migration (Fig. 1d and e). Two normalized ratios of fluorescent intensity (RFI) were defined, i.e., the rear-to-front ratio RM along the direction of cell migration and the upstream-to-downstream ratio RF along flow direction. In order to verify the relationship between the cell migration and [Ca2+]i distribution, the migration speed in the direction of cell migration direction was defined as DM. According to the cosine value (cos θ) of the cell migration direction relative to the flow field direction, the migration velocity in the flow field was defined as DF =DM cos θ. The theories and methods of image processing are detailed in the Appendix. After a slide with cells was mounted on the flow chamber, culture medium with a preliminary FSS of 1 dyne/cm2 was used. Therefore, for the case of no-flow, we defined the above direction of initial fluid flow as the flow direction to calculate RF because it may cause the gradient distribution of intracellular calcium even though the cells were rested under the microscope for 20 min before experiments.
2.5. Statistical analysis
In order to study the changes of [Ca2+]i distribution,migration speed and angle over time under FSS, the data were firstly analyzed by the means of mean values between cells in the same groups at different times. Finally, for study the total changes, the analysis of means in the time was further conducted.
More than three slides and 12-28 cells were tested for each FSS level or chemical treatment group (Table 1). All results were presented as the mean ± standard deviation (SD). Statistical analyses were performed using a SPSS version 25.0 for Microsoft windows (SPSS, Chicago, IL, USA). The results of single sample W-S validation showed the data conform to normal distribution or not (Table S2, Fig. S3). Independent t-tests were used to determine significant difference between no-flow and non-treated group. Paired t-tests were used to determine significant difference between RM and RF, DM and DF in same conditions. One-way analysis of variance (ANOVA) with Bonferroni's post hoc analysis was performed to determine statistical differences between mean values of different pathway inhibited groups. If equal variance not assumed, Games-Howell's post hoc analysis was performed. TG, U73122, Gd3+ and Ca2+ free medium treated groups were compared with the non-treated group. If the data is not normally distributed, statistical differences between the mean values of different groups were determined using nonparametric Wilcoxon Signed-Rank Test for paired samples, Mann-Whitney Test for two independent samples and Kruskal-Wallis Test for above two samples. Statistical significance was defined as p < 0.05.
Table 1. The number of slides and cells in each group during 20 min. |
| Unidirectional flow | Slides | Cells | Oscillatory flow | Slides | Cells |
|---|---|---|---|---|---|
| No-flow | 3 | 12 | No-flow | 3 | 12 |
| Non-treated | 8 | 28 | Non-treated | 5 | 18 |
| TG | 5 | 16 | TG | 4 | 19 |
| U73122 | 4 | 18 | U73122 | 7 | 26 |
| Gd3+ | 3 | 16 | Gd3+ | 4 | 15 |
| Ca2+ free | 6 | 18 | Ca2+ free | 4 | 22 |
3. Results
3.1. Unidirectional flow increases the gradient [Ca2+]i distribution in the flow direction
The time-lapsed images of cells without fluid flow or under unidirectional flow were recorded for 20 min (Fig. 2a). Unidirectional flow (5 dyne/cm2) significantly enhanced the migration speed of cells along the flow direction and increased the fluorescence intensity (i.e., higher [Ca2+]i) in the rear or upstream side of a migrating cell compared with no-flow. Statistical analysis results revealed that flow stimulation significantly increased RF along the flow direction compared with the no-flow group (Fig. 2b). Fig. 3 presents time-dependent changes in RFI, migration speed, and migration orientation in every 1 min during 20 min unidirectional flow stimulation. For the no-flow group, RM almost oscillated around 0 over time, and RF remained basically steady between 0.05 and 0.10 (Fig. 3a, upper). Different from the no-flow group, the RM of the unidirectional flow group was initially constant in the first 8 min and then oscillated around 0 over time, but RF gradually increased until 16 min before becoming steady (Fig. 3b, upper). These results indicated that the gradient distribution of [Ca2+]i increased under unidirectional flow stimulation in the flow direction rather than along the migration direction.
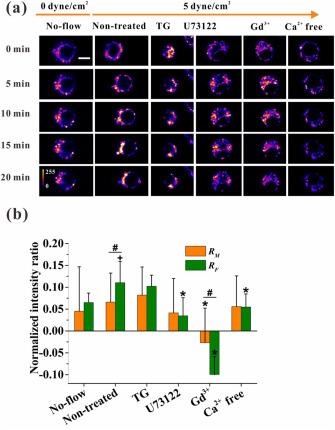
Fig. 2. Effect of unidirectional flow (5 dyne/cm2) on [Ca2+]i distribution and its regulatory signaling pathways. (a) Time-lapsed pseudo-color images of RAW264.7 cells under unidirectional flow with different treatments. Scale bar, 10 μm. (b) Normalized ratio of fluorescence intensity under no-flow or unidirectional flow with different treatments along the migration direction (RM) and flow direction (RF), respectively. Plus (+) represents significant difference between non-treated and corresponding no-flow group. Asterisk (∗) means significant difference with corresponding non-treated group, p < 0.05 (+, ∗, #). |
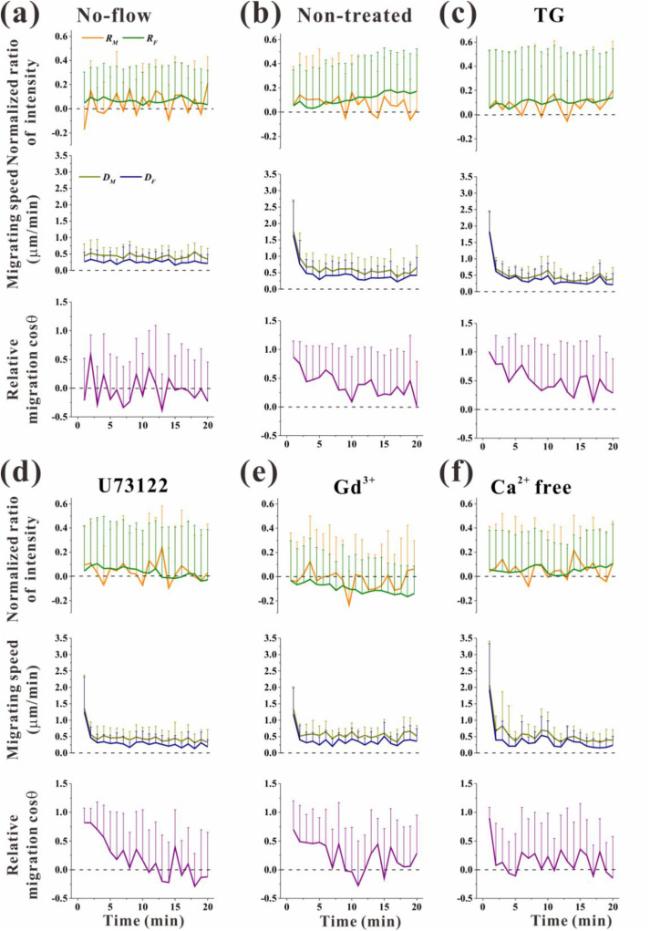
Fig. 3. Statistical analysis on the normalized ratio of fluorescence intensity, migration speed, and migration orientation of RAW264.7 cells under different treatments. (a) No-flow group. (b) Non-treated group, (c) TG group, (d) U73122 group, (e) Gd3+ group, and (f) Ca2+-free group under oscillatory flow (5 dyne/cm2). Each data point was obtained from at least 12 cells for each group every 1 min during 20 min unidirectional flow stimulation. |
DM and DF had a similar tendency over time, although the magnitude of DM was higher than that of DF (Fig. 3a and b, middle; Fig. S5a). In the absence of flow, the cells migrated at a speed of about 0.5 μm/min. Unidirectional flow stimulation significantly improved the migration speed up to 1.7 μm/min but quickly decreased to 0.5 μm/min at 5 min after the onset of flow. Migration orientation was shown with the cosine value of angle θp between the migration direction and the flow direction. For the no-flow group, the mean value of cos θp was close to zero, indicating that the cells migrated randomly but not along the flow direction (Fig. 3a, lower; Fig. S5b). When the fluid flow level was increased up to 5 dyne/cm2, cos θp was significantly higher than zero and oscillated from 0.2 to 0.8, showing that the cells migrated along flow direction (Fig. 3b, lower; Fig. S5b).
3.2. MSCC/PLC regulates unidirectional flow-induced [Ca2+]i distribution
Four pathways, namely, ER, PLC, MSCC, and extracellular calcium, were chosen in the present study to probe the regulatory mechanism of flow-induced [Ca2+]i distribution and cell migration (Fig. 2a; Fig. S4a-e). For the non-treated group with unidirectional flow (5 dyne/cm2), RM was 0.066 and RF was 0.110 (Fig. 2b). In addition, RM and RF were significantly reduced to −0.027 and −0.079 for the MSCC-blocking group, respectively. When PLC signaling pathway was inhibited or extracellular calcium was removed, only RF was significantly smaller than the non-treated group, i.e., 0.035 and 0.055, respectively. Compared with non-treated group, depleting Ca2+ in the ER had little influenced [Ca2+]i distribution. As for the change in RFI over time under unidirectional flow, RM remained oscillatory around zero in four calcium signaling pathway inhibited groups. Unlike RM, RF was higher than zero and finally increased to 0.140 and 0.107 after 20 min unidirectional flow stimulation when Ca2+ ions were depleted in the ER or extracellular calcium was removed (Fig. 3c and f, upper). This uptrend is close to the findings observed in the non-treated group, although it peaks at 0.182 in 16 min (Fig. 3b, upper). However, after blocking MSCC with Gd3+ or PLC with U73122, RF decreased to be negative (Fig. 3d and e, upper).
Compared with the non-treated group, DM and DF for the PLC-blocking group and DM for the ER-inhibited group were significantly reduced (Fig. S5a). In addition, the cosine value of relative migration orientation significantly decreased in the group treated with Ca2+-free medium compared with the non-treated group (Fig. S5b). This result can be reconfirmed by the time-dependent variation of cosine values (Fig. 3c-f, lower).
3.3. Oscillatory flow stimulates cell migration followed by adjustment of [Ca2+]i distribution
RAW264.7 cells exposed to oscillatory flow (5 dyne/cm2) for 20 min showed fluid flow level-dependent [Ca2+]i response and fluid flow direction-dependent migration (Fig. 4a). Specifically, oscillatory flow caused higher fluorescence intensity, and the direction of cell migration coincided with the direction of oscillatory flow. Statistical analyses showed that both RM and RF were larger than zero in the no-flow group (Fig. 4b). The positive value of RF was due to the initial flow stimulation of supplying culture medium as mentioned in the Materials and Methods Section. However, oscillatory flow (5 dyne/cm2) significantly reduced RF compared with no-flow. Specifically, the 5 dyne/cm2 oscillatory flow level significantly reduced upstream-downstream RFI compared with no-flow group. Within the initial 15 min since the onset of oscillatory flow, the reversal of flow direction every 5 min adjusted the [Ca2+]i distribution along the migration direction rather than along the flow direction. Specifically, RM had an increasing trend even after 5 min unidirectional flow stimulation (Fig. 5b, upper). Compared with RM, RF only increased before 5 min and then maintained as 0 during the initial 15 min since the onset of oscillatory flow. After exposure to oscillatory flow stimulation for 15-20 min, both RM and RF did not increase during 5 min unidirectional flow stimulation, indicating that the cells lost the ability to adjust their [Ca2+]i distribution with the change in flow direction.
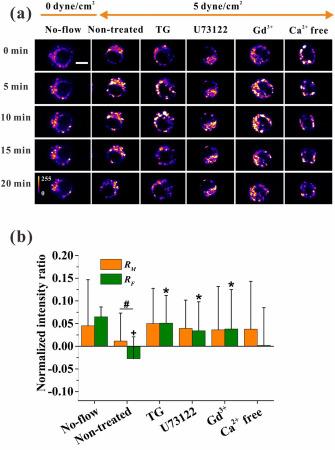
Fig. 4. Effect of oscillatory flow (5 dyne/cm2) on [Ca2+]i distribution and its regulatory signaling pathways. (a) Time-lapsed pseudo-color [Ca2+]i images of RAW264.7 cells under oscillatory flow with different treatments. Scale bar, 10 μm. (b) Normalized ratio of fluorescence intensity under no-flow or oscillatory flow with different treatments along the migration direction (RM) and flow direction (RF), respectively. Plus (+) represents significant difference between non-treated and corresponding no-flow group. Asterisk (∗) means significant difference with corresponding non-treated group, p < 0.05 (+, ∗, #). |
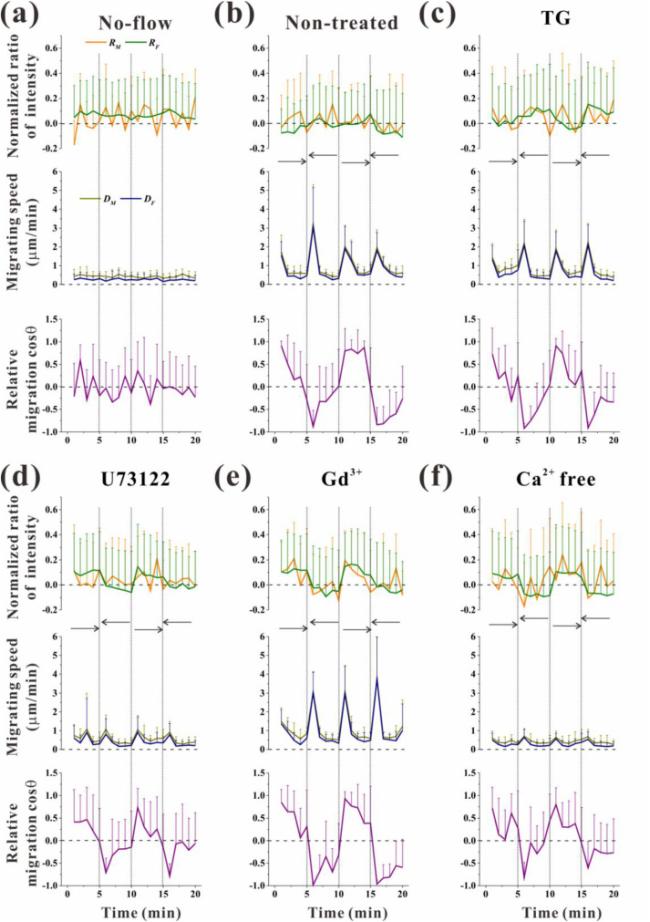
Fig. 5. Statistical analysis on the normalized ratio of fluorescence intensity, migration speed, and migration orientation of RAW264.7 cells under different treatments. (a) No-flow group, (b) Non-treated group, (c) TG group, (d) U73122 group, (e) Gd3+ group, and (f) Ca2+-free group under oscillatory flow (5 dyne/cm2). Each data point was obtained from at least 12 cells for each group in every 1 min during 20 min oscillatory flow stimulation. |
In addition, the cells migrated quickly at the initial time of reversing flow direction, and the migration speed reached 3 μm/min (Fig. 5b, middle). However, migration speed reduced to less than 0.5 μm/min in the following unidirectional flow stimulation, like 20 min unidirectional flow stimulation (Fig. 3b, middle). DM and DF of non-treated groups were significantly enhanced compared with the no-flow group (Fig. S6a) but did not influence the orientation of cell migration (Fig. S6b).
3.4. Extracellular calcium/MSCC/PLC/ER regulates oscillatory flow-induced [Ca2+]i distribution
Compared with the non-treated group under oscillatory flow, the blocking of the calcium signaling pathway of ER, PLC or MSCC significantly increased the mean value of RF up to 0.051, 0.034 and 0.038 respectively within 20 min but removing extracellular calcium did not (Fig. 4b; Fig. S4f-j). However, no significant difference in RM was found when the four pathways were blocked. Compared with the non-treated group (Fig. 5b, upper), RF almost maintained constant values during each 5 min unidirectional flow stimulation, and the values for subsequent 5 min durations were nearly symmetrical relative to the zero axis (Fig. 5c-f, upper). This result indicated that the initial [Ca2+]i distribution along the flow direction was not influenced by the change in oscillatory flow direction. However, the variation in RM did not have a similar feature to the variation in RF, and no obvious feature can be found for RM. Like those in the non-treated group, DF and DM in the inhibition groups initially increased after change flow direction and then decreased during 5 min unidirectional flow stimulation (Fig. 5c-f, middle). The cosine of migration orientation after blocking the calcium signaling pathways also displayed similar features to the non-treated group (Fig. 5c-f, lower; Fig. S6b).
4. Discussion
The present study explored the relation among cell migration, [Ca2+]i distribution, and FSS for osteoclast precursors. The results showed that unidirectional flow increase the upstream-to-downstream [Ca2+]i gradient of cells but oscillatory flow decreases this gradient (Fig. 2, Fig. 4b). The results also suggest that the [Ca2+]i distribution in the migration direction is independent of flow application or the reverse of flow direction, but the [Ca2+]i distribution in the flow direction is determined by the [Ca2+]i distribution-adjusting ability of cells and flow stimulation. Furthermore, the molecular mechanism of the above phenomenon was investigated by inhibiting the MSCC, PLC, and ER pathways and removing extracellular Ca2+. We further analyzed the RFIs for the cells with three different levels of mobility and found that the highly motile cells with spontaneous migration had the higher RM than the “lazy” cells, but there was no correlation between the RFIs and cell migration (Fig. S7).
Cell migration is a cyclical process, during which the lamellipodia protrudes forward, followed by a pause, and finally the tail is withdrawn [21,22]. This periodic movement coincides with what we observed in osteoclast precursor RAW264.7 cells in this study (Figs. S8 and S9). As shown in Fig. 3a (middle), the cellular centroids moved about 0.4 μm/min to 0.6 μm/min and exhibited an oscillatory manner in 20 min without fluid flow. The unidirectional flow represents a physiological but unusual mechanical stimulus, e.g., a posture change of the human body from sitting to standing. The unidirectional flow increased the migration speed to about 1.5 μm/min at the onset of flow stimulation. However, the speed decreased to the values oscillating around 0.5 μm/min after 2 min. Interestingly, RF revealed high upstream-to-downstream ratio and RM changed periodically along the migration direction (Fig. 3a and b, upper). This oscillatory migration with [Ca2+]i gradient distribution has been found in primarily isolated osteoclasts [23]. Previous studies demonstrated that cells under continuous mechanical loading gradually accommodate to mechanical microenvironment and decrease their ability of responding to mechanical stimulation [24,25,26]. Thus, the spatiotemporal dynamics of [Ca2+]i is a critical driving factor of osteoclast migration.
The oscillating flow is related with cyclic movement of musculoskeletal system such as walking and running. Once flow direction was changed under oscillatory flow stimulation, the cells initially moved along the actual flow direction and then migrated randomly (Fig. 5a and b, lower). The migration speed of the cells reached 1.5 μm/min when the flow direction was changed but slowed down to 0.5 μm/min, like that under unidirectional flow stimulation. Responding to the change in flow direction, [Ca2+]i was distributed with an increasing rear-to-front gradient along the migration direction rather than along the flow direction every 5 min during the early 15 min under oscillatory flow stimulation (Fig. 5b, upper). This result indicates that cell migration can be enhanced after changing the flow direction, accompanying with the redistribution of [Ca2+]i along the migration direction. Upon exposure to oscillatory flow stimulation for longer than 15 min, the [Ca2+]i distribution along the migration direction was similar to that along the flow direction. The phenomenon indicated that once cells lost their ability to adjust the [Ca2+]i distribution in the migration direction, they simultaneously lost the ability to adjust the [Ca2+]i distribution along the flow direction. Thus, the [Ca2+]i distribution in the flow direction is determined by fluid flow and the ability of the cells to regulate the [Ca2+]i distribution.
Calcium in the cytosol has two sources, namely, intracellular calcium reservoir (ER) and extracellular Ca2+. We adopted thapsigargin and U73122 to block the ER pathway and used gadolium and Ca2+-free medium to block the entry of extracellular Ca2+. In this study, compared with non-treated group in unidirectional flow, expect the ER-inhibited group, the RM and RF of the PLC-blocking, MSCC-blocking and extracellular calcium removing groups decreased, even though there was no significant decrease in RM in PLC-blocking or extracellular calcium removing groups. Previous studies on migrating sheets of endothelial cells also showed that the ER inhibitor TG increased the Ca2+ gradient in migrating cells and knocking down ER- Ca2+ATPase increased intracellular Ca2+ levels, which were paralleled by opposing changes in migration speed [3]. Furthermore, we found that DM of ER-inhibited and PLC-blocking groups significantly decreased compared with non-treated group, but MSCC-blocking and extracellular calcium removing groups not. In addition, the DF and the cosine value of relative migration orientation of the PLC-blocking, MSCC-blocking and extracellular calcium removing groups decreased, even though only the DF of PLC-blocking group and the cosine value of relative migration orientation of extracellular calcium removing group were decreased significantly. Thus, when blocking either the intracellular or extracellular calcium pathway, expect the ER-inhibited group, cells do not maintain the rear-to-front [Ca2+]i gradient, resulting in the loss of directional cell migration and decrease migration speed (Fig. 6).
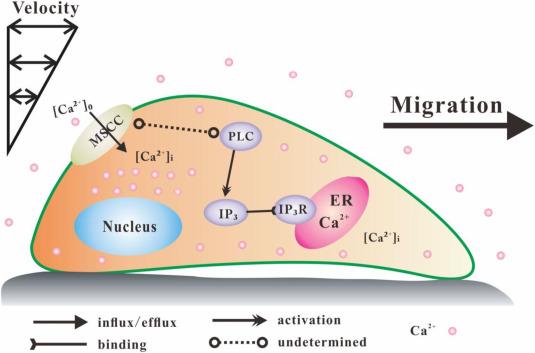
Fig. 6. Schematic of the FSS-induced migration of RAW264.7 cells and calcium signaling pathways. Osteoclast precursors move after being exposed to Unidirectional or oscillatory fluid flow and then the gradient distribution of [Ca2+]i can be found in the cells although long-lasting oscillatory flow may reduce the adjustment of [Ca2+]i distribution. This flow-induced [Ca2+]i distribution and cell migration is regulated by MSCC-PLC-ER pathway. |
Under oscillatory flow stimulation, the present results showed that the ER-inhibited, PLC-blocking, MSCC-blocking groups had a significant different in RF compared with non-treated group, while extracellular calcium removing group had no different (Fig. 4b) but significantly reduced migration speed (Fig. S6a). Compared with non-treated group, the normalized RM of inhibition groups did not reveal increasing rear-to-front gradient in each 5 min unidirectional flow stimulation during early the 15 min of oscillatory flow stimulation. Previous experiments have shown that removal of extracellular calcium by EGTA (2 mM) does not affect the frequency or amplitude of cellular calcium impulses, but reduces cytoplasmic calcium levels [14]. Over a decade ago, it was shown that calcium flickers arising from Ins(1,4,5)P3R2 and TRPM7 have an essential role in steering migrating [27]. The reason is that inhibiting the downstream pathway inositol-1,4,5-trisphosphate (Ins(1,4,5)P3) receptor (Ins (1,4,5) P3 R) of PLC leads to the decrease of calcium flicker amplitude. Given the transient receptor potential (TRP) channel is an important MSCC channel. While calcium entry by means of TRPM7 is locally amplified by calcium release through Ins(1,4,5)P3R2 in the event of a calcium flicker. The study also found that inhibition of endoplasmic reticulum calcium recycling with the Ca2+ATPase inhibitor thapsigargin halved flicker amplitude without affecting flicker probability. Taken these findings together, we concluded that both intracellular and extracellular calcium pathways are the critical regulatory pathways for oscillatory flow stimulated cell migration (Fig. 6).
When the MSCC pathway was blocked with Gd3+ under unidirectional flow stimulation, the [Ca2+]i distribution revealed negative rear-to-front RFI, which was significantly different from those in other blocking groups (Fig. 3e). The time-lapsed images of the Gd3+-inhibiting group showed that some cells with a positive rear-to-front gradient of [Ca2+]i distribution gradually changed to the reverse distribution, i.e., with a low value in the rear and a high value in the front. When substrate stretching force is exerted on fibroblasts, blocking MSCC with Gd3+ also inhibits cell migration [28]. However, which MSCC ion channel is responsible for this flow-induced cell migration or [Ca2+]i distribution remains unknown. Local depletion of Ca2+ in the ER may activate STIM1, a mediator of store-operated Ca2+ entry that regulates the migration and adhesion of endothelial cells [3]. When TRPC1 is knocked down, epithelial cells partially lose their polarity and the ability to persistently migrate into a given direction [29]. Another study shows that the expression of high level of TPRM7 establishes less invasive metastatic lesions [30]. Further works are still needed to clarify the MSCC channel regulating flow-induced cell migration.
In conclusion, fluid flow first moves cells, activates calcium signaling pathways, and finally regulates [Ca2+]i distribution in the direction of cell migration or flow direction (Fig. 6). Both unidirectional flow and oscillatory flow activate the MSCC-PLC-ER calcium signaling pathways and regulate [Ca2+]i distribution in preosteoclasts. If the pathways are inhibited, then the cells lose the capability to influence cell migration through mediating [Ca2+]i distribution.
Author contributions
BH and SRW designed the research; SRW performed the experiment with the assist of YZ; SRW, BH and QS analyzed experimental data; SRW and BH drafted the article.
Ethical standards
No human or animal studies were carried out by the authors for this article.
Conflict of interest
Shurong Wang, Qing Sun, Yang Zhao, Bo Huo declare that they have no conflicts of interest.
Acknowledgments
This work was supported by the National Natural Science Foundation of China [12072034 (BH), 11572043 (BH)].
Appendix A. Supplementary data
Supplementary data to this article can be found online at https://doi.org/10.1016/j.mbm.2023.100012.
