
1. Introduction
Sepsis is defined as life-threatening organ dysfunction caused by a dysregulated host response to infection, and clinical studies have shown that the risk of septic shock and death is higher in sepsis associated with severe microcirculatory dysfunction and impaired cellular metabolism than in sepsis alone [1,2]. Therefore, research into the blood flow characteristics of the microcirculation in sepsis and the mechanisms of improvement by drugs such as atropine-like agents anisodamine and anisodine may be able to reduce the risk of development of septic shock and death.
Clinically comprehensive treatment strategies such as primary infection clearance, early antibacterial therapy and fluid resuscitation are used to restore macrocirculatory in the management of sepsis [1]. However, improvement in macrocirculatory hemodynamics such as mean arterial pressure (MAP) and cardiac output is not an accurate predictor of prognosis, although they can reduce the mortality in patients with sepsis [3]. The Sepsis and Mean Arterial Pressure (SEPSISPAM) trial compared the mortality in septic shock patients undergo resuscitation with a high mean arterial pressure (80-85 mmHg) and low mean arterial pressure (65-70 mmHg), and the results showed that there was not significant difference in mortality at 28 or 90 days between the two groups [4]. After early aggressive fluid resuscitation treatment, metabolic acidosis and multiple organ dysfunction in those patients continued to progress even when macrocirculatory parameters are well controlled, with approximately 50% eventually developing septic shock [5,6]. In the posthoc analysis of the SEPSISPAM trail, after adjustment for MAP and other redundancy factors, the presence of mottling was associated with a significantly higher risk of death at day 28 and 90 than the arterial lactate level [7].
Mottling is an acceptable marker of microcirculation impairment [8]. Microcirculatory dysfunction is believed to be a major cause of the progression of organ damage [9,10]. Potential mechanisms leading to abnormal microcirculatory blood flow include endothelial dysfunction and the consequently increased platelet and leukocyte adhesion [11]. Pathogens activate endothelial cells (ECs) and immune cells to produce cytokines and chemokines, activated ECs express adhesion factors to bind immune cells, and then immune cells continually recruit to the site of injury, eventually leading to the inflammatory cytokine storm with glycocalyx shedding, increased endothelial cell permeability and impaired microcirculation [12]. Several cytokines such as interleukin-6 (IL-6), C-X-C motif chemokine ligand 8 (CXCL-8) and tumor necrosis factor (TNF)-α are significantly increased in sepsis patients compared to normal individuals, which further increased adhesion factors such as E-selectin, P-selectin, intercellular adhesion molecule-1 (ICAM-1) and integrin, promoting leukocyte adhesion, rolling and infiltration. During sepsis, leukocyte-endothelium adhesion events and duration were increased, with decreased leukocyte wall rolling velocity [13,14]. However, the dynamic interaction between leukocytes to ECs in microcirculation during sepsis are still not well understood.
It has been shown that the total vascular density, functional capillary density, perfused microvascular density, proportion of perfused small vessels and microcirculatory flow index were reduced and flow heterogeneity index was increased [15]. However, the blood flow characteristics and microcirculatory changes during sepsis and its effective interventions are remained unclear. The organs supplied by the mesenteric circulation account for only 5% of the total body weight yet command a substantial proportion (20-30%) of the total cardiac output under normal hemodynamic conditions [16]. Although the mesenteric hemodynamic response to septic shock is a very complex issue, the intestine is considered to be the “motor of multiple organ failure” in sepsis [10]. During sepsis, systemic inflammatory responses caused an increase in vascular permeability [17]. The activated ECs and enhanced leukocyte-EC interactions also appeared in the lesions of mesenteric microcirculatory dysfunction, which contributed to the microvascular obstruction and tissue damage [18]. Thus, we investigate the flow patterns and leukocyte-endothelium interactions during the mesenteric microcirculatory dysfunction and drug interventions using the septic shock rats.
Anisodamine and anisodine are both atropine (ATP)-like agents. Both anisodamine hydrobromide (Ani HBr) and anisodine hydrobromide (AT3) are active ingredients derived from the roots of a Chinese specialty plant Scopolia tangutica maxim. In current, anisodamine used in clinical included synthesized racemic anisodamine (Race Ani) and natural Ani HBr. Race Ani has two pairs of enantiomers [19]. The relative amount of the isomers (6R, 2′S), (6S, 2′R), (6S, 2′S), and (6R, 2′R) in Race Ani was 30%, 30%, 20%, and 20%, respectively. Among them, the 6R, 2′S configuration is Ani HBr, which is responsible for the antispasmodic effect [20]. Ani HBr suppressed the proinflammatory cytokines and oxidative stress, alleviating multiply organs injury in rats with septic shock [21]. Ani HBr attenuates lipopolysaccharide (LPS)-induced acute kidney injury by protecting against LPS-induced inflammatory cytokines, mitochondrial dysfunction, and oxidative stress [22]. However, the roles of anisodamine and anisodine in the alteration of blood flow characteristics of the microcirculation and leukocyte-endothelium interaction in sepsis remains unclear.
In this study, the mesenteric microcirculatory blood flow in the LPS-induced sepsis rats were observed using an intravital microscope in vivo, the microcirculatory flow patterns with their characteristics, as well as the leukocyte dynamics in microcirculation were evaluated. Two patterns including intermittent and reciprocating motions were characterized for abnormal septic microcirculatory flow. Ani HBr and AT3 improve the microcirculatory hemodynamics and attenuate the leukocyte adhesion.
2. Materials and methods
2.1. Animals
This study was conducted in accordance with the recommendations of the Guide for the Care and Use of Laboratory Animals and approved by the Animal Research Ethics Committee of the Experimental Animal Center of Sichuan University (No. 2019-5-15). Male Sprague-Dawley rats (200-250g) were provided by the Experimental Animal Center of the Sichuan University (Chengdu, China). The rats were housed in cages at constant temperature (25 ± 2 °C), constant humidity (55 ± 10%), and a 12:12 light/dark cycle in the standard housing environment. All rats were allowed access to food and water ad libitum, but they were fasted for 1 h before the experiments.
2.2. The establishment and groupings of the LPS infected shock rat model
All rats were randomly divided into the following six groups: Control (CT) group (n = 6), LPS group (n = 6), Ani HBr group (n = 6), AT3 group (n = 6), Race Ani group (n = 6) and ATP group (n = 6). The rats were kept grouped in cages.
The LPS group was intravenously administrated with 5 mg/kg LPS (L2880; Sigma, Mo, USA.) by tail vein injection, while an equal volume of saline was used for CT groups. The dose responses of Ani HBr to septic shock rats have been investigated in our previous studies [21,22]. In the present study, the LPS rats were administrated with 5.4 mg/kg Ani HBr (Chengdu NO.1 Pharmaceutical Co., Ltd, China), 5.4 mg/kg AT3 (Chengdu NO.1 Pharmaceutical Co., Ltd), 5.4 mg/kg Race Ani (Suicheng Pharmaceutical Co., Ltd, China) and 5 mg/kg ATP (Suicheng Pharmaceutical Co., Ltd, China) by tail vein injection at 4 h intervals [22], for Ani HBr, AT3, Race Ani, and ATP groups, respectively. The MAP and heart rate (HR) were measured by Medlab non-invasive pressure monitoring system (KEW, Nanjing, China). The blood specimens were collected from the orbital venous plexus at 24 h after LPS injection, and plasma was isolated by centrifugation at 1500g for 15 min at 4 °C within 1 h after blood collection. After 24 h, the mesenteric microcirculation was observed. The process of animal model establishment and grouping are described in Fig. 1.

Fig. 1. The process of animal model establishment and grouping. |
2.3. Video acquisition of microcirculation in rat mesentery
The animals were anaesthetized by intraperitoneal injection of 60 mg/kg pentobarbital sodium and intravenously injected with 20 mg/kg pentobarbital sodium per hour during the experiment. The rats were placed on the operating table and part of the ileum near the ileocecal junction was gently removed from the abdomen (away from the site of infection) to expose the mesentery. The exposed mesentery was flattened and immersed in a circular transparent plate with a 37 °C constant temperature water bath at the edge of the operating table. The dynamics of the mesenteric microcirculation were observed under an intravital microscope under 12 V, 100 W white light conditions with a BI-2000 Medical Image Analysis system (TECHMAN, China). The observation site was selected under the 40× objective lens, and a camera was connected to the microscope to facilitate observation of the magnified image on the display and to record the observation contents as videos.
2.4. Analysis of flow pattern characteristics
The videos of local microcirculation in rat mesentery were screened and classified, and the velocity analyses of blood flow and leukocyte were performed using the Image-Pro Plus software (Version 6.0, Media Cybernetics, Inc, USA).
The velocity was measured at 7 random time points in the video and recorded as the average velocity of the blood flow.
For the flow pattern of intermittent motion, the average velocity of the blood flow at 1 s before stopping was defined as v0. The average velocity of the blood flow during intermittent motion (exclude the duration of cessation of blood flow) was $\bar{v}$. The total duration of intermittent motion was t. The average velocity of the blood flow at 1 s after the re-flowing was vt.
For the flow pattern of reciprocating motion, the average velocity of the blood flow at 1 s before changing the direction was defined as v0. During reciprocating motion, the average velocity in the back direction was v−, and the average velocity in the forward direction was v⁺. The total duration of reciprocating motion was t. The average velocity of the blood flow at 1 s after the re-flowing was vt.
The leukocytes with clear visible morphology were tracked, and then their adhesion time and near-wall rolling speed were calculated.
2.5. Measurement of inflammatory cytokines
IL-6 and TNF-α in plasma were detected using an IL-6 ELISA kit (ERC003.96T, Neobioscience, China) and TNF-α ELISA kit (ERC102A.96T, Neobioscience, China), respectively. The experiments were performed strictly according to the requirements of the kits.
2.6. Statistical analysis
The data were expressed as mean ± standard deviation (SD). All analyses were performed using SPSS 25.0 software (IBM, USA). Statistical significance was determined by one-way analysis of variance (ANOVA). P < 0.05 was considered as significant.
3. Results
3.1. Improvement of MAP and HR in the systemic circulation of the LPS-induced septic shock rats
Reduced MAP and increased HR are hallmarks of the systemic circulation in septic shock and therefore serve as key indicators for the successful establishment of a septic shock model [23]. The MAP and HR of the rats in each group were closely monitored (Fig. 2A and B). Notably, MAP was significantly decreased in the LPS group (p < 0.001), while HR was significantly increased compared to the CT group (p < 0.001). These observations are consistent with the basic characteristics of the systemic circulation in septic shock rats, suggesting that the experimental rat model of LPS-induced sepsis has been successfully established.
Fig. 2. Improvement of MAP and HR in the LPS-induced septic shock rats by Ani HBr and AT3. A. MAPs in the LPS-induced septic shock rats after Ani HBr, AT3, Race Ani and ATP treatments. B. HRs in the LPS-induced septic shock rats after Ani HBr, AT3, Race Ani and ATP treatments. ∗∗∗p < 0.001 vs. CT; |
The MAP and HR of septic rats were evaluated after drug treatment with Ani HBr, AT3, Race Ani and ATP (Fig. 2). The results showed a significant improvement in the systemic circulatory indices of septic rats after drug administration. In particular, the MAP of septic rats was significantly elevated and returned to normal levels after drug treatment compared with the LPS group, while the HR was significantly reduced, suggesting that Ani HBr and AT3 have considerable potential in ameliorating LPS-induced systemic circulatory injury in rats.
3.2. General characteristics of the microcirculation in sepsis and its treatments
The microcirculation plays a crucial role in regulating blood flow to meet the changing metabolic demands of parenchymal cells and to eliminate the metabolic waste products [15]. Thus, the appropriate blood flow velocity and pattern in the microcirculation are of paramount importance. As depicted in Fig. 3, the mesenteric microcirculatory blood flow velocities were observed to be 395.40 ± 53.19 and 114.60 ± 91.02 μm/s in the CT and LPS groups respectively. It is noteworthy that the blood flow velocities were significantly lower in the LPS-treated group than those in the CT group (p < 0.001), indicating that the microcirculatory blood flow in the LPS-induced septic shock rats exhibited considerable slowing.
Fig. 3. The velocity of mesenteric microcirculatory blood flow in the LPS-induced septic shock rats after Ani HBr, AT3, Race Ani and ATP treatments. ∗∗∗p < 0.001 vs. CT; |
In this study, we evaluated the efficacy of Ani HBr and AT3 in treating mesenteric microcirculatory dysfunction in septic rats. Specifically, we assessed the blood flow velocity of the mesenteric microcirculation in rats after drug administration (Fig. 3). Notably, the blood flow velocities observed in the Ani HBr, AT3, and Race Ani groups were significantly higher than those in the LPS group (318.82 ± 118.83 μm/s, 321.80 ± 116.40 μm/s, and 295.40 ± 158.00 μm/s, respectively; p < 0.001), indicating that Ani HBr and AT3 can effectively ameliorate the microcirculatory dysfunction in the LPS-induced septic shock rats. It is worth noting that the ATP group, which served as a positive control and improved the macrocirculation, but resulted in severe microcirculatory dysfunction. The microcirculatory blood flow was observed to be almost cessation in ATP-administered rats, as seen in the experimental video (Supplemental Video 1).
According to our experimental analysis, the reduction in mesenteric microcirculatory blood flow observed in septic shock rats was primarily attributed to the occurrence of significant abnormal flow with intermittent and reciprocating motions, as well as the significant increase in leukocyte-endothelium interaction (Fig. 4, Fig. 5, Fig. 6). Moreover, the progression of the lesion resulted in localized regions of the septic microcirculation experiencing blood flow cessation.
Fig. 4. The intermittent motion of blood flow in mesenteric microcirculation in the LPS-induced septic shock rats. A. the representative images of intermittent motion in LPS, Ani HBr and Race Ani groups. B. the parameters of intermittent motion. C–F. the average velocity of the blood flow at 1 s before stopping (v0), the average velocity of the blood flow at 1 s after the re-flowing (vt), the average velocity of the blood flow during intermittent motion (exclude the duration of cessation of blood flow) was ($\bar{v}$), and the total duration of intermittent motion (t) of intermittent motion respectively. #p < 0.05, ##p < 0.01, |
Fig. 5. The reciprocating motion of blood flow in mesenteric microcirculation in the LPS-induced septic shock rats. A. the representative images of reciprocating motion in LPS, Ani HBr and Race Ani groups. B. the parameters of reciprocating motion. C-F. the average velocity of the blood flow at 1 s before changing the direction (v0), the average velocity of the blood flow at 1 s after the re-flowing (vt), the average velocity in the back direction (v−) and forward direction (v⁺) and total reciprocal duration (t) of the reciprocating motion respectively #p < 0.05, ##p < 0.01, |
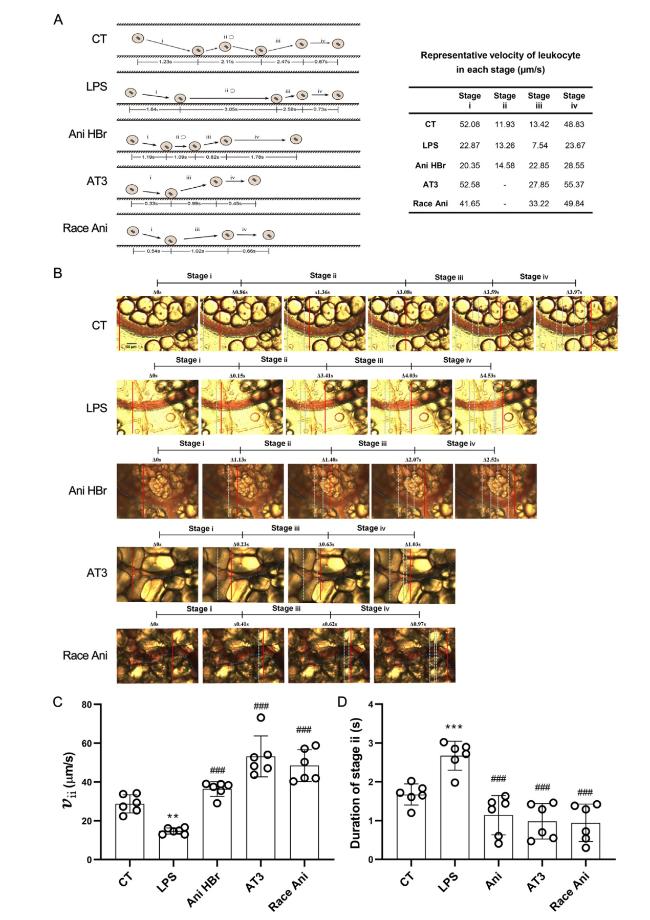
Fig. 6. The improvement of leukocyte dynamics in the mesenteric microcirculation in the LPS-induced septic shock rats. A. an illustration of leukocyte-endothelium interaction (left) with representative velocity (right) in each group. Stage i was leukocytes movement toward vascular wall. Stage ii was adhesion or rolling of leukocytes on vascular wall. Stage iii was detachment and ejection of leukocytes from vascular wall. Stage iv was movement of leukocytes along with the flow again. B. a representative image of leukocyte rolling on vascular wall. The solid lines indicate the immediate location of leukocytes (from Supplemental Video 2). C. the velocity of leukocyte rolling on vascular wall. D. the duration of leukocyte adhesion/rolling on vascular wall. ∗∗p < 0.01, ∗∗∗p < 0.001 vs. CT; ##p < 0.01, |
In light of these findings, we undertook a subsequent study on the abnormal flow patterns and leukocyte dynamics to explore the efficacy of Ani HBr and AT3 in treating microcirculatory dysfunction in septic rats.
3.3. The intermittent motion of microcirculatory blood flow in sepsis and its improvement
The intermittent motion, which is characterized by a flow pattern in which blood flow intermittently halts without altering its original forward direction, was examined in our study. We have defined the key features of intermittent motion (Fig. 4). The intermittent motion was categorized (Fig. 4A and B). The average velocity of the blood flow at 1 s before stopping was measured as v0. The average velocity of the blood flow during intermittent motion (exclude the duration of cessation of blood flow) was $\bar{v}$. The total duration of intermittent motion was t. The average velocity of the blood flow at 1 s after the re-flowing was vt.
The blood flow velocity of mesenteric microcirculatory blood flow in the CT group demonstrated a seamless and swift pattern, devoid of any instances of intermittent motion (Supplemental Video 1).
As shown in Fig. 4E and F, the LPS-induced intermittent motion in the mesenteric microcirculation of septic rats exhibited a v0 of 109.85 ± 38.33 μm/s, vt of 88.26 ± 32.22 μm/s, $\bar{v}$ of 47.06 ± 22.04 μm/s, and a duration of 16.28 ± 6.94 s. The v0 values of intermittent motion in the Ani HBr and Race Ani groups were observed to be 180.68 ± 41.19 μm/s and 244.47 ± 27.88 μm/s, respectively, all significantly higher than those in the LPS group (Ani HBr p < 0.05, and Race Ani p < 0.001). Correspondingly, the vt values in the Ani HBr and Race Ani groups were significantly higher than those in the LPS group (Ani HBr p < 0.05, and Race Ani p < 0.001), recorded as 145.46 ± 36.08 and 223.44 ± 25.72 μm/s, respectively. Notably, $\bar{v}$ was significantly increased in the Ani HBr and Race Ani groups compared to the LPS group (both p < 0.01). Similarly, the duration (t) of intermittent motion was significantly shorter in the Ani HBr and Race Ani groups compared to the LPS group (both p < 0.01). Specially, there were no purely intermittent motion in the AT3 group.
These results suggest that the Ani HBr treatment effectively ameliorates microcirculatory dysfunction in septic rats by significantly elevating v0 and vt values, $\bar{v}$ values, and decreasing the t of intermittent motion.
3.4. Reciprocating motion of microcirculatory blood flow in sepsis
The reciprocating motion refers to a type of motion in which blood is forth and back movement (include the short cessation of blood flow). The representative images of reciprocating motion and characteristic parameters are shown in Fig. 5. As depicted in Fig. 5A and B, the average velocity of the blood flow at 1 s before changing the direction was measured as v0. During reciprocating motion, the average velocity in the back direction was v−, and the average velocity in the forward direction was v⁺. The total duration of reciprocating motion was t. The average velocity of the blood flow at 1 s after the re-flowing was vt.
According to Fig. 5C-G, the v0 of reciprocating motion of microcirculation in septic rats was 61.49 ± 14.05 μm/s, vt was 76.85 ± 20.26 μm/s, v− was 33.11 ± 4.73 μm/s, and v⁺ was 43.29 ± 6.25 μm/s. After treatment with Ani HBr, AT3, and Race Ani, v0 increased to 79.02 ± 14.05 μm/s (p < 0.5), 97.44 ± 11.28 μm/s (p < 0.001), and 96.41 ± 14.96 μm/s (p < 0.001), respectively; vt increased to 95.76 ± 13.38 μm/s (p < 0.05), 94.65 ± 6.69 μm/s (p < 0.05), and 100.71 ± 9.70 μm/s (p < 0.01), respectively; v− increased to 41.22 ± 7.23 μm/s (p < 0.05), 46.86 ± 4.54 μm/s (p < 0.01), and 61.07 ± 6.38 μm/s (p < 0.001), respectively; and v⁺ increased to 53.44 ± 5.40 μm/s (p < 0.05), 58.91 ± 5.43 μm/s (p < 0.01), and 66.45 ± 9.41 μm/s (p < 0.001), respectively.
These changes were all significantly different from the LPS group. In addition, the total duration of reciprocating motion was significantly decreased in the Ani HBr and Race Ani groups (p < 0.01, p < 0.001), while it was significantly increased in the AT3 group (p < 0.01) due to the short cessation of blood flow. The results suggest that Ani HBr and AT3 can improve the mesenteric microcirculatory blood flow in the LPS-induced sepsis rats by increasing the velocity of reciprocating motion, while Ani HBr and Race Ani also decreases the duration of reciprocating motion. These results suggested that these drugs improve microcirculation in the sepsis.
3.5. Leukocyte dynamics
Leukocyte-endothelium adhesion is a characteristic feature of early microcirculatory dysfunction [9]. This process can be divided into several stages (Fig. 6A). These stages include leukocytes movement toward vascular wall (Stage i), adhesion or rolling of leukocytes on vascular wall (Stage ii), detachment and ejection of leukocytes from vascular wall (Stage iii), and movement of leukocytes along with the flow again (Stage iv).
In the study, different characteristics of leukocyte motility were observed in different groups (Fig. 6A and Supplemental Video 2). In the CT group, leukocyte motility involved repeated adhesion to and detachment from ECs at relatively high speeds (52.08 μm/s for stage i and 13.42 μm/s for stage iii of CT). In the LPS group, leukocytes adhered/rolled on ECs for a longer time (3.05 s for stage ii of LPS), with slow near-wall rolling (13.26 μm/s for stage ii of LPS) and ejection speeds (7.54 μm/s for stage iii of LPS). In the Ani HBr group, leukocytes had a short near-wall rolling phase (1.09 s for stage ii of Ani HBr), followed by ejection (stage iii of Ani HBr) and then flowed along with the blood (stage iv of Ani HBr), and the ejection speed was higher than in the LPS group (22.85 μm/s for Ani HBr vs. 7.54 μm/s for LPS). In the Race Ani and AT3 groups, leukocytes adhered to the vascular wall, quickly ejected (stage iii of AT3 and Race Ani) and then flowed with the blood, with higher ejected speeds (27.85 μm/s for AT3 and 33.22 μm/s for Race Ani vs. 7.54 μm/s for LPS) and flow velocity (55.37 μm/s for AT3 and 49.84 μm/s for Race Ani vs. 23.67 μm/s for LPS) than those in the LPS group. The leukocyte dynamics in treatments were similar with the CT group.
The study further compared the motility characteristics of leukocytes (Fig. 6B-D). The results showed that in the LPS group, the near-wall rolling velocity of leukocyte was significantly reduced compared to the CT group (14.27 ± 1.55 vs. 28.75 ± 4.68 μm/s, p < 0.01), and the duration of Stage ii (adhesion or rolling) was significantly longer (p < 0.001) than the CT group. After treatment, the near-wall rolling velocity of leukocyte in Ani HBr, AT3, and Race Ani groups was significantly increased (36.39 ± 3.82 μm/s for Ani HBr, p < 0.001; 53.19 ± 10.51 μm/s for AT3, p < 0.001; 48.45 ± 8.21 μm/s for Race Ani, p < 0.001) and the adhesion/rolling duration was significantly reduced (p < 0.001).
Overall, leukocyte adhesion/rolling on vascular wall was enhanced in septic shock rats, suggesting an enhanced leukocyte-endothelium interaction. Ani HBr and AT3 can inhibit leukocyte adhesion/rolling, which might be associated with the protection against endothelial cell injury.
3.6. Inhibition of serum cytokines in the LPS-induced sepsis rat by Ani HBr and AT3
The inflammatory cytokines TNF-α and IL-6 in plasma were detected in all groups (Fig. 7). Their levels were considerably higher in LPS group compared with the CT group (29.97 ± 0.47 pg/mL vs. 9.80 ± 0.30 pg/mL, TNF-α, p < 0.001; 1650.00 ± 150.00 pg/mL vs. 481.00 ± 6.56 pg/mL, IL-6, p < 0.001; LPS vs. CT).
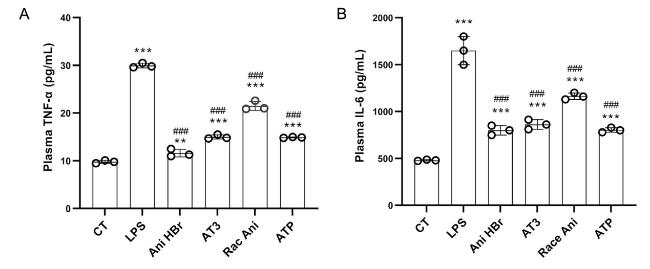
Fig. 7. The effect of Ani HBr, AT3, Race Ani and ATP on the plasma levels of TNF-α and IL-6 in the LPS-induced septic shock rats. A. TNF-α. B. IL-6. ∗∗p < 0.01, ∗∗∗p < 0.001 vs. CT; |
Compared to the LPS group, the plasma TNF-α levels were significantly reduced to 11.60 ± 0.79 pg/mL in the Ani HBr group (p < 0.001), 15.00 ± 0.44 pg/mL in the AT3 group (p < 0.001), 21.50 ± 0.95 pg/mL in the Race Ani group (p < 0.001) and 14.90 ± 0.10 pg/mL in the ATP group (p < 0.001) (Fig. 7A). Similar to the TNF-α, compared to the LPS group, the plasma IL-6 levels were significantly reduced to 800.00 ± 50.00 pg/mL in the Ani HBr group (p < 0.001), 862.70 ± 51.50 pg/mL in the AT3 group (p < 0.001), 1163.33 ± 35.12 pg/mL in the Race Ani group (p < 0.001) and 803.33 ± 25.17 pg/mL in the ATP group (p < 0.001) (Fig. 7B). These results suggest that Ani HBr and AT3 significantly inhibit plasma TNF-α and IL-6 levels in the LPS-induced sepsis rats, which were more effective than Race Ani.
4. Discussion
We demonstrated two abnormal microcirculatory flow patterns in LPS-induced septic shock rats including intermittent motion and reciprocating motion, and also demonstrated the enhanced complex dynamic interaction between leukocyte and endothelium in the mesentery microcirculation.
During early sepsis, macrocirculatory manifestations include decreased MAP, decreased partial pressure of CO2, increased HR and respiratory rate, and enhanced adhesion of peripheral blood leukocytes, while in microcirculation, decreased total vascular density, functional capillary density and capillary refill time, increased serum lactate and serum creatinine, skin mottling and cold extremities are the main clinical manifestations [1]. Using sidestream dark-field (SDF) imaging, among the 501 patients with acute microcirculatory shock in critically ill patients, it was found that 86 patients had microcirculatory flow index scores of less than 2.6, indicating slow microcirculatory blood flow with intermittent movement and cessation of blood flow in septic shock [24]. Fabio et al. studied the impaired cerebral microcirculation in sepsis in sheep, which also shown a remarkable decrease in the microcirculatory flow index values, about a few hours after the induction of sepsis [25]. This decrease might associate with obstruction, interruption, or sluggishness of cerebral microcirculatory blood flow. Using laser Doppler, Birnbaum et al. demonstrate a reduction in mesenteric microcirculatory blood flow in LPS-induced sepsis rats [26]. However, the previous studies are limited by analyzing microcirculation in a qualitative manner.
Here, the precise quantification of the reduction in blood flow velocity in the septic microcirculation were performed and typical flow patterns were revealed. The decreased MAP and obstruction of mesenteric microcirculatory in many regions in LPS rats were found, while a reduction of blood flow velocities to 114.60 ± 91.02 μm/s in other microcirculatory regions, which were only 28.9% of CT levels. Ani HBr and AT3 improved both the macrocirculation and microcirculation. However, the ATP only alleviated the macrocirculation, and severe microcirculatory dysfunction persisted. In current, ATP is an M receptor blocker that inhibits the binding of acetylcholine secreted by the efferent vagus nerve to the postsynaptic membrane of the sinoatrial node [27]. Therefore, it is recommended to use ATP with caution in the setting of myocardial infarct and only in cases of clear hemodynamic need or severe arrhythmias [28,29]. Our evidence suggests that Ani HBr and AT3 have a better effect on improvement of microcirculation than ATP.
We also quantified the parameters in both intermittent and reciprocating motions. Ani HBr and AT3 increased the velocities in initial, terminal and duration of intermittent motion, reduced the intermittent duration, and did not change the frequency of intermittent motion (Data not shown). Ani HBr and AT3 increased the velocities in initial, terminal, and back and forward in reciprocating motion duration. Ani HBr reduced the reciprocating motion duration. However, AT3 increased the reciprocating motion duration, which might be due to the short cessation of blood flow. It has been hypothesized that restoration of blood flow and physiological shear stress can reduce morbidity and mortality in sepsis [30]. The novel flow patterns with parameters providing specific boundary conditions for in vitro numerical simulations and experimental flow devices development for exploring the role of the abnormal flow patterns.
During sepsis, leukocyte-endothelium interaction plays a vital role in the mesenteric microcirculatory dysfunction, followed by multiply organ failure [13,14]. Numerous studies have shown that leukocyte-EC adhesion is enhanced during sepsis, both in terms of increased numbers and prolonged duration [14,31,32]. In addition, the proportion of rolling leukocytes on ECs is increased, accompanied by a slowing of the rolling velocity on the ECs [33]. Intestinal obstruction induced neutrophilia and increased the number of rolling (approximately 2-fold), adherent (approximately 5-fold), and migrated leukocytes (approximately 11-fold), which was accompanied by an increased expression of P-selectin (approximately 2-fold) and ICAM-1 (approximately 2-fold) in the mesenteric microcirculation [13]. In LPS-induced sepsis rats, there were high levels of P-selectin and ICAM-1, with corresponding enhanced leukocyte rolling, adhesion and migration [18]. Those adhesion molecules on EC and leukocyte surface were induced by proinflammatory cytokines such as TNF-α, IL-1β and IL-6 [15], which were massively released after LPS administration for 2 h [34]. The proinflammatory cytokines directly or indirectly activated the coagulation system [35]. Consistent to these results, our study showed increased leukocyte-endothelium interaction and reduced near-wall rolling velocity in the mesenteric microcirculation of septic shock rats. We found that Ani HBr and AT3 leads to a reduction in leukocyte-endothelium interaction and an increase in leukocyte near-wall rolling velocity, which might be helpful for ameliorating microcirculatory dysfunction. The cytokines including TNF-α and IL-6 in LPS-induced septic shock rats were inhibited by both Ani HBr and AT3. However, the levels of adhesion molecules by Ani HBr and AT3 were not detected in the present study, which will be further investigated with the dynamic of leukocytes.
In controls, leukocytes adhered/rolled on the endothelium, but there was a certain distance between leukocytes and vascular wall (Fig. 6). Compared with controls, LPS has an enhanced leukocyte adhesion/rolling closer to the vascular wall, with slower velocity, longer adhesion/rolling duration. After Ani HBr and AT3 treatments, the duration of Stage ii (adhesion/rolling) was shorter than LPS groups, even than controls, and the detachment and ejection velocities of leukocytes were greater than LPS and controls. The shortening of the contact distance between the leukocytes and the endothelium may be due to the shedding of the endothelial glycocalyx. The shedding of endothelial glycocalyx is closely associated with endothelial dysfunction and barrier disruption, which leads to high mortality in LPS-induced septic mice [36]. In addition, downregulation of nitric oxide is closely associated with enhanced leukocyte-endothelium interactions [37]. We previously demonstrated the glypican-1 mediated the shear stress-induced nitric oxide production in ECs [38]. There is still a lack of visual detection methods for exploring the role of shedding of endothelium glycocalyx in alteration of leukocyte-endothelium interaction after LPS administration.
In 1982, it was discovered that Ani HBr may possess antithrombotic activity by inhibiting the thromboxane synthesis and suppressing the granulocyte and platelet aggregation [39]. We previously demonstrated that Ani HBr protects endothelial glycocalyx and intercellular junctions against LPS injury [40]. Ani HBr also protects against LPS-induced inflammation and oxidative stress, thereby attenuating LPS-induced acute kidney injury [22]. Here, we found Ani HBr and AT3 reduced the duration of leukocyte adhesion/rolling, and increased the ejection of leukocytes from vascular wall. This leads us to speculate that some of the unknown glycocalyx components are associated with adhesion molecules (such as P-selectin, ICAM-1, and integrin) that are responsible for inhibition of leukocyte rolling and adhesion, while other unknown components are associated with leukocyte ejection, both components might be restored by Ani HBr and AT3, ameliorating sepsis microcirculatory impairment.
5. Conclusion
The obstruction of blood flow was shown in the mesenteric microcirculation in rats with LPS-induced septic shock. Specifically, two abnormal flow patterns were identified including intermittent and reciprocating motions. Also, the increased leukocyte adhesion or rolling on the vascular wall suggested endothelial injury in the septic shock rats. Administration of Ani HBr, AT3 and Race Ani improved MAP, reduced HR, increased microcirculatory flow velocity, ameliorated the abnormal microcirculatory flow patterns, and enhanced the leukocyte dynamics, suggesting they are protective against both systemic circulatory and microcirculatory dysfunction, and a role in endothelial protection.
Funding
This work was partially supported by the National Natural Science Foundation of China 12272246, and the Key Research and Development Projects of Sichuan Province 2023YFS0075.
Declaration of competing interest
The authors declare that they have no known competing financial interests or personal relationships that could have appeared to influence the work reported in this paper.
Appendix A. Supplementary data
Supplementary data to this article can be found online at https://doi.org/10.1016/j.mbm.2023.100006.
