
1. Introduction
One of the key factors in cancer mortality is drug resistance during chemotherapy. There are various factors that contribute to drug resistance in cancer therapy, such as tumor burden and growth kinetics; tumor heterogeneity; physical obstacles; the immune system and the microenvironment; undruggable cancer drivers; and the numerous negative effects of therapeutic pressures [1,2]. Breast cancer have highly heterogeneous and aggressive. Especially, triple-negative breast cancer (TNBCs), due to they lose therapeutic targets and exhibit considerable resistance to chemotherapy and other treatments, patients with TNBCs typically have a worse prognosis than those with other breast cancer subtypes [3,4,5]. Therefore, it is especially important to understand the causes and underlying mechanisms of drug resistance to breast cancer.
It exhibits a significant degree of ECM remodeling and stiffening during breast cancer progression [6,7]. Chemotherapeutic agent penetration into tumor cells is impeded by the rigid ECM. The current reports show ECM stiffness plays a critical role in tumor cell behaviors, including proliferation, metastasis, abnormal angiogenesis, metabolic redox homeostasis, immune suppression, and genome instability [8,9,10]. These behaviors of tumors regulated by ECM stiffness also affect tumor cell response to therapeutic agents [11]. The ECM of primary untreated TNBCs is rich in quantities of fibrillar type collagens, and was stiffer than that of the normal human breast. Chemotherapy-resistant residual tumors inhabit a softer niche. TNBC organoid cultured on soft ECM showed striking resistance to chemotherapy [12]. Our previous study indicated that soft ECM promoted osteosarcoma cell drug resistance via regulation of miR-29 downregulation [13]. Although more and more attention has been paid to the effect of ECM stiffness on tumor resistance, the research present conflicting findings. The contradictory findings may be attributed to numerous factors including the tumor cell lines, ECM stiffness, etc. Therefore, it is important to understand the response of ECM stiffness on drug resistance, and the underlying mechanisms that ECM stiffness may impact the development of drug resistance still need to be discussed.
EGFR is a transmembrane receptor on the cell surface that transduces extracellular messages into the cells and triggers the alternation of the nucleus activity through tyrosine signaling [14,15,16]. Previous studies have shown that in the presence of Epidermal growth factor (EGF) stimulation, EGFR became tyrosine phosphorylated and activated, further to modulate focal adhesion constituents and redistribution [17]. In the absence of EGF, EGFR activation of rigidity sensing requires myosin contractile activity, leading to increasing adhesion formation [18]. Therefore, EGFR sense ECM stiffness change may orchestrate downstream signaling pathway during cancer progression. It should be noted that several articles have demonstrated that EGFR was found to shuttle from cell membrane to cytoplasm and nucleus by the ligand stimulation acts as a transcription factor to regulate tumor progression [19,20,21]. However, it is not clear whether ECM stiffness can induce EGFR nuclear translocation and whether the mechanism of nuclear translocation will be related to drug resistance.
In the past decade, several literatures have reported that Hippo pathway has been implicated in mediating drug resistance [22,23]. When the Hippo pathway is activated, the upstream molecules Neurofibromatosis 2 (NF2) (also denoted as Merlin) induces the activation of serine/threonine kinases MST1 and MST2 (MST1/2), large tumor suppressor 1/2 (LATS1/2), that subsequently phosphorylate the downstream effector molecules YAP and transcriptional coactivator with PDZ binding motif (TAZ). YAP and TAZ are retained in the cytoplasm and degraded by the proteasome. When the Hippo pathway is inhibited, YAP cannot be phosphorylated by the central kinase complex and translocate into nuclear, activates the target genes [24,25,26,27]. The Hippo pathway is inactivated via the downregulation of MYPT1 (PPP1R12A), thus allowing the target gene of YAP expression, increasing tumor growth and stemness, and leading to resistance to platinum-based therapies [28]. EGFR is capable of activating of YAP/TAZ by promotes MOB kinase activator 1A and 1B (MOB1) phosphorylation and suppresses the Hippo pathway, leading to expression of growth promoting genes [29]. Rong et al. reported that the mutant EGFR transported into the nucleus via binding with YAP, nuclear EGFR and nuclear YAP initiates the transcription of their downstream oncogenes and target genes, respectively, ultimately resulting in the development of Tyrosine Kinase Inhibitor (TKI) resistance [30]. Therefore, whether ECM stiffness is involved in the drug resistance mediated by the interaction of EGFR and YAP need to be investigated.
To mimic the changes in ECM stiffness during the progression of breast cancer. We fabricated Methacrylate Gelatin (GelMA) 3D hydrogels with varying stiffness by photo-crosslinking to simulate the change in tissue stiffness throughout the progression of breast cancer. 5% GelMA (0.4 kPa) was used to simulate healthy breast tissue, 10% GelMA (3 kPa) was used to simulate benign lesion, 15% GelMA (9 kPa) and 20% GelMA (19 kPa) was used to simulate malignant tumor tissue. We hope to use this in vitro model to demonstrate the drug resistance behavior of MDA-MB-231 cells in the development of breast cancer. The related mechanobiological mechanism also be investigated.
2. Materials and methods
2.1. Fabrication and characterization of GelMA hydrogel
GelMA (Engineering For Life, China) with 90% substitution was used in this study. The photoinitiator lithium phenyl (2,4,6-trimethylbenzoyl) phosphinate (LAP) was first prepared at a concentration of 0.25% (w/v). In following, GelMA at different weights were added to the above LAP solution to make the final GelMA concentration is 5%, 10%, 15% and 20%. The mixture was maintained in a 60 °C water bath for 30 min. The hydrogels were last formed by blue light (405 nm) illumination for 60 s at room temperature. The elasticity of GelMA hydrogels were analyzed using Physica MCR-92 rheometer (Anton Paar, Austria). The morphology of GelMA hydrogels were observed by Nova NanoSEM (FEI company, America).
2.2. Cell culture and encapsulation
MDA-MB-231cells were acquired from the American Type Culture Collection (ATCC), and cultured in Leibovitz's L-15 medium (ThermoFisher Scientific) with 10% fetal bovine serum (FBS) (ThermoFisher Scientific), and 1% penicillin and streptomycin.
MDA-MB-231cell suspension (contained 5 × 10⁶ cells) was mixed with 5%, 10%, 15%, 20% GelMA solution, respectively. The mixture was crosslinked by illumination with blue light (405 nm) at a distance of 3 cm from the source to the bottom face of the plate. The hydrogels containing cells were incubated at 37 °C for 5 min. Fresh medium was then added into each gel and changed every 2 d. The morphology of cells in GelMA hydrogels were observed by Nova NanoSEM (FEI company, America).
2.3. Cell proliferation, cytotoxicity and IC50 assay
Cell viability was measured using a Calcein-AM/Propidium iodide (PI) live-dead cell staining kit (Solarbio Life Science). MDA-MB-231 cells were cultured in GelMA hydrogels for three days. Calcein-AM and PI were prepared at work concentration in assay buffer and was incubated with gels at 37 °C for 30 min. Live cells were imaged at 490 (Ex)/515 (Em) nm for Calcein (green fluorescence); dead cells were imaged at 535 (Ex)/617 (Em) nm for PI (red fluorescence). When indicated, cells were exposure to 8 μM DOX for 48 h or Erlotinib (Erl) or NSC 228155 (NSC) according to the instructions for 30 min before staining.
For IC50 assay, MDA-MB-231 cells cultured in GelMA hydrogels were treated with DOX (Meilunbio) at a final DOX concentration of 1.25, 12.5, 25, 35 μg/mL for 48 h. Cell viability was analyzed by CellTiter 96 AQueous Solution Reagent kit (Promega) according to the manufacturer's instructions. IC50 values were calculated by GraphPad Prism 9.0. Each treatment was carried out with 5 replicates.
For cell proliferation assays, MDA-MB-231 cells cultured in GelMA hydrogels were treated with 5 μM DOX for 48 h. Samples were fixed with 4% formaldehyde for 20 min, washed 3 times for 5 min with PBS, blocked and permeabilized with Blocking Buffer (Beyotime, China) and 0.1% Triton X-100 (Beyotime, China) for 30 min. The proliferation cells were measured using Ki67 antibody (Abcam, #ab15580, 1:1000) and then incubated with corresponding secondary antibody. Cell nucleuses were stained with DAPI. Cells images were captured by a confocal laser scanning microscope (CLSM) (ZEISS LSM800, Germany). The fluorescence intensity of proliferation cells was quantified by ImageJ software.
2.4. qPCR assay
Cells were collected from the hydrogels by using GelMA lysis buffer (EFL-GM-LS-001, China) according to the manufacturer's instructions. Total RNA was extracted following the manufacturer's protocol of Cell Total RNA isolation kit (Foregene, China), 500 ng of RNA was reversed transcribed to cDNA using the RT-PCR EasyTM I (One Step) (Foregene, China). qPCR was performed using SYBR Green Master Mix, as recommended by the manufacturer. Cycle settings: 40 cycles at 95 °C for 10 s, 58 °C for 10 s, 72 °C for 20 s. Relative gene expression was analyzed by 2-ΔΔCT method and normalized to GAPDH. Primers used in this study included CCND1 (forward, CACCTGGATGCTGGAGGTCTG, reverse, CATGGAGGGCGGATTGGAAA), BCRP (forward, AAAAGTGGGCGGCTGGATAC, reverse, AGGGATGGGAGGAAACGCTA) P-gp (forward, CCCTGATAAGCTGCGAAACCCA, reverse, AATCAGCTGCGAAACCCATGCC), ANKRD1 (forward, CTGAAATCATTACGGAACCTGT, reverse, TCTATGAAGAGCTGTCCGTT), CYR61 (forward, CCTCGCATCCTATACAACCCTT, reverse, GGCCGCACCTCACAAATCCG), CTGF (forward, CGGGTTACCAATGACAACGCCT, reverse, CTCTTCCAGGTCAGCTTCGCAA).
B-MYB (forward, TCCTGGATTCCTGTAACAGC, reverse, AGTTCAGAAACTGGGAGGG), GAPDH (forward, TTGTTGCCATCAATGACCCCTT, reverse, ACAAGCTTCCCGTTCTCAG).
2.5. Western blotting and immunoprecipitation
Cells were collected from the hydrogels by using GelMA lysis buffer, and lysed in RIPA buffer. Cell lysates were sonicated with 20% power for 15 s on a Digital Sonifier S-250D (Branson Ultrasonic, Danbury, USA) in an ice bath and then centrifuged at 10,000×g for 15 min at 4 °C. After centrifugation, the protein content in the supernatant was measured using the BCA Protein Assay Kit (CWBIO). 20 μg total protein was separated by SDS-polyacrylamide gel electrophoresis (SDS-PAGE) and then electro-transferred to PVDF membranes. Membranes were blocked in 5% non-fat milk with TBS-0.05% Tween 20 (TBST), then incubated with primary antibodies overnight at 4 °C. Primary antibodies were diluted as per the manufacturer's specification. Anti-Bcl-2 # 15071 (Cell signaling Technology, 1:1000), Anti-Bax # 89477 (Cell signaling Technology, 1:1000), Anti-EGFR[EP38Y] # ab52894 (Abcam, 1:1000), Anti-YAP1[EP1674Y] #ab52771 (Abcam, 1:5000), Anti-NF2/Merlin[EPR2573(2)] #ab109244 (Abcam, 1:50000), Anti-LATS1 (C66B5) #3477 (Cell signaling Technology, 1:1000), Anti-Phospho-EGF Receptor (Tyr1068) #3777 (Cell signaling Technology, 1:1000), Anti-NF2/Merlin (phospho S518) #ab131473 (Abcam, 1:500), Anti-MST1/MST2 (phospho T180 + T183)[EPR1467Y] #ab76323 (Abcam, 1:1000), Anti-YAP1 (phospho S127) antibody [EP1675Y] #ab76252 (Abcam, 1:10000), Anti-GAPDH #GB15002 (Servicebio, 1:1000), Anti-Histone H3 # GB11102 (Servicebio, 1:300). Membranes were washed with TBST, and then incubated with appropriate secondary antibodies for 1 h. Protein bands were visualized using enhanced chemiluminescence (ECL) reagents (Solarbio, China). The intensity of band was quantified by ImageJ software.
For immunoprecipitation, the supernatants were mixed with primary antibody for 24 h at 4 °C on a shaker, then incubated with protein G/A agarose beads for 1 h at 4 °C. Beads were collected by centrifugation (2000×g for 2 min) at 4 °C and washed with wash buffer for 3 times, then boiled with SDS-PAGE loading buffer. Beads were centrifuged and the supernatants were collected for western blotting. Image J software was used for densitometry analysis of the bands.
2.6. Statistical analysis
Experimental data are mean ± standard error of means (SEM) of at least three measurements, and statistical comparisons used a Student's t-test, or one-way ANOVA was performed. GraphPad Prism Software version 6.0 (USA) was used for the statistical analysis. Statistically significant differences were determined by P-values less than 0.05.
3. Results
3.1. Encapsulation of MDA-MB-231 cells in GelMA hydrogels
We encapsulated MDA-MB-231 cells in GelMA hydrogels by blue light crosslinking to develop a 3D cell culture model (Fig. S1). The mechanical behavior of GelMA hydrogels was first investigated. As shown in Fig. 1A and B, modulus (G′) was always higher than loss modulus (G″) when the strain increased from 0.1% to 100% for these four samples, suggesting a stronger hydrogel was formed at all concentrations of GelMA. We calculated the Young's moduli (E′) used the strain-stress curves, and the results were as follows: 5% GelMA (0.4 kPa), 10% GelMA (3 kPa), 15% GelMA (9 kPa) and 20% GelMA (19 kPa), which could be used to represent the physiological tissue stiffness during the progression of breast cancer (Fig. S2). The morphology of GelMA hydrogel with or without cells encapsulation was observed by SEM. As shown in Fig. 1C, the SEM images revealed uniform porous structures in all of the samples. The interconnected pores size decreased with an increased concentration of GelMA, which supported cell clustering and proliferation. We further used Calcein-AM/PI to stain live/dead cells after three days of cell culture in hydrogels, as shown in Fig. 1D, there were almost no dead cells in all groups, which demonstrated that GelMA hydrogels had a good biocompatibility and were suitable for cell growth.
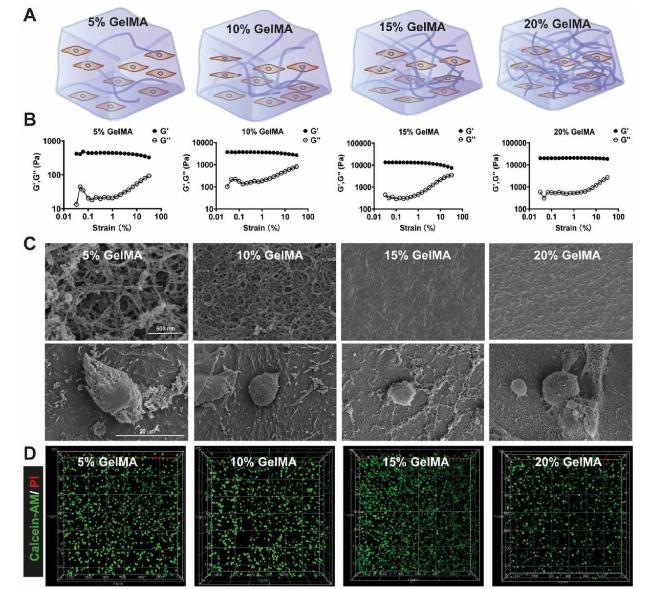
Fig. 1. Characterization of GelMA hydrogel (A) The schematic illustration of GelMA hydrogel with different concentrations (B) Rheological testing of GelMA hydrogels, variation in the storage modulus (G′) and loss modulus (G″) of hydrogels at different strain (C) Representative SEM images of GelMA hydrogels and MDA-MB-231 cells laden in the hydrogels (D) Calcein-AM/PI was used for live/dead staining of MDA-MB-231 cells in hydrogels cultured for 3 days. |
3.2. The drug response ability of cells encapsulated in GelMA hydrogels
After successfully fabricated GelMA 3D cell culture model, we focused our attention on the resistance of MDA-MB-231 cells to chemotherapeutic drug. We tested the cytotoxicity and the expression of apoptosis related genes in DOX treated 3D cell models. Calcein-AM/PI staining results showed that the proportion of dead cells in 15% GelMA group was obviously lower than other groups (Fig. 2A and B). An increased expression of anti-apoptotic protein Bcl-2 was observed in 15% GelMA group, and the ratio of anti-apoptotic protein Bcl-2 to pro-apoptotic protein Bax was the highest compared with other groups (Fig. 2C and D). Further, the expression of a proliferation marker Ki67 was analyzed after DOX treatment, The results showed that the expression of Ki67 in 15% GelMA group were higher than the other groups (Figs. S3A-B). IC50 value was found to be the highest in the 15% GelMA group (25.6 ± 1.4 μg/mL), significantly higher than 5% GelMA group (10.1 ± 1.3 μg/mL), 10% GelMA group (20.2 ± 2.7 μg/mL), and 20% GelMA group (14.6 ± 2.6 μg/mL) (Fig. S3C). Taken together, these results indicated that MDA-MB-231cells encapsulated in 15% GelMA hydrogel have the highest drug resistance than the other groups.
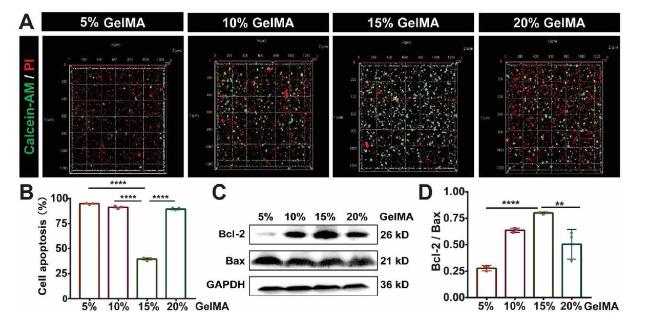
Fig. 2. Cytotoxic efficacy of DOX in MDA-MB-231cells cultured in GelMA hydrogels with different concentrations (A) Fluorescence images represent live/dead cell staining of MDA-MB-231 cells treated with 8 μM DOX for 48 h in GelMA hydrogels with different concentrations, live cells (Calcein-AM, green), dead cells (PI, red cells) (B) The quantitative fluorescence intensity of Calcein-AM/PI staining indicated cell apoptosis, n = 3, ∗∗∗∗P < 0.0001 with one-way ANOVA and post hoc Dunnett test (C) Representative Western blotting showing bands for Bcl-2 and Bax in MDA-MB-231 cells cultured in GelMA hydrogels after 8 μM DOX treatment (D) Bar graph showing the Western blotting quantifications of the ratio of Bcl-2 to Bax by pixel density, n = 3, ∗∗∗∗P < 0.0001, ∗∗∗P < 0.001, ∗∗P < 0.01 with one-way ANOVA and post hoc Dunnett test. |
3.3. ECM stiffness dependent EGFR activity is necessary for drug resistance
EGFR is known to contribute to tumor cell proliferation, angiogenesis, metastasis, and drug resistance [31,32,33]. Evidence has shown that EGFR can sense ECM stiffness change to orchestrate downstream signaling pathway during cancer progression [18]. Therefore, we wondered whether EGFR was involved in 3D ECM stiffness regulated drug resistance to MDA-MB-231 cells. The phosphorylated EGFR (Tyr1068) was first examined, as shown in Fig. 3A, a strong enhancement of EGFR phosphorylation was detected in 15% GelMA group, however, the expression of EGFR was almost no change in all the groups. At the same time, it was found that 15% GelMA group have the highest expression level of nuclear EGFR but the lowest expression level of cytoplasmic EGFR compared to all the other groups (Fig. 3B). As the previous studies have shown that, nuclear EGFR promoted the activation of the downstream target genes, such as (cyclin D1 [CCND1], MYB proto-oncogene like 2 [B-MYB] and Breast cancer resistance protein (BCRP), resulting in the emergence of tyrosine kinase inhibitors (TKIs) resistance in lung adenocarcinoma [30]. Therefore, the transcriptional levels of nuclear oncogenes of cells encapsulation in GelMA hydrogels were determined. The findings demonstrated that the 15% GelMA group, which had more nuclear EGFR, had higher transcription levels of BCRP, B-MYB, and CCND1 than the other groups (Fig. 3C). Thus, it seems that EGFR in 15% GelMA group could be obviously activated, entered the nucleus and promoted the activation of the nuclear oncogenes, leading to tumor drug resistance.
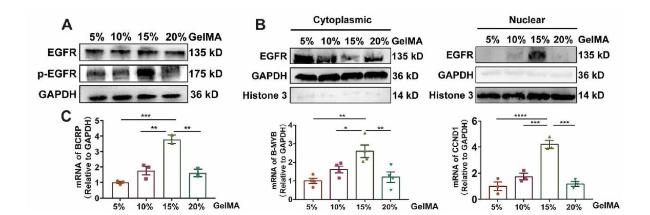
Fig. 3. EGFR is activated in 15% GelMA group (A) Western blot showing bands for EGFR and phosphorylated EGFR (p-EGFR) in MDA-MB-231 cells cultured in GelMA hydrogels (B) Western blot showing bands for EGFR and p-EGFR in cytoplasm or nucleus of MDA-MB-231 cells cultured in GelMA hydrogels (C) q-PCR analysis of the mRNA expression of EGFR targeted gene (BCRP, B-MYB, CCND1), n ≥ 3, ∗∗∗∗P < 0.0001, ∗∗∗P < 0.001, ∗∗P < 0.01, ∗P < 0.05 with one-way ANOVA and post hoc Dunnett test. |
The inhibitor of EGFR Erlotinib (Erl) which can inhibit EGFR phosphorylation [34] and NSC228155 (NSC), an activator of EGFR, which can enhance EGFR tyrosine phosphorylation [35]. They were used in the further studies to investigate the role of EGFR in ECM stiffness regulated drug resistance. It was showed that cells encased in 15% GelMA hydrogel treated with Erl was restored to the drug sensitivity, which had much higher proportion of dead cells than the cells without treated with Erl. When using NSC treated the cells encased in 5% GelMA hydrogel showed lower proportion of dead cells compare with the cells without treated with NSC (Fig. 4A and B). Consistent results were found in IC50 value assay, when inhibited the activity of EGFR by Erl in 15% GelMA group, the IC50 value was decreased to 7.35 ± 0.5 μg/mL. When EGFR was activated by NSC in 5% GelMA group, the IC50 value was increased to 27.4 ± 0.5 μg/mL (Fig. 4C and Fig. S3C). Similarly, we also observed that the expression of Bcl-2 was decreased in 15% GelMA group treated with Erl compared with non-treated group, and the expression of Bax was increased in 5% GelMA group treated with NSC compared with non-treated group. Overall, all the data indicated that EGFR activation is necessary for ECM stiffness dependent drug resistance.
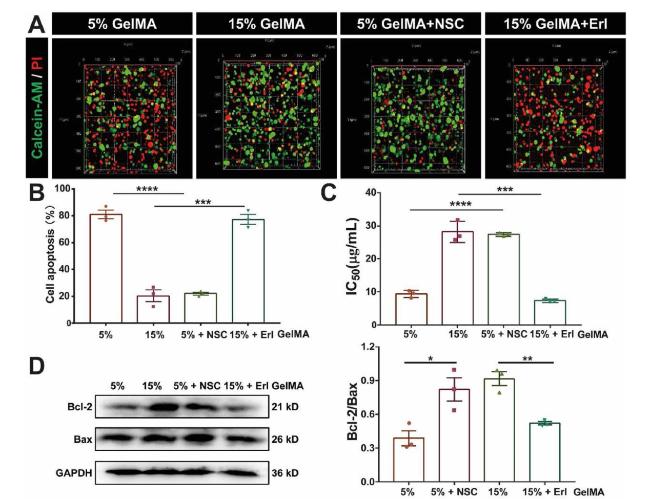
Fig. 4. EGFR promotes ECM stiffness-dependent drug resistance (A) Fluorescence images represent live/dead cell staining of MDA-MB-231 cells cultured in 5% GelMA with or without NSC treatment and 15% GelMA hydrogel with or without Erl treatment, live cells (Calcein-AM, green), dead cells (PI, red cells) (B) The quantitative fluorescence intensity of Calcein-AM/PI staining in (A) indicated cell apoptosis, n = 3, ∗∗∗∗P < 0.0001, ∗∗∗P < 0.001 with unpaired t-test (C) IC50 values for MDA-MB-231 cells cultured in 5% GelMA with or without NSC treatment and 15% GelMA hydrogel with or without Erl treatment, n = 3, ∗∗∗∗P < 0.0001, ∗∗∗P < 0.001 with unpaired t-test (D) Western blot showing bands for Bcl-2 and Bax in MDA-MB-231 cells cultured in 5% GelMA with or without NSC treatment and 15% GelMA hydrogel with or without Erl treatment. Bar graph showing the Western blotting quantifications of the ratio of Bcl-2 to Bax by pixel density in (D) (bottom right corner), ∗∗P < 0.01, ∗P < 0.05 with t-test. |
3.4. ECM stiffness inhibits the Hippo pathway by the activation of EGFR to facilitate YAP enter into nucleus, leading to drug resistance
YAP as a mechano-sensitive molecule, which can interact with a variety of molecules to modulate the downstream signal transduction. As the previous study showed that EGFR entered the nucleus with the assistance of YAP in TKI-resistant cells [30]. Here, we speculated that YAP is associated with EGFR nuclear transport. Therefore, we did a correlation analysis between YAP and EGFR in the samples of human breast cancer patients available online through the Cancer Genome Atlas Program (TCGA) datasets (https://www.cancer.gov/ccg/research/genome-sequencing/tcga). Results of correlation analysis reveal that there is a close relationship between YAP and EGFR (Fig. S4).
To further verify the associations between YAP and the activation of EGFR in this study, we performed both Western blotting and immunoprecipitation analysis. The effect of ECM stiffness on Hippo pathway, the upstream signaling pathway of YAP, was first be analyzed. As shown in Fig. 5A and B, it showed that the phosphorylation of Merlin was increased in 15% GelMA group compared with the other groups. Moreover, MST and LATS1 were dephosphorylated in 15% GelMA group, which prevented YAP phosphorylation. It means that the Hippo signaling pathway was inhibited and YAP was activated in 15% GelMA group. In addition, we isolated the nuclear protein and the cytoplasmic protein to identify the nuclear accumulation of YAP. Fig. 5C showed that nuclear YAP was upregulated and cytoplasmic p-YAP was downregulated in 15% GelMA group. Therefore, these data demonstrated that Hippo pathway be inhibited in 15% GelMA group, which enhanced YAP activation, leading to YAP nuclear translocation.
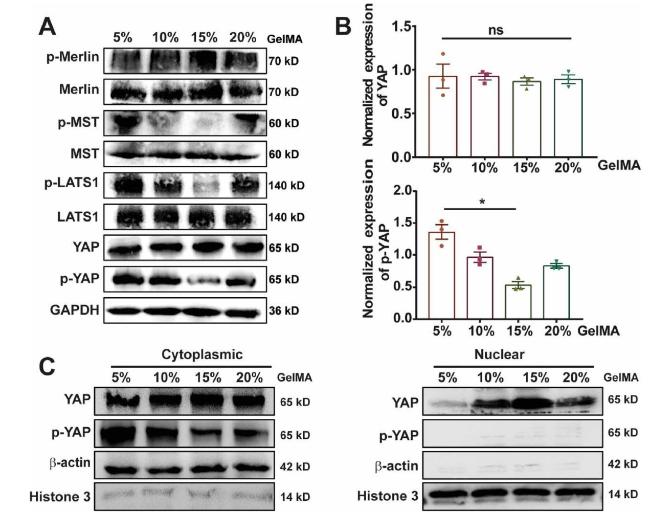
Fig. 5. ECM stiffness regulates the expression and distribution of YAP (A) Western blot showing bands for the protein expression in Hippo signaling pathway (B) Bar graph showing Western blotting quantifications of YAP and p-YAP by pixel density normalized to GAPDH loading control in (A), n = 3, ns, no significant, ∗P < 0.05 with unpaired t-test (C) Western blot showing bands for YAP and phosphorylated YAP (p-YAP) in cytoplasm or nucleus of MDA-MB-231 cells cultured in GelMA hydrogels. |
From the above results, we observed that both EGFR and YAP localized in the nucleus in 15% GelMA group. Therefore, we performed Immunocoprecipitation analysis to identify whether there was an interaction between YAP and EGFR. As shown in Fig. 6A, there was an enhanced interaction between YAP and EGFR in 15% GelMA group. In addition, we collected nuclear and cytoplasmic protein from 5% GelMA group and 15% GelMA group after NSC and Erl treatment respectively. As shown in Fig. S5, inhibition of EGFR by Erl in 15% GelMA group, phosphorated YAP was increased, but activation of EGFR by NSC in 5% GelMA group, phosphorated YAP was decreased. Worth noting is that, inhibition of EGFR significantly decreased the nuclear YAP accumulation in 15% GelMA group. Taken together, all these results indicated that Hippo Pathway was inhibited by the activation of EGFR in 15% GelMA, which facilitated cytoplasmic EGFR and YAP enter nucleus together.
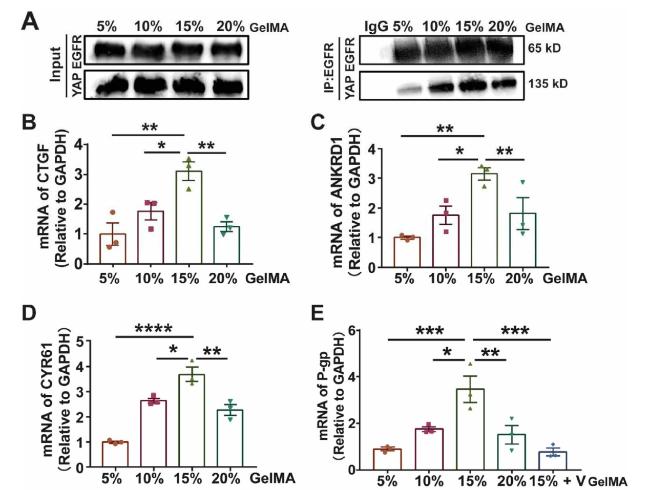
Fig. 6. Interaction of YAP and EGFR facilitates EGFR translocate into the nucleus and active the target genes (A) Immunocoprecipitation analysis showing the binding ability of EGFR and YAP in MDA-MB-231 cells cultured in GelMA hydrogel (B-D) qPCR analysis of the mRNA expression of YAP targeted gene (CTGF, ANKRD1, CYR61) (E) qPCR analysis of the mRNA expression of P-gp, MDA-MB-231 cells cultured in GelMA hydrogels, YAP inhibitor Verteporfin was added when indicated. n = 3, ∗∗∗∗P < 0.0001, ∗∗∗P < 0.001, ∗∗P < 0.01, ∗P < 0.05 one-way ANOVA and post hoc Dunnett test. |
The nuclear accumulation of YAP can activate the target genes, such as CTGF, CCNE and ANKRD1, and ultimately promotes the proliferation, migration, and drug resistance of cancer cells [30]. Therefore, the mRNA expression of YAP target genes was analyzed. As shown in Fig. 6B-D, 15% GelMA group had the greatest levels of expression for CTGF, ANKRD1 and CYR61 compared to the other groups. Meanwhile, we also investigated the effect of ECM stiffness on P-glycoprotein (P-gp), which is able to actively pump chemotherapeutic drugs and induce tumor drug resistance [36]. The data showed that the level of P-gp mRNA or P-gp protein was higher in 15% GelMA group compared with the other groups. Interestingly, the expression of P-gp mRNA was decreased in 15% GelMA group treatment with YAP inhibitor Verteporfin (Ver) (Fig. 6E and Fig. S6). These results showed that the nuclear accumulation of YAP activated the target genes and enhanced drug resistance, inhibition of YAP decreased the level of P-gp mRNA.
4. Discussion
Breast cancer were characterized as a high degree of ECM remodeling and stiffening, limiting the effectiveness of chemotherapy. Therefore, it is crucial to investigate how ECM stiffness affects drug resistance. In recent years, different strategies to study cancer drug resistance in 3D cell culture have been used due to the realistic biochemical and biomechanical microenvironments cannot be appropriately imitated in 2D cell culture [37,38]. Gelatin modified with methacrylamide groups (GelMA) was chose in this study because it includes arginine-glycine-aspartic acid (RGD) which is available for cell adhesion, and proteolytic degradation-generated space that enable cells to multiply and spread in the hydrogel. In addition, GelMA have a mechanically tuned property attribute to the degrees of photo-crosslinking by the methacrylation of amino and carboxyl groups on the gelatin side chain [39,40]. As previously reported in the literature, the nanomechanical signature of healthy breast tissue is characterized by a unimodal stiffness distribution of 1.13 ± 0.78 kPa, benign fibroadenomas shows a stiffness of 3.68 ± 1.92 kPa, breast cancer shows multimodal stiffness distribution, the stiffness values can reach up to ∼20 kPa [41,42]. Correspondingly, we adjusted the hydrogel stiffness by altering the GelMA concentration to match the changes of ECM stiffness during the development of breast cancer. GelMA hydrogel stiffnesses we chose in this study was 0.4 kPa, 3 kPa, 9 kPa and 19 kPa, which covered the ECM stiffness changes in the progression of breast cancer. Initial experiments indicated that GelMA hydrogel had good mechanical properties and biocompatibility which was suitable for 3D cell culture. We used DOX as a model drug to evaluate the effect of ECM stiffness on drug resistance. It was discovered that cells cultivated in 15% GelMA (9 kPa) hydrogel had the lowest percentage of apoptotic cells, the highest percentage of proliferating cells, and the highest IC50 value. That was to say, cells were growth on the malignant progression of cancer stage displayed increased drug resistance.
MDA-MB-231 cells cultured in high stiffness promoted the expression of Mena, an invadopodia protein correlated with metastasis and earlier deaths among breast cancer patients, resulted in EGFR activation [43]. Similarly, in this research, we found EGFR was obviously activated in cells encased in 15% GelMA (9 kPa). One interesting finding was that 15% GelMA group showed significantly nuclear EGFR accumulation. The translocation of EGFR from the plasma membrane to the nucleus is associated with poor clinical outcome in several forms of cancer, such as lung cancer, breast cancer and ovarian cancer. The nuclear EGFR regulates the activation of several oncogenes, such as BCRP, B-MYB, CCND1 that induces tumor therapeutic resistance and progression of tumor [44,45,46]. Consistent with the literatures, this research found that nuclear EGFR accumulation activated the target genes (BCRP, B-MYB, CCND1) expression in 15% GelMA group. According to these data, we inferred that the EGFR nuclear transport promoted the target genes activation, resulting in drug resistance. These inferences were further confirmed by the cell apoptosis assays, cells encased in 15% GelMA hydrogel treated with Erl was restored to the drug sensitivity, however, cells encased in 5% GelMA hydrogel treated with NSC showed enhanced drug resistance. Therefore, the following questions in this study sought to determine the mechanisms that induced EGFR translocation to the nucleus.
A strong relationship between EGFR and YAP has been reported in the literatures [47,48]. The correlation analysis between EGFR and YAP in mRNA level based on TCGA datasets was further confirmed this point in this study. Therefore, we suspected YAP was involved in EGFR nuclear accumulation. The western blotting analysis showed that activation of EGFR inhibited Hippo signaling pathway, as a result, YAP was activated and enhanced the nuclear accumulation. These outcomes were also in agreement with the previous reports, EGFR activation promotes the phosphorylation of MOB1, resulting in LATS1/2 inactivation and YAP/TAZ hypo-phosphorylation. YAP/TAZ transported to nucleus, interacted with TEADs, and promoted cell growth [29]. The qPCR analysis in this study showed that nuclear YAP could activate the target genes (CTGF, ANKRD1, CYR61), and ultimately promoted drug resistance. Another important finding is that EGFR and YAP interacted with each other strongly in 15% GelMA group. According to the previous reports that EGFR transported into the nucleus via binding to YAP to induce TKI resistance [30]. Hence, it could conceivably be hypothesized that cytoplasmic EGFR transported into nuclear by binding with YAP in 15% GelMA group in this study. Our previous studies indicated that stiffness matrix induced DOX efflux via P-gp in MDA-MB-231 cells [49]. It is worth noting that the P-gp mRNA or P-gp protein expression was higher in 15% GelMA group compared with the other groups, and the expression of P-gp mRNA was decreased in 15% GelMA group treated with YAP inhibitor. Therefore, it was further confirmed that 15% GelMA group had strong drug resistance.
5. Conclusion
In summary, the present study was designed to determine the effect of ECM stiffness on breast cancer cells. We cultured MDA-MB-231 cells in mechanically tuned GelMA hydrogels to simulate the changes in ECM stiffness during the development of breast cancer. This study has identified that cells were growth on the malignant progression of cancer stage (15% GelMA, 9 kPa) showed the enhanced drug resistance. The investigation of the related mechanism has shown that EGFR was activated in 15% GelMA group, activated EGFR inhibited Hippo signaling pathway, as a result, YAP was activated and enhanced the nuclear accumulation. Cytoplasmic EGFR transported into nuclear by binding with YAP, nuclear EGFR and nuclear YAP activated their respective downstream target genes induce drug resistance. These results are subject to certain limitations. For instance, this study does not fully explain how EGFR was delivered to the cytoplasm and nucleus; the current research only preliminarily based on in vitro cellular level, most of finding need to be confirmed using small animals and even patient samples. In spite of its limitations, the study certainly adds to our understanding of the effect of ECM stiffness on drug resistance, which will provide a new perspective on the treatment of breast cancer.
Author contributions
T.L.: Supervision, Investigation, Methodology, Writing-review & editing, Funding acquisition. Y.L.: Methodology, Investigation, Data curation. H.W.: Software, Data analysis. C.P.: Methodology, Investigation. J.W.: Data curation. S.C.: Conceptualization, Investigation. T.Z.: Investigation, Methodology. S.L.: Funding acquisition, Supervision. X.Q.: Investigation, Funding acquisition. Y.L.: Supervision, Project administration, Funding acquisition.
Data availability
The datasets generated during and/or analyzed during the current study are available from the corresponding author on reasonable request.
Ethical approval
This study did not involve human or animal subjects, and thus, no ethical approval was required. The study protocol adhered to the guidelines established by the journal.
Declaration of competing interest
The authors declare that they have no known competing financial interests or personal relationships that could have appeared to influence the work reported in this paper.
Acknowledgments
This research was supported, in part or whole, by the National Natural Science Foundation of China (32171309, U19A2006, 12132004, 11972111, 32071304, 12272086), the Sichuan Science and Technology Program (2023YFSY0038, 2022NSFSC0048, 2023NSFSC1233, 2022NSFSC0686), and the Chongqing Natural Science Foundation Project (CSTB2023NSCQ-MSX1060).
Appendix A. Supplementary data
Supplementary data to this article can be found online at https://doi.org/10.1016/j.mbm.2023.100023.
