|
|
|
| Comparative Advantage Analysis of Main Crops in Shanghai |
Ye LI1( ), Guang-rong SHEN1,2 ), Guang-rong SHEN1,2 |
1.SJTU Research Center for Low Carbon Agriculture, Shanghai, 200240
2.Key Laboratory of Urban Agriculture(South), Ministry of Agriculture, Shanghai 200240, China |
|
|
|
|
Abstract To study the comparative advantage of main crops in Shanghai, we first improved the traditional method of measuring comprehensive advantage.Then we used the improved comprehensive advantages indices method to analyze the efficiency advantage indices, the scale advantage indices, the labor advantage indices, the mechanization indices, the market infrastructure advantage and aggregated advantage indices of four crops.Results showed that the order of aggregated advantage was:rice, wheat, soybean, corn.In the end, we gave some suggestions on adjusting the structure of crops’ planting in Shanghai.
|
|
Received: 29 March 2015
Published: 08 March 2016
|
|
|
|

|
|
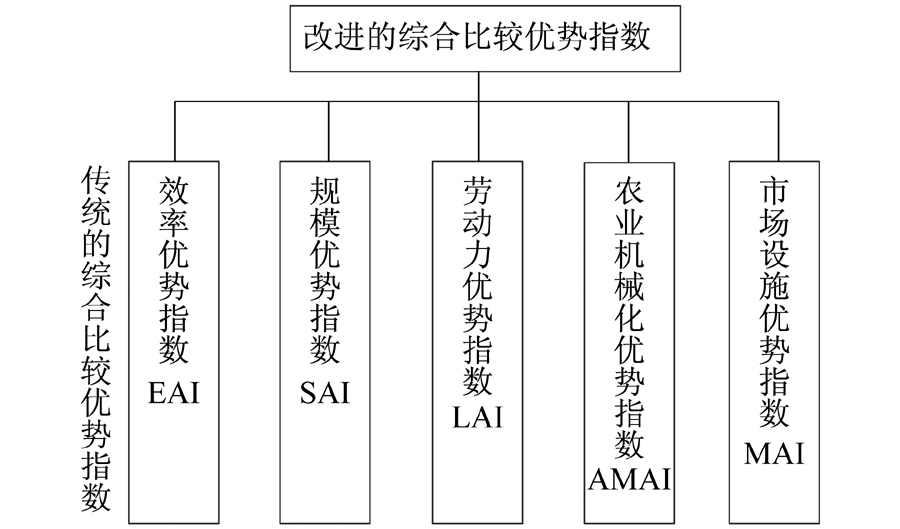
Aggregated advantage index with improvement
|
年份
Year | 粮食作物每公顷
产量/粮食作物播
种面积Grain
crops/Crops
planning areas | 稻谷
Rice | 玉米
Corn | 小麦
Wheat | 大豆
Soybean | | 全国Country | | 2008 | 4748/153463.9 | 6433/28918.8 | 4608/23720.6 | 5167/29477.5 | 1454/8753.8 | | 2009 | 4951/156265.7 | 6563/29241.1 | 4762/23617.2 | 5556/29863.7 | 1703/9127.1 | | 2010 | 4871/158639.3 | 6585/29626.9 | 4739/24290.8 | 5258/31182.6 | 1630/9189.8 | | 2011 | 4974/160674.8 | 6553/29873.4 | 4748/24256.5 | 5454/32500.1 | 1771/8515.8 | | 2012 | 5166/162283.2 | 6687/30057 | 4837/24270.4 | 5748/33541.7 | 1836/7888.5 | | 2013 | 5302/163415.7 | 6777/30137.1 | 4987/24268.3 | 5870/35029.8 | 1820/7171.7 | | 上海Shanghai | | 2008 | 6439/390.7 | 7883/109.1 | 3900/37.5 | 6410/3.9 | 2244/6.2 | | 2009 | 6628/388.4 | 8223/108.6 | 4120/44.2 | 5882/3.6 | 2080/5 | | 2010 | 6296/396.1 | 8297/108.5 | 3838/57.6 | 5755/4.2 | 2182/4.4 | | 2011 | 6608/401.2 | 8328/108.5 | 3897/49.4 | 6659/4.4 | 2600/4.2 | | 2012 | 6544/400.6 | 8379/106.1 | 4031/59.8 | 6603/4.2 | 2674/3.4 | | 2013 | 6524/387.9 | 8481/105.1 | 3984/56.6 | 6597/3.8 | 2753/2.9 |
|
|
Unityield(kilogram)and plant area(kilo-hectares)of main crops in Shanghai and the country 2008-2013kg/khm2
|
| 数据内容Data | 全国
Country | 上海市
Shanghai | 劳动力资源数据
Data of labor force | 农村男性劳动力占比
Percentage of village male labor force | 50.8 | 53.1 | 农村50岁以下劳动力占比
Percentage of village labor force under age of 50 | 75.0 | 83.2 | 农村劳动力初中及以上文化程度占比
Percentage of village with education above middle-school | 60.5 | 76.5 | 农业机械化数据
Data of mechanization | 机耕面积占耕地面积的比重
Percentage ofmechanical cultivation | 59.9 | 74.8 | 机电灌溉面积占耕地面积的比重
Percentage of electro-mechanical irrigation | 26.6 | 70.9 | 机收面积占耕地面积的比重
Percentage of mechanical harvesting | 24.9 | 40.4 | 市场设施数据
Data of market infrastructure | 有综合市场的乡镇比例
Percentage of town with comprehensive market | 68.4 | 92.6 | 有储蓄所的乡镇比例
Percentage of town with saving agency | 88.4 | 99.1 | 有二级以上公路通过的乡镇比例
Percentage of town with provincial level highway | 46.1 | 92.6 | 通电的村比例
Percentage of village with electricity | 98.7 | 100 | 通电话的村比例
Percentage of village with cell phone | 97.6 | 100 |
|
|
Data of labor force, mechanization and market architecture in Shanghai and the country%
|
比较优势指数
Advantage indices | 稻谷
Rice | 小麦
Wheat | 玉米
Corn | 大豆
Soybean | 效率比较优势指数均值
Mean of EAI | 0.96 | 0.64 | 0.88 | 1.10 | 规模比较优势指数均值
Mean of SAI | 1.47 | 0.85 | 0.05 | 0.21 | 传统综合比较优势指数均值
Mean of AAI without
improvement | 1.18 | 0.74 | 0.21 | 0.47 |
|
|
Aggregated advantage Indices without improvement of four main crops in Shanghai
|
比较优势指数
Advantage indices | 稻谷
Rice | 小麦
Wheat | 玉米
Corn | 大豆
Soybean | 效率比较优势指数均值
Mean of EAI | 0.96 | 0.64 | 0.88 | 1.10 | 规模比较优势指数均值
Mean of SAI | 1.47 | 0.85 | 0.05 | 0.21 | 劳动力优势指数(LAI)
Labor force
advantage indices | 1.14 | 农业机械化优势指数(AMAI)
Agriculture mechanization
advantage indices | 1.75 | 市场设施优势指数(MAI)
Marketinfrastructure
advantage indices | 1.26 | 改进综合比较优势指数均值
Mean of AAI with improvement | 1.29 | 1.06 | 0.65 | 0.89 |
|
|
Aggregated Advantage Indices with improvement of four main crops in Shanghai
|
| [1] |
中国农业年鉴编辑委员会.中国农业年鉴[M].北京:中国农业出版社, 2008-2013.
|
| [2] |
上海市统计局.上海市统计年鉴[M].北京:中国统计出版社, 2000-2013.
|
| [3] |
国家统计局.第二次农业普查主要数据公报[EB/OL].http:∥www.china.cn/news/txt/2008-02/22
|
| [4] |
上海市统计局.上海市第二次农业普查主要数据公报[R].2008.
|
| [5] |
李凤. 河南省主要粮食作物生产比较优势分析[J].浙江农业科学, 2012(5):625-627.

|
| [6] |
孙雅健. 云南省主要农作物比较优势分析[J].商品与质量, 2011(2):17-18.
|
| [7] |
袁梁. 陕西省主要农作物国内比较优势分析[J].浙江农业科学, 2011(1):13-15.
|
| [8] |
Pearson S R, Mayer P K.Comparative advantage among african coffee producer[J].American Journal of Agricultural Economics, 1974, 56(2):310-313.
|
| No related articles found! |
|
|
|
|
 2016, Vol. 34