
1 Introduction
The Earth Critical Zone (ECZ) is a complex integrated system encompassing various components of the Earth’s surface, such as bedrock, groundwater, pedosphere, atmosphere and biosphere [1]. It is also a natural reactor which characterized by intricate exchanges of matter and energy among these components [2]. Horizontally, the ECZ extends across different ecosystems, while vertically, it spans from the upper boundary, including the plant canopy, to the underlying soil layer, aquifer, and lithosphere [1,3]. This region plays a crucial role in regulating the vital dynamics of the Earth’s surface, maintaining the natural ecological environment, and providing valuable societal resources [4]. Given that the advancements in technology on a global scale, the study of the ECZ has been emerged as an important and cutting-edge research direction within the field of Earth sciences in the twenty-first century [2,5].
As the most active and dynamic region of the Earth’s surface system, the ECZ significantly influences the biogeochemical cycling of elements, the movement and migration of water and carbon (C) processes [1]. Most of researches on the ECZ primarily focused on unraveling the physical, chemical, and biological processes that control material cycling within this zone, as well as analyzing the interconnections among these processes [6,7]. Within the dynamic core of this region, soil organic matter (SOM) serves as a key component, enabling the proper functioning of the critical zone. It acts as an essential energy and nutrient source for heterotrophic microorganisms and functions as a significant complexing agent or adsorbent for environmental pollutants [8,9]. The decomposition and transformation of SOM play a pivotal role in various physical, chemical, and biological processes within this zone.
Loess, which covers approximately 10% of the Earth’s land area, is widely distributed worldwide (Fig. 1A). Now, research on loess has transitioned from qualitative descriptions to quantitative and interdisciplinary investigations. In China, the loess region represents around 5% of the global loess area (Fig. 1B). In the typical of this region (Loess Plateau), the vegetation coverage increased from 21 to 71% in recent 40 yrs due to the grain for green project. The mean annual temperature gradually increased from 1950s. The mean annual precipitation first decreased before 2000, and then increased after 2000 (Fig. 2). Chinese research on the structure and evolution of loess has surpassed that of European and American countries, reaching an advanced international level [10,11,12,13]. According to the new global development paradigm and China’s major national strategic goals of “high-quality development of the Yellow River” and “dual-carbon targets” the soil C sink within the Loess Critical Zone (LCZ) presents significant opportunities alongside formidable challenges. Therefore, examining the dynamic changes, trends, and controlling processes of soil organic C (SOC) within LCZ is crucial for understanding the patterns of material transport and energy transfer, thereby contributing to the sustainable development of human society.
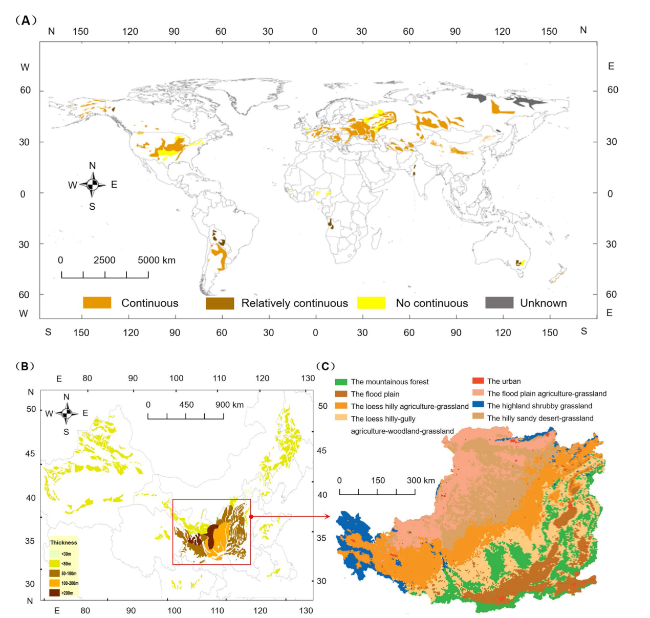
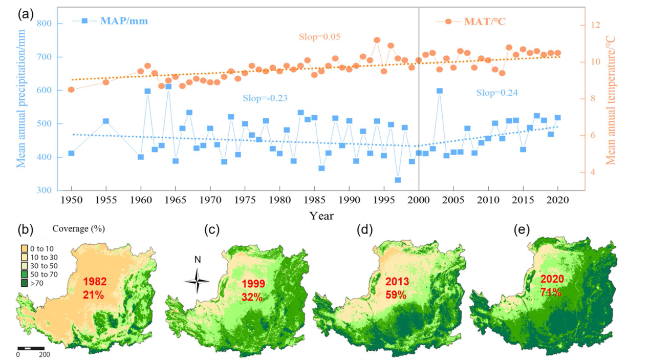
Fig. 2 Observed mean annual temperature (MAT) and precipitation (MAP) variations between 1950 and 2020 in the Loess Critical Zone (a). The slight orange dashed line (MAT) is fitted to the data with the slop = 0.05 (p < 0.001). The slight blue dashed line (MAP) is fitted to the data with the slop = -0.23 (before 2000) and slop = 0.24 (after 2000). Vegetation coverage from 1982 to 2020 in the Loess Critical Zone (b-e) |
2 The development of the Loess Critical Zone
Since the establishment of the first three Earth’s Critical Zone (ECZ) observation stations in the United States in 2007, approximately 64 international Critical Zone observation stations have been gradually established worldwide by 2015, forming an observational network that monitors changes in environmental gradients [14]. However, studies on the ECZ in China began relatively late. In 2008, an article titled “Hydropedology: an emerging interdiscipline” was published in “Science & Technology Review” which introduced the concept of the Earth’s critical zone in a simplistic manner [6,7]. In 2010, the “International Academic Conference on Hydropedology and Forefront Research and Applications in the Earth’s Critical Zone” took place at Beijing Normal University, promoting the development of research on the ECZ in China. In the same year, Lin [1] reviewed the concept of the Earth’s Critical Zone and published an article entitled “Earth’s Critical Zone and hydropedology: concepts, characteristics, and advances.” During the “International Workshop on Hydropedology and Sustainable Use of Natural Resources” in 2013, ECZ was considered as a significant topic. Chinese academician Congqiang Liu presented on “Processes in the Earth’s Critical Zone and biogeochemical cycles” at the forum with the theme “Frontiers in Earth Biology,” which garnered substantial attention for the public. In 2014, the “Shuangqing Forum”, organized by the National Natural Science Foundation of China, highlighted the urgent need for research on the ECZ in China and discussed its future development project. Then, it was announced that five ECZ observation stations would be officially established, including the red soil region of southern China, suburban areas in Ningbo city, the Karst region of Southwest China, and the Loess Plateau, among others. Subsequently, the other ECZ observation stations were established, such as Qinghai Lake, Jianghan Plain, North China Plain, the Circum-Bohai Sea coast, and the Yanshan mountainous area [5]. In 2015, the National Natural Science Foundation of China and the UK’s Natural Environment Research Council initiated a major international research project in the field of the ECZ. This project aimed to understand the sustainability of land and water resources, the dynamic processes and timescales of evolution, and the ecosystem service functions within the Karst region, Loess Plateau, red soil region of Southern China, and rapidly changing suburban areas. Based on the Chinese ecosystem research network, this project officially commenced scientific research on the typical Critical Zone.
In this case, Chinese academician Ming’an Shao proposed the word of “Loess Critical Zone” (LCZ). In fact, LCZ has only been in use for the past years. However, researches and investigations related to this concept can be traced back to studies on biogeochemistry and the C-water cycle conducted several decades ago [15,16,17,18]. In recent years, there have been extremely global climate changes and intense human activities, leading to considerable alterations in the SOC transformation and other processes of the LCZ [16,19,20]. Previous studies on the ecosystem C stocks of the LCZ primarily focused on C output, lacking the underlying C driven processes [19,20]. Consequently, it is of great significance to explore the sources, transport pathways, and transformation characteristics of SOC in the LCZ.
3 Distribution of the Loess Critical Zone
Geographically, loess distributed sporadically in the arid and semi-arid mid-latitude regions of both the northern and southern hemispheres [11]. The largest area covered by loess in the world is found in Asia, followed by Europe, North America, and South America (Fig. 1A). In Europe, the loess coverage ratio is about 16.6%, while Asia accounts for 10.6%, North America for 6%, and South America for 2.6%. Loess sediments can be found at altitudes ranging up to 5,300 m above sea level in areas north of the Kunlun Mountains in China, as well as in locations such as Argentina and New Zealand [21,22]. With the exception of moist frozen loess in northeastern Siberia and northern Alaska, loess is generally found above the water table [23]. The thickest and most continuous loess sediments are located in China, with an average thickness of 300 m and a maximum thickness reaching 505 m, and the calculated mean loess thickness is 105.7 m [22]. In Siberia and Central Asia, the thickness of loess generally ranges from 0 to 200 m [11], while in Europe and North America, it is usually less than 20 m. However, in certain regions such as downstream of the Danube, the Palouse area, Nebraska, and Alaska, the thickness can reach several dozen meters or even approximately 100 m. In South America, loess has an average thickness of 50 m, while in New Zealand, Africa, and the Arabian Peninsula, it is generally around 20 m, and in Australia, it is approximately 3 m.
The LCZ exhibits a wide distribution in China and encompasses the interaction of five spheres: rock, water, soil, atmosphere, and biota [13]. The horizontal boundaries primarily correspond to the loess region. Through in-depth studies and improved understanding of the LCZ, significant progress has been made in its classification, making it an important tool for managing natural resources within the Earth’s surface system [16,24,25,26]. Among the major regions of the LCZ, the Loess Plateau represents a typical and distinctive critical zone, and stands out as an area with the most fully developed loess deposits globally, preserving comprehensive records of the age and climatic information of the LCZ [22,27]. A recent study has established an index system and methodological framework for the regional classification of the LCZ, and the entire Loess Plateau has been classified into eight Critical Zone (Fig. 1C) [13]. Within the national strategies such as the “high-quality development of the Yellow River” and “dual-carbon targets”, the soil C stock of the CLZ will encounter significant opportunities and challenges [24,25]. Soil organic C plays a vital role in maintaining the proper functioning of the LCZ, and all interfaces within the zone are active sites for the substantial decomposition and transformation of SOC (Fig. 3). Currently, a preliminary network of observation stations has been established in the Loess Plateau, leading to research advancements in the structure, processes, evolution, and simulation of the LCZ [5,23,24,25,28]. However, due to vegetation greening project and extremely climate change, the structure and soil C cycling processes within the LCZ are undergoing significant changes compared to other areas. Therefore, gaining a correct understanding of the structure of the LCZ and the SOC cycling is crucial for achieving ecological goals and sustainable development in the Loess Plateau.
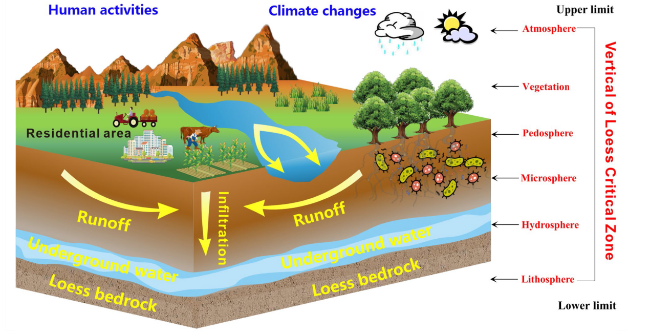
Fig. 3 The structural model of the Loess Critical Zone |
4 The stock and dynamic of SOC in the Loess Critical Zone
Soil organic C (SOC) in the LCZ experiences significant decomposition, transformation, and migration across various media (atmosphere, vegetation, soil, and rocks) [26,29,30] (Fig. 3). In the atmosphere, it exists in the form of inorganic C, while in terrestrial ecosystems, SOC stock is the most abundant. The estimated values for SOC stocks in the atmosphere, terrestrial vegetation, and oceans proposed by different researchers are approximately consistent [31,32,33]. However, there are considerable discrepancies in the estimated values of SOC [15,17]. These differences primarily arise from variations in data, research methods, sampling techniques, and the considerable spatial variability of soil [15,26]. In the LCZ, the SOC stock is immense and the C cycling processes are complex. Furthermore, the combined impacts of climate changes and human activities subject the SOC stock to dynamic changes. Additionally, due to the vast area of the Loess Plateau, data collection becomes challenging, and differences in sampling technologies and processes further contribute to the uncertainty in estimating SOC stocks [29,30]. These uncertainties significantly affect SOC stock estimation in evaluating the total C budget in China.
Loess Plateau are the significant C sink in the Earth. To provide a complete picture of the C sequestration in the Loess Plateau, we documented C pools and the changes for all C sectors (aboveground biomass, ecosystem C, and SOC) in the Loess Plateau (Table 1), by synthesizing the studies in the special feature and other recent studies [26,29,30]. Former estimates for C stocks of the Loess Plateau changed substantially because of diversity in data sources and inconsistency in methodologies [31,32,33]. These studies have shown that the SOC density in the topsoil ranges from 0.66 to 12.18 kg·m-2 within the 0-20 cm depth, with most values falling between 1 and 4 kg·m-2 [34]. Li et al. [7] pointed out that the total C stock of the Loess Plateau is approximately 2.29 Pg, and the C stocks of farmland, grassland, shrubland and forest are nearly 0.98, 1.09 and 0.21 Pg. In our previous study, the total C stock in these four ecosystems (forest, shrubland, grassland, and cropland) was 2.84 Pg C, among which 29.63% was stored in soil (0-20 cm), 53.23% in aboveground biomass, and 17.14% in belowground biomass [26]. The 0-10 and 10-20 cm soil layers on the Loess Plateau, covering almost 6.5% territory in China, held around 5% total SOC stocks at the mentioned layers across the country [34,35,36,37]. Furthermore, the C stock in grassland and farmland soils were higher than belowground biomass, which is similar to the estimates for the continental China (3.9 g/m2) [38], United States (3.0 g/m2) [39] and Europe (3.5 g/m2) [40]. However, higher SOC stock does not necessarily lead to greater ecosystem C stock. Fox example, the C stocks in the soil of forestland and shrubland were lower than the biomass due to the “Grain-for-Green” project in China, which had built numerous forestland and shrubland regions [7,26].
Table 1 Statistics of soil C density and stock in the Loess Plateau and China derived from various studies |
| Item | Soil depth (cm) | SOC density (kg m−2) | SOC stock (Pg) | Aboveground C stock (Pg) | Ecosystem C stock (Pg) | References |
|---|---|---|---|---|---|---|
| Loess Plateau | 0-20 | 0.76 | 0.85 | 1.51 | 2.84 | Yang et al., 2023 [26] |
| Loess Plateau | 0-20 | 0.67 | 1.52 | 0.44 | 2.29 | Li et al., 2021 [37] |
| Loess Plateau | - | - | - | - | 3.96 | Liu et al., 2018 [41] |
| Loess Plateau | 0-20 | 2.64 | 1.64 | - | - | Fu et al., 2014 [36] |
| Loess Plateau | 20-40 | 4.57 | 2.86 | - | - | Fu et al., 2014 [36] |
| Loess Plateau | 0-100 | 7.70 | 4.78 | - | - | Fu et al., 2014 [36] |
| Loess Plateau | 0-200 | 12.45 | 5.85 | - | - | Fu et al., 2014 [36] |
| Loess Plateau | 0-20 | 2.69 | 1.68 | - | - | Liu et al., 2011 [35] |
| Loess Plateau | 0-50 | 8.99 | 3.47 | - | - | Liu et al., 2011 [35] |
| Loess Plateau | 0-100 | 13.45 | 5.32 | - | - | Liu et al., 2011 [35] |
| Loess Plateau | 0-20 | 2.49 | 1.07 | - | - | Xu et al., 2003 [34] |
| China | 0-100 | 0.96 | 75.0 | 14.3 | 89.3 | Tang et al., 2018 [38] |
| China | 0-100 | 10.6-21.0 | 84.5 | 14.6 | 99.2 | Xu et al., 2003 [42] |
| China | 0-100 | 86.2 | 82.8 | 13.7 | 100.5 | Ji et al., 2008 [43] |
| China | 0-100 | 91.3 | 84.6 | 13.3 | 98 | Li et al., 2004 [44] |
| China | 0-10 | - | 69.4 | - | - | Xie et al., 2004 [45] |
| China | 0-100 | 125 | 119.8 | 35.2 | 155 | Ni, 2013 [46] |
| China | 0-100 | 4.86 | 50 | - | - | Pan et al., 2008 [47] |
| China | 0-100 | 10.83 | 100.2 | - | - | Wang et al., 2003 [48] |
| China | 0-100 | 102.9 | 100.6 | 52.5 | 153.1 | Peng and Apps, 1997 [49] |
| China | 0-100 | 20.3 | 185.7 | 6.1 | 191.7 | Fang et al., 1996 [50] |
In addition, the area-weighted mean biomass C densities in forestland (72.1 Mg ha−1), and grassland (1.02 Mg ha−1) across the Loess Plateau (Fig. 4) were substantially lower than the global means [94.2 Mg ha−1 in forestland and 7.2 Mg ha−1 in grassland] [38,51]. Large-area young forests, extensive grazing and soil water limitation are the possible contributors of low biomass C density of the Loess Plateau [24,25]. Specifically, almost 90% forests are aged below 60 years, and corresponding biomass is below 60 Mg ha−1, obviously lower compared with that (104.7 ± 30.3 Mg ha−1) in old forests (≥ 100 years) and the average value across China’s forests [52]. The higher proportion of young and middle-aged forests of the Loess Plateau suggests enormous future potential of C sinks [25]. Future biomass C density may surmount our estimates after forest areal expansion, vegetation restoration and protection and soil C increasing needs to be examined [53]. Vegetation restoration measures, ecological improvement projects, as well as natural conservation policies also may enable C gains to continually increase in this region [54].
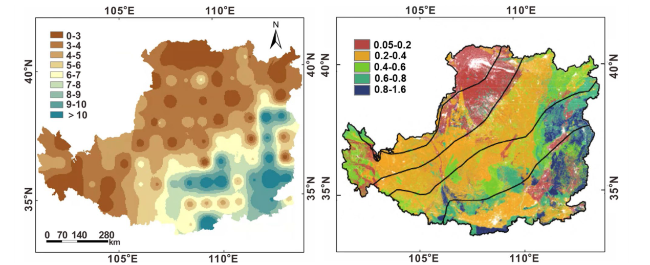
In terms of vertical distribution (Fig. 4), the soil layer in the LCZ is thick, and there are notable variations in the distribution of SOC stock, with significant differences in SOC content across different soil layers [36,55]. Previous studies on SOC stock and influencing factors in the LCZ have primarily focused on the shallow layer within 0-1 m, while the C stock in deep soil layer is enormous [11,56] (Table 1). Generally, the content of SOC decreases with soil depth, with the SOC content in the shallow layer (0-10 cm) being 4-10 times higher than that in the deep layer (80-100 cm) [57]. The SOC stock in 0-20 cm, 0-50 cm, and 0-100 cm are estimated to be 1.68 Pg, 3.47 Pg, and 5.32 Pg, respectively. The SOC stock in the 0-20 cm and 0-50 cm layers accounts for 32.0% and 65.0% of the 0-100 cm layer, respectively. This is primarily due to the generation, transformation, and decomposition of aboveground vegetation biomass, as well as the predominance of roots in the surface layer [55]. Consequently, the contribution rate of SOC stock in the 0-50 cm soil layer is as high as two-thirds. The SOC stock is relatively low in boggy soil, gray desert soil, and solonetz, while loessal soil and gray cinnamonic soil, which have a relatively large area, are the main regions with SOC distribution [26]. Other study suggests that the SOC stock in the shallow layer (0-20 cm) of the Loess Plateau is 1.64 Pg, which increases to 2.86 Pg in the 0-40 cm soil layer. In the deep soil layer (0-100 cm), the SOC stock is estimated to be 4.78 Pg, and it reaches 5.85 Pg in the 0-200 cm soil layer. The SOC stock in the 0-100 cm and 0-200 cm layers accounts for 8.21% and 5.32% of the total SOC stock in China, respectively [58].
5 The microbial turnover of SOC in the Loess Critical Zone
Soil microorganisms act as the engine of biogeochemical processes in the LCZ, serving as important links between the input and output of soil C [59,60]. They mediated crucial metabolic processes of C cycling, driving the exchange and transfer of active matter among various interfaces in the critical zone, such as the conversion of CO2 to organic compounds, the production and oxidation of CH4, and the decomposition of organic matter [61]. In alkaline loess soils characterized by high heterogeneity and calcium richness, the coupling mechanism among C in plant residue, C in microbial residue, and microorganisms requires further investigation.
Soil microorganisms determine the transport of SOC to the underground, the absorption and transport of nutrients by plants, and the micro-channels for nutrient transfer in underground ecosystems [9,62,63,64,65]. Here, Fig. 5 illustrated the migration and cycling process of SOC in the LCZ under natural conditions. Through photosynthesis, atmospheric CO2 was fixed by plants, synthesizing organic C for themselves, and a portion of this organic C is transferred to the litter pool [66]. Microorganisms decompose a portion of the litter, while the undecomposed residues, animal excrement, microbial residues, decomposition products, and synthesis products collectively become the main source of SOC [67]. In addition, dissolved organic C, particulate organic C formed through percolation in the soil profile, and C input from plant roots contribute to the formation of deep SOC. During the transfer of SOC between these pools, degradation processes such as respiration and mineralization can occur. Some degradation products are released back into the atmosphere as CO2 or CH4, forming the component of soil C cycling [21].
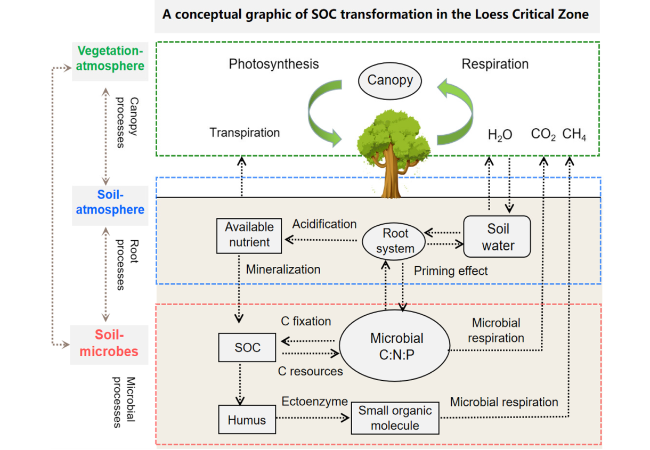
Fig. 5 A conceptual graphic of SOC transformation in the Loess Critical Zone |
The LCZ has a large number of soil microorganisms because of the deep layer [68,69], and these microorganisms play a crucial role in various physical, chemical, and biological processes and contribute to the formation of SOC. When new C is exposed to rainfall, it undergoes eluviation and is subsequently transported by the ‘soil microbial C pump’ [70]. The residues of living microorganisms continuously accumulate, forming a residual C pool. For example, fungi can extend their hyphae to the surface, transferring absorbed C to the deep soil and contributing to the accumulation of SOC [68,69]. The microbial residues left behind by deceased microorganisms also contribute to the stable SOC stock [71,72,73]. As the loess accumulates and C is eluviated, the activity and function of most microorganisms in the deep soil significantly decrease [74]. Through the cycling of energy and substances by the “soil microbial C pump,” generations of microorganisms store SOC in their biomass, which is later transferred to their residues and contributes to the accumulation of substantial SOC [26,59,75]. For example, Ren et al. [67] utilized metagenomic sequencing technology to study the trends of carbon-hydrolyzing enzymes produced by soil microorganisms and their response to the decomposition of microbial residues from different sources in the Robinia pseudoacacia restoration sequence in the Loess Plateau over the past 45 years. In the latest study, it was found that the recovery of natural grassland in the Loess Plateau is attributed to microbial residues (mainly from bacteria) that increase SOC storage, influenced by environmental factors and plant C inputs [76].
6 Mechanisms of SOC stabilization in the Loess Critical Zone
6.1 Physical and chemical protection of aggregates
At present, it is generally accepted that the debris of plants and microorganisms forms the core of micro-aggregates, the new organic substances with high C form stable macro-aggregates [77,78,79], while the old organic C are trapped in fine aggregates, the protected and unprotected organic C in the aggregates have different regeneration rates [80]. By this way, the agglomerate protection volume or capacity is the physical basis for the natural potential of soil C sequestration. The soil aggregates are formed by binding the organic-inorganic composites or free-particle organic C through aggregate structure [77]. When the aggregates are formed, the internal pores of the aggregates are reduced, and the mineral particles are cemented tightly with the organic C, thus forming SOC [60] (Fig. 6). For example, the reduction of porosity of large aggregates directly impedes the entry of air and moisture, thereby reducing the decomposition of organic C in large aggregates [78]. The pores in the micro-aggregates are extremely small, and if the micro-aggregates are smaller than the limits that the bacteria can pass, the organic C can only be degraded by the extracellular enzyme inward diffusion, which is a great energy-consuming process for the micro-organisms, thus reducing SOC decomposition [80,81]. The degree of SOC decomposition in aggregates is not uniform due to the different strengths of different grades of aggregates and different cementitious materials [82]. Studies have pointed out that water-stable aggregates with a diameter greater than 0.250 mm contain more particulate organic C (POC), lighter-group organic C (LFOC), and higher microbial biomass C (MBC) [83]. This indicates that the large aggregates have low organic C stability [84]. Based on the study of loess soil, it is also shown that the oxidizable organic C in loess soils mainly concentrate in the 0.2-2 mm large aggregates particle group, while the stable aromatic organic C concentrate in the particle groups smaller than 0.002 mm [83]. Previous study also showed that roots and mycelium can directly promote the formation of large aggregates, and micro-aggregates can form in large aggregates [77]. Then, Henson et al. [83] further emphasized that the large aggregate-wrapped particulate organic matter creates the conditions for the formation of micro-aggregates, while the particulate organic matter encapsulated by the micro-aggregates is more physically protected, which has important effects on the stability of SOC [84,85]. Therefore, large aggregates are the guarantee for the long-term storage of SOC [86,87].
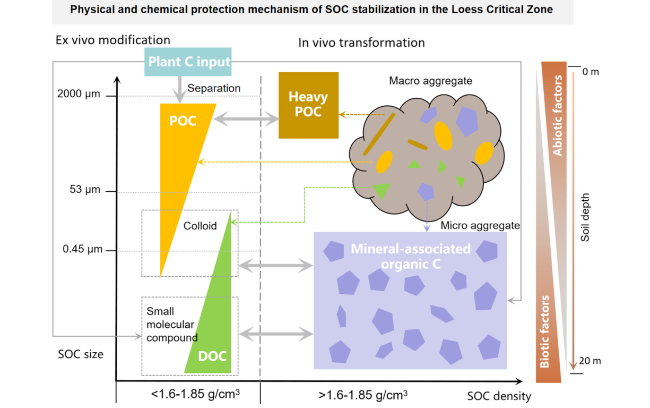
Fig. 6 Physical and chemical protection mechanism of SOC stabilization in the Loess Critical Zone |
In addition, the cohesive particles in soil aggregates have a large specific surface area and surface charge, with a strong adsorption capacity for SOC [88,89,90]. In fact, SOC aggregates mainly composed of amorphous minerals such as allophane, ferrihydrite, and imogolite, with inorganic binders amorphous iron oxides and calcium magnesium carbonates and organic C substitution or formation of ionic bonds to form organic-inorganic complexes [91,92,93,94]. On the Loess Plateau, the rare earth element concentrations of different phases vary in the loess-paleosol layers and are most enriched in the easily reducible phase (except for the residual phase), which is likely explained by the association of are earth element with Mn-oxides [88]. Most parts of the Loess Plateau belong to the parent material of loess which has a strong surface adsorption capacity, it is more likely to adsorb hydrophobic organic C with poor degradability, and the clay particles occupy most of them [23]. Therefore, it is not difficult to understand that the content of clay is usually positively correlated with the content of SOC [95], and the stabilizing effect of loess to SOC has been widely validated both indoors and field [20,96,97,98]. In fact, the specific surface area of the soil and cation exchange capacity determine the ability of SOC sequestration [35,99,100,101]. More of studies reported that amorphous calcium oxides are the decisive factor in promoting SOC sequestration on the Loess Plateau [20,35]. Therefore, soils rich in amorphous calcium oxides on the Loess Plateau may be the dominant mechanism for the stabilization of SOC.
6.2 Microbiological metabolic protection
Soil organic C mineralization is carried out by the soil microorganisms, and overwhelmingly by the catabolic activity of the microbial community [102]. Consequently, the mechanisms of microbial metabolism are ultimately responsible for SOC stabilization [103]. There have been several descriptions of SOC stabilization mechanisms. Here we rearrange previous concepts under three main types of SOC stabilization mechanisms: microbial physiological inhibition; microbial metabolic limitation, and microbial access constraint [104,105]. We define physiological inhibition as conditions inducing overall microbial inactivity or dormancy; metabolic limitation as conditions modulating microbial catabolism, including C use efficiency (CUE) [100]; while access constraint refers to the physical barriers for microorganisms or their exoenzymes to reach and metabolize a SOC substrate (Fig. 7). Microbial physiological inhibition and metabolic limitation can be considered as spanning a continuum, in which when conditions that determine inhibition pass a threshold allowing microorganisms to break dormancy and become active [101], the rate of SOC mineralization will become controlled by the factor(s) limiting microbial activity [106]. On the other hand, if SOC is protected from microbial access by spatial impediments, it will be less sensitive to microbial metabolic limitations [107,108]. Microbial physiological inhibition and access constraint are responsible for SOC persistent on the long term (century to millennia), while microbial metabolic limitation controls short-term SOC persistence (years to decades) in the Loess Critical Zone.
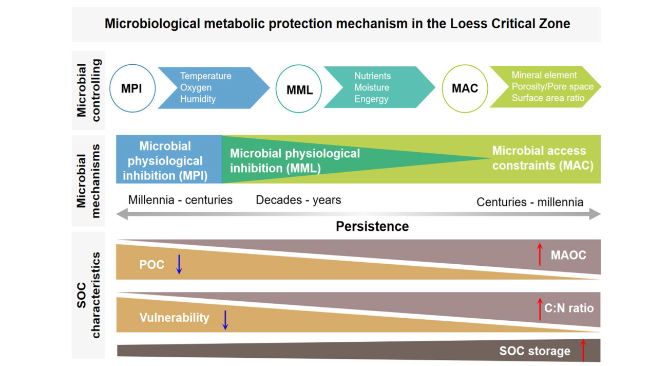
Fig. 7 Schematic representation of the mechanisms of stabilization of SOC in the Loess Critical Zone. Microbial physiological inhibition (MPI) is caused by freezing temperatures or lack of oxygen, and results in extremely low microbial processing of plant inputs, which thus accumulate largely as particulate organic C (POC) and can persist for millennia, forming C-rich organic soils characterized by low C:N ratios. MPI transitions to microbial metabolic limitation (MML) when conditions still limit but do not entirely inhibit microbial activity. Thus, MML is controlled by the availability of energy, nutrients, and moisture to microorganisms. High levels of MML result in higher accumulation of soil organic matter (SOC) in POC, higher soil C:N, relatively low SOC persistence, and high SOC vulnerability to changes that may release MML. Microbial access constraints (MAC) limit the access of microorganisms and their enzymes to SOC. Since organo-mineral associations and protection within small pores are the main spatial constraints on microbial access to SOC, MAC is controlled by the soil mineral capacity to form strong organo-mineral bonds (i.e., Al, Fe, Ca, and available reactive surface area), and by pore space and moisture. Most of the SOC protected by MAC is in MAOC, which may persist in soils for up to millennia and is generally less vulnerable to environmental changes. In soils with lower overall SOC stocks, where available SOC is likely have undergone microbial processing, MAC is the prevailing mechanism of SOC persistence |
7 Controls of SOC persistence in the Loess Critical Zone
7.1 Climate change
Here, we proposed the simply framework to overcome this knowledge gap and provide a hierarchical structure to test the effect of different factors on SOC persistence (Fig. 8). We propose climate change and human activity to be the overarching control on SOC persistence when it imposes either a physiological inhibition (freezing temperature, anoxic conditions, severe drought), or a large metabolic limitation (low/very high temperature and moisture) on microbial activity [109,110].
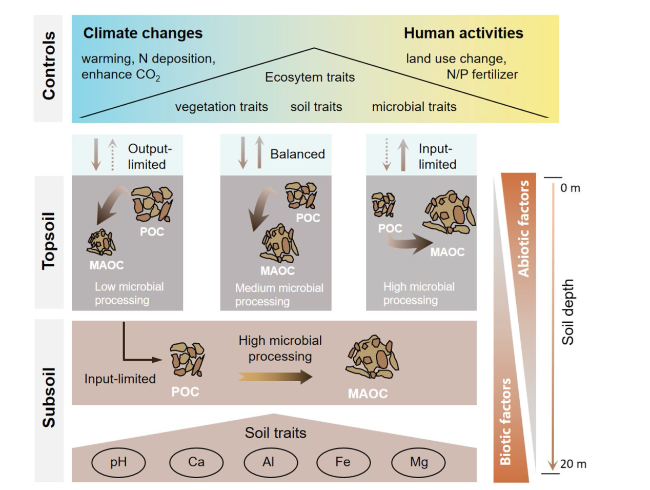
Fig. 8 Conceptual representation of SOC persistence framework in the Loess Critical Zone. Arrows in top and bottom panel are color-coded according to potential controls. We hypothesize (right panel) that C input limits soil C cycling when plant photosynthesis is constrained relatively more than microbial activities. In these ecosystems, microorganisms process the small available plant C inputs, resulting in low soil C stocks with relatively high mineral-associated organic C (MAOC) accumulation controlled by the availability of soil minerals for stabilization of microbial products. C input-limited ecosystems are expected to have decoupled C cycling. We also hypothesize (left panel) C output limitation to control soil C cycling in systems where microorganisms are more inhibited than plants. C-output limited systems would be characterized by higher POC relative to MAOC. Further, we hypothesize (central panel) that balanced plant C inputs vs microbial C outputs will result in soils having more equal shares of POC and MAOC. Further, we expect climate changes and human activities to be the main driver of C input- and C output-limited systems, while ecosystem traits emerging from the interaction of plant, microbial, and soil traits to be significant drivers of soil C dynamics in ecosystems with more balanced inputs and outputs. Finally, we hypothesize (bottom panel) that subsoil are input-limited and their SOC dynamics are largely controlled by soil traits, including mineral properties |
Climate regimes also affect microbial access to resources, thus controlling SOC persistence by modulating the microbial access constraint mechanism. For example, areas with higher precipitation and humid soils are associated with higher SOC storage, likely because of the increased plant productivity and inputs, but possibly also because higher precipitation promotes dissolved organic C (DOC) leaching and mineral-associated organic C (MAOC) formation [111]. Warming increases the soil temperature and microbial activity and therefore stimulates SOC transformations. Typically POC is most vulnerable to the temperature because it’s largely unprotected, and the temperature controls microbial energy limitation, which is the primary mechanism of POC stabilization. Accelerated POC losses with warming may result in increased MAOC formation [112], as more microbial products are formed from POC decomposition which can associate to minerals. In addition, atmospheric precipitation-induced surface runoff can cause soil erosion, resulting in soil eroded C [29]. During the migration process, eroded C may undergo selective degradation, sedimentation, and other biogeochemical and physical processes, ultimately leading to the formation of stable SOC by burial effect.
7.2 Biotic and abiotic factors
We now understand that the persistence of SOC is also driven by a complexity of biotic and abiotic factors [107,108]. Variations in physicochemical and biological properties are evident across different soil layers [26]. In terms of chemical weathering, plant roots play a significant role, while mycorrhizal fungi release nutrients through organic acid dissolution, making them accessible for uptake and utilization by organisms [113]. The chemical composition of deep soil has a considerable impact on plant biomass and ecosystem self-evolution. Factors such as microbial biomass, extracellular enzymes, substrate quality and quantity, and environmental conditions can influence the mineralization rate of organic materials from various sources [9,114,115]. Factors such as vegetation primary productivity, litter production and decomposition rates directly impact the content and turnover rate of SOC, thereby affecting soil C migration, transformation, and sedimentation in the critical zone [114,115]. Given that climate is a soil forming factor in interactions with parent material, topography, time, vegetation and other biotic factors [116], in the long term it affects SOC persistence in all soils. Additionally, climate controls long-term mineral weathering, and thus the interactions between geochemistry and climate need to be taken into account when studying SOC dynamics and storage [103,117]. This interaction, in fact, determines mineral reactivity, thus controlling nutrient availability and microbial community composition and metabolism, and modulating the energy and nutrient availability and pathways ultimately responsible for SOC persistence [103].
8 Soil C cycling model in the Loess Critical Zone
Recently, most of studies develop C budget models for terrestrial ecosystems and investigate the mechanisms underlying the dynamics of SOC by the indoor and field experiments [19,58]. However, the complex interactions among C pools and the scarcity of long-term, site-specific data limit the measurements of SOC. Consequently, the mutual interaction mechanisms among the various SOC pools in the LCZ are not yet fully elucidated. The contribution of soil microbial residues to SOC may have been significantly underestimated [89]. Most of terrestrial ecosystem models in domestic and international research have overlooked or rarely considered microbial effects [118,119,120,121]. However, the development of microbial models provides an opportunity to integrate them with ecosystem models [122,123,124]. Recent advancements have explicitly incorporated the role of microorganisms as decomposers in simulating SOC decomposition [88,98]. These models separate microbial biomass C from extracellular enzymes and analyze their independence, integrating enzyme-driven dynamics of SOC [88].
The microbial residues play a direct role in contributing to the stable C pool in the soil [93]. Traditional models for SOC decomposition often utilize first-order decay kinetics equations, neglecting the role of microorganisms [93,98]. However, in recent years, several models have employed Michaelis-Menten equations to describe SOC decomposition, such as CON (Conventional Model), GER (German), and MEND (Microbial Enzyme-mediated Decomposition). These models consider the microbial biomass C pool and have shown better performance compared to first-order kinetics models [88,93]. The formation of stable soil C pools through microbial metabolites and residues is critical in SOC decomposition process [93]. Nevertheless, these models do not treat the microbial residue C pool as a separate entity. Recently developed SOC-microbial decomposition models provide a solid theoretical foundation and can be applied to the C cycling model in the Loess Plateau [7,29,95]. For example, increase microbial residue C pool to the first-order kinetics model and Michaelis-Menten model (Fig. 9). Fan et al. [74] established two models named Michaelis-Menten Necromass Decomposition (MIND) and First-order Necromass Decomposition (FOND), to simulate the microbial residue C pool. These models were validated using a 13C decomposition experiment, demonstrating their accuracy and effectiveness. The Michaelis-Menten model exhibited superior precision compared to the first-order kinetics model. Based on these findings, it was estimated that the microbial residue C pool accounts for 10%-27% of the total organic C in various global ecosystems [8,98]. Further, soil microbial residues are 40 times greater than the living microbial biomass, and they contribute 25%-40% to the SOC pool [8]. Therefore, it is essential to incorporate the microbial residue C pool into the SOC model of the Loess Plateau. This integration can improve the simulation accuracy of SOC and reduce the uncertainties associated with C stock estimation. Furthermore, by comparing with global SOC databases, it is possible to enhance the model’s predictive capabilities effectively.
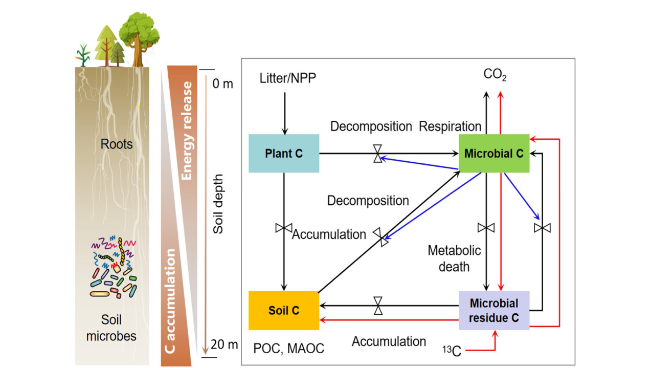
Fig. 9 Model of C pools model of SOC cycling in the Loess Critical Zone (including microbial biomass poll and residue C pool). Note: There are two pathways through which soil organic carbon is formed from plant litter. The first pathway involves the direct sedimentation and coagulation of litter C modified by microbial extracellular enzymes into the soil. The second pathway is an indirect transformation where litter carbon is first assimilated by soil microorganisms and then synthesized into microbial biomass C. When these microorganisms die, their residues accumulate in the soil, contributing to the organic carbon pool. The direction and magnitude of these processes are influenced by environmental factors, as indicated by the valve symbols on each arrow. The blue solid line represents the Michaelis-Menten kinetics, which regulates the size and dynamics of the microbial biomass C pool. The red solid line arrow represents the pathway when.13C-labeled C in microbial residues is introduced into the system (adapted from [74]) |
9 Perspective
9.1 Exploring soil C cycling at the long- and short scale
The soil C cycling in the LCZ encompasses both short-term and long-term biogeochemical processes. To gain a better understanding of these processes, it is crucial to investigate the short-term scale changes in C cycling within the LCZ. It is recommended to establish a high-resolution online monitoring system and a comprehensive database for typical subsystems in the LCZ. This can be achieved through surface observations, remote sensing techniques, geographic information technology, and advanced automatic monitoring instruments. By this way, we can analyze the diurnal and seasonal patterns of C transport and investigate their responses to rainfall, climate variations, and human activities. In addition, it is important to incorporate big data geoscience and global C emission pathways, along with other contemporary factors. Developing a unified spatiotemporal observation and statistical approach will facilitate the study of SOC stock and its dynamics in the LCZ.
9.2 Binding the multi-process of C and hydrologic process
The SOC cycling in the LCZ is intricately linked to hydrological processes and nutrient cycling. However, due to their complex interactions and interdependencies, accurately quantifying the contributions of these processes to the C cycling remains challenging. In order to address this knowledge gap, it is crucial to conduct comprehensive research in typical small watersheds within the LCZ. Future study should focus on soil C flux, turnover, average retention time, and exchange rates among different C pools under different hydrological conditions, climates, and human activities. Such studies will help elucidate the mechanisms and characteristics of changes in SOC, nutrient components, and hydrological processes, as well as their primary influencing factors. Furthermore, it is important to enhance our understanding of the impacts of human activities on SOC migration and transformation by conducting investigations on the identification and tracing of C caused by human activities in the LCZ.
9.3 Paying attention to the roles of microorganisms in C cycling
Advancements in technology, such as third-generation sequencing techniques, stable isotopic tracer methods, DNA-stable isotope probes, and high-throughput sequencing, provide the opportunities to investigate the mechanisms by which microorganisms decompose SOC pool and drive its transformation. In addition, metagenomics can provide valuable information on the structure and function of soil microbial communities, enabling the determination of species types, metabolic functions, and their association with C cycling processes. In our future study, it is necessary to employ a comprehensive approach using techniques from molecular biology, isotopic tracing, and earth system science, with a focus on microbiology and soil C cycling models. This interdisciplinary approach will enhance our understanding of the biogeochemical processes involved in soil C cycling and facilitate the evaluation of C sequestration potential in the LCZ, ultimately aiding in achieving C-related targets.
Abbreviations
LCZ $\ \ \ \ \ \ \ \ $ Loess Critical Zone
ECZ $\ \ \ \ \ \ \ \ $ Earth Critical Zone
C $\ \ \ \ \ \ \ \ $ Carbon
SOC $\ \ \ \ \ \ \ \ $ Soil organic C
SOM $\ \ \ \ \ \ \ \ $ Soil organic matter
POC $\ \ \ \ \ \ \ \ $ Particulate organic C
LFOC $\ \ \ \ \ \ \ \ $ Lighter-group organic C
MBC $\ \ \ \ \ \ \ \ $ Microbial biomass C
DOC $\ \ \ \ \ \ \ \ $ Dissolved organic C
CUE $\ \ \ \ \ \ \ \ $ C use efficiency
CON $\ \ \ \ \ \ \ \ $ Conventional Model
GER $\ \ \ \ \ \ \ \ $ German
MEND $\ \ \ \ \ \ \ \ $ Microbial Enzyme-mediated Decomposition
MIND $\ \ \ \ \ \ \ \ $ Michaelis-Menten necromass Decomposition
FOND $\ \ \ \ \ \ \ \ $ First -order Necromass Decomposition
Acknowledgements
This work was funded by the National Natural Sciences Foundation of China (grant nos. 42377241; 42107282), the Youth Innovation Promotion Association of the Chinese Academy of Sciences (grant no. 2023430), the Natural Science Foundation of Gansu Province (grant no. 22JR5RA075), General Projects of Shaanxi Provincial Department of Science and Technology (grant no. 2021JQ-168).
Authors’ contributions
YY and Z-PP conceived and designed this study. YY, SY, SH, L-ZM, Q-JB performed the field trip, sample analysis and data analysis. YY, W-YQ drafted the original manuscript. A-SS provided very constructive suggestions.
Funding
Open access funding provided by Shanghai Jiao Tong University.
Availability of data and materials
All data generated or analysed during this study are included in this published article.
Declarations
Ethics approval and consent to participate
The manuscript is original and not submitted to other journal. The authors consent to participate in the manuscript.
Consent for publication
The manuscript has been read and approved by all authors, and all authors agree to the publication of the manuscript.
Competing interests
Changying Zhao is the editor-in-chief of Carbon Neutrality and was not involved in the editorial review, or the decision to publish this article. All authors declare that there are no competing interests.
Publisher’s Note
Springer Nature remains neutral with regard to jurisdictional claims in published maps and institutional affiliations.
