
1 Introduction
Proton exchange membrane fuel cells (PEMFCs) are a promising power device for a wide range of applications such as vehicles and power plant, which would alleviate reliance on fossil fuels. However, there still exist major challenges for improving performance, enhancing durability and reducing cost of PEMFCs. The catalyst layer (CL) is a key component in PEMFCs which directly determines the efficiency during the conversion from chemical energy to electricity. It is the most complicated, yet least understood component inside PEMFCs. Comprehensive understanding of the complicated interactions between porous structures, spatial distributions of different constituents (carbon, Platinum, ionomer, and pores) and multiple coupled reactive transport processes (two-phase flow, heat transfer, species transport, electron and proton conduction, electrochemical reactions) inside CLs is crucial for improving the cell design and enhancing the cell performance.
The complex multiscale structures and complicated multiple processes inside CLs pose great challenges for conducting in-situ experimental studies. Alternatively, numerical simulation has been developed as a powerful tool for exploring the underlying physicochemical processes within CLs [1,2]. In fact, considerable efforts have been devoted to developing models for physiochemical processes in CLs with increasing accuracy of describing distributions of different constituents and multiple reactive transport processes. Existing CL models can be generally divided into three kinds, the thin-film model [3], the homogeneous model [4] and the agglomerate model [5]. Among them, the agglomerate model recognizes the hierarchical structures of CL including large pores between agglomerates consisted of carbon particles where the oxygen bulk diffusion occurs and the relatively small pores inside the agglomerate in which the local oxygen reactive transport takes place. In the literature, the above local processes have been demonstrated to significantly affect the cell performance, especially under a lower Pt loading [6]. It has been found that the conventional agglomerate model cannot accurately describe such local processes [7], which predicts the unphysical results that the limiting current density is a constant in the concentration polarization region even the Pt loading is significantly reduced.
A few schemes have been proposed to improve the agglomerate model, such as the model proposed by Cetinbas et al. [6] to consider the dispersion of Pt particles, and the effective length scheme proposed by Darling et al. [8] for considering the actual transport length of oxygen from the agglomerate surface to the Pt surface. Hao et al. [9] pointed out that the conventional agglomerate model assumes unphysical agglomerate size and ionomer thickness which were not supported by the experiments. Therefore, they developed a single-particle model for better describing the local oxygen transport processes around the Pt particles dispersed on a single carbon particle, by which the local oxygen transport resistance predicted is in good agreement with the experimental results [9]. This single-particle model has gained much attention and been widely adopted in the literature. Xie. et al. [5] developed a multiscale model by coupling a 3D multiphase PEMFC model with an improved single-particle model, in which the micropores inside the carbon particles were considered and the local oxygen transport processes around the porous carbon particles were effectively evaluated. Wang et al. [10] developed an improved single-particle model that considered the coupled local oxygen transport and ionic transport in a carbon particle, which was then incorporated into a multiphase PEMFC model. Using the multiscale model, the cathode CL was optimized with lower local transport resistance and higher cell performance. Yu et al. [11] adopted the single-particle model to study the effects of Pt loading, carbon loading and ionomer volume fraction on the cell performance. Nevertheless, even if agglomerates with size larger than hundreds to thousands of nanometers may not exist in the CLs as argued by Hao et al., the contact and overlap between neighboring carbon particles indeed have been widely and clearly observed in the experiments (as shown in Fig. 1(a) and (b)) by different techniques such as transmission electron microscope (TEM), focused ion beam scanning electron microscopy (FIB-SEM) and high-angle annular dark-field scanning transmission electron microscope (HAADF-STEM) [12,13,14,15]. Up to now, such contact and overlap, which has not been considered in the single-particle model and the corresponding improved single-particle models, definitely will change distributions of different constituents in the space between carbon particles (Fig. 1(c) and (d)), such as the ionomer distribution which significantly affects the local oxygen transport processes. It is thus desirable to recognize the above structural characteristics and reveal their effects on the local physicochemical processes and the cell performance.
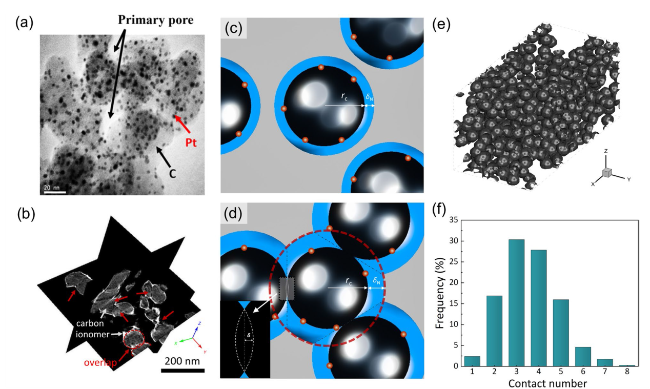
Fig. 1 Structure characterization of the CLs. (a) TEM image where Pt particles, carbon particles and primary pores are resolved. (b) Three ortho slices extracted from the tomograms of a catalyst layer sample (I/C=0.5) (modified from Ref. [12]). (c) Carbon particles without contact and overlap corresponding to the state-of-art single-particle model widely adopted in the literature. (d) Carbon particles with contact and overlap. (e) The reconstructed CL structures with carbon particles by adopting the reconstruction method in Ref. [13]. (f) Frequency distribution of contact number k |
Besides, in the CLs, efficient water and thermal management are of paramount importance for enhancing the cell performance [16,17] and ensuring the safe operation [18]. Proper management can mitigate flooding, avoid local hot spot, suppress ionomer dehydration, stabilize cell voltage, and extend the PEMFC lifespan [19]. It is reported that liquid water transport within the porous electrodes of PEMFCs follows two major mechanisms: phase-change-induced (PCI) flow and capillary-driven (CD) flow [20,21]. The former one describes the gaseous water transport caused by phase change between liquid and vapor [22]. The latter one, on the other hand, describes the liquid water transport driven by capillary pressure [23]. While there have been many studies of the two kinds of flow inside the gas diffusion layer (GDL) [24,25], the work related to CLs is rare. Xu et al. employed a non-isothermal, two-phase model to evaluate the ratio of PCI flow to CD flow within the CLs [26]. They found that as CL temperature increased, a higher ratio of PCI flow to CD flow was obtained. In fact, the PCI flow is significantly affected by the temperature distribution inside the CLs. Xu et al. [26] found that from CL/PEM interface to CL/MPL interface, the temperature first increased and then reduced, with the highest temperature located inside the CLs. Li et al. [27] found that the temperature monotonically decreased from the CL/PEM interface to the CL/MPL interface with the highest temperature at the CL/PEM interface, which is different from that of Xu et al. Different temperature distribution leads to different phase change behaviors, generates liquid water distribution inside the CLs, and thus affects the CL performance. It is important to study the coupled mechanisms between heat transfer and PCI flow considering the continuously increased current density of PEMFCs.
From the above literature, it can be found that tremendous effect has been devoted to developing models that can more accurately describe the CL nanoscale structures and the physicochemical processes inside CLs, yet there are still much room for improvement. Moreover, coupled multiphase flow and heat transfer inside the porous structures of CLs, which leads to different mechanisms of water transport including vapor diffusion, PCI flow and CD flow, is not well understood. Therefore, the present study aims to develop a model that can more accurately describe the hierarchical structures inside CLs and the local oxygen reactive transport processes, which also can be conveniently integrated into the cell-scale models for predicting the overall performance of PEMFCs. To this end, a new particle-overlapping model for analyzing local oxygen transport processes is developed which considers the structural characteristics of carbon particles widely observed in experiments [12,28]. Analytical solutions for the oxygen transport processes and thus volumetric current density are derived based on the particle-overlapping model (Section 2). The particle-overlapping model is validated by local transport resistance under different roughness factor from the experiments (Section 3). Furthermore, in Section 3, the coupling between the particle-overlapping model and cell-scale models of PEMFCs is introduced, and the coupling model is validated by comparing the simulated and experimental polarization curves and local current density distributions. In Section 4, assisted by the coupled model, effects of Pt loading, I/C, ionomer coverage and carbon particle radius on the cell performance are studied. Additionally, to elucidate the transport mechanisms of liquid water within the CLs, the distributions of temperature, saturation, PCI flow and CD flow within the cathode CL are also discussed. Finally, critical conclusions are drawn in Section 5.
2 Development of carbon particle-overlapping model
2.1 Characterization of the carbon particle overlapping
Accurately describing the CL structures is the first step towards a deeper understanding of the relationship between structures, transport processes, and performance of CLs. As shown by the TEM in Fig. 1(a), it is widely observed that the CL consists of overlapping carbon particles, the Pt particles loaded on the carbon surface, thin ionomer film covered on the Pt/carbon structures, and pores [12,29,30,31]. Recently developed high-resolution experimental techniques, such as X-ray, FIB-SEM, TEM, etc., are helpful for exploring such complicated nanoscale structures and distributions of different constituents. Figure 1(b) presents three slices extracted from the tomograms of a CL sample by HAADF-STEM with atomic-scale resolution [12], in which dark, light gray and bright white parts are the pores, the carbon particles and the ionomer strained with Cs+ ions, respectively. Careful observations of Fig. 1(b) show that carbon particles with diameter of 20-50 nm tend to contact and overlap with each other. Such contact and overlap characteristics also have been acknowledged in several studies about reconstructing the porous structures of CLs and subsequent pore-scale studies of reactive transport processes [28,32,33,34,35]. For example, Lange et al. [36] set the value of overlap tolerance δ as 10~30 % of the carbon particle radius, and in the work of Inoue and Kawase the maximum value of δ is set as 9 nm [13]. Besides, the value of δ in Haro et al. [12] is estimated to be about 18.0 % of the carbon particle radius. Figure 1(c) schematically displays the carbon particles without contact and overlap, where the ionomer can cover the entire surface of carbon particles, which actually is the circumstance considered in the single-particle model proposed by Hao et al. which has been widely adopted in the literature [9]. As shown in Fig. 1(d), with contact and overlap considered, the space between carbon particles is squeezed, and particularly, the local ionomer film is forced to deform and becomes thicker due to the reduced surface area of carbon particles. It is expected that compared with the single-particle model [9], such overlapping characteristics altering the constituent distributions will affect the local oxygen transport processes and thus the CL performance.
Therefore, the present study aims to develop a model recognizing the above overlapping characteristics, which is herein called particle-overlapping model. Two important parameters charactering such overlapping are the overlapping tolerance δ as mentioned above and the number of carbon particles in contact with a carbon particle under consideration k. The reconstruction method developed by Inoue and Motoaki [13] is adopted to determine the value of k. The general procedures of the reconstruction can be described as follows. Carbon particles are randomly placed in the computational domain according to a certain probability density which can control the reconstructed shapes of carbon particle connected as contracted or stretched shape. The lower the probability density, the more sphere-like shape the carbon particles becomes, while chain-like shape of carbon particles can be obtained under a higher probability density [37]. Details of the above reconstruction method can be found in the Supplementary materials. Following this reconstruction method, one of the typical CL structures generated is shown in Fig. 1(e) with porosity and I/C as 0.5 and 0.8, respectively. Note that to eliminate the random effects, more than twenty structures with the same reconstruction constrained parameters are generated. Based on these generated porous structures, the values of k can be evaluated and are plotted in Fig. 1(f). It can be found that it is with high probability that a carbon particle is contacted with 3-4 neighboring carbon particles.
2.2 Structural model for carbon particle overlapping
In this section, first the structural model for the single-particle model in the literature is introduced [9]. Then the particle-overlapping model is established. Let us consider a spherical carbon particle with radius rc covered by a thin ionomer film with uniform thickness of δN (in Fig. 1(c)), the volume of carbon particle Vc and the total volume of carbon and ionomer Vtotal are as follows
$V_{{\text{c}}} = \frac{4}{3}\pi r_{{\text{c}}}^{3},\,\,V_{{{\text{total}}}} = \frac{4}{3}\pi \left( {r_{{\text{c}}} + \delta_{{\text{N}}} } \right)^{3}$
Note that the ionomer to carbon weight ratio I/C and the Pt to catalyst weight ratio Pt/C are two prescribed parameters for catalyst slurry preparation, based on which the volume of ionomer and platinum VN and VPt can be calculated
$V_{{\text{N}}} = \frac{{{I / C}}}{{{{\rho_{{\text{N}}} } / {\rho_{{\text{c}}} }}}}V_{{\text{c}}},\,\,V_{{{\text{Pt}}}} = \frac{{{{Pt} / C}}}{{1 - {{Pt} / C}}}\frac{{\rho_{{\text{c}}} }}{{\rho_{{{\text{Pt}}}} }}V_{{\text{c}}}$
The following equation should be satisfied
$V_{{\text{N}}} + V_{{{\text{Pt}}}} { = }V_{{{\text{total}}}} - V_{{\text{c}}}$
Combining Eqs. (1)- (3), the ionomer thickness δN can be determined
$\delta_{{\text{N}}} = \left[ {\left( {1 + \frac{{{I / C}}}{{{{\rho_{{\text{N}}} } / {\rho_{{\text{c}}} }}}} + \frac{{{{Pt} / C}}}{{1 - {{Pt} / C}}}\frac{{\rho_{{\text{c}}} }}{{\rho_{{{\text{Pt}}}} }}} \right)^{1/3} - 1} \right]r_{{\text{c}}}$
The above model is the ionomer thickness determined in the single-particle model [9] without considering the contact and overlap of carbon particles. By considering the contact and overlap and assuming the carbon particles are uniformly distributed around the carbon particle under consideration (as shown in Fig. 1(d)), the expressions of Vc and Vtotal in Eq. (1) can be easily modified as follows
$V_{{\text{c}}} = \frac{4}{3}\pi r_{{\text{c}}}^{3} - k \times \pi \delta^{2} \left( {r_c - \frac{\delta }{3}} \right)$
$V_{{{\text{total}}}} = \frac{4}{3}\pi \left( {r_{{\text{c}}} + \delta_{{\text{N}}} } \right)^{3} - k \times \pi \left( {\delta + \delta_{{\text{N}}} } \right)^{2} \left( {r_{{\text{c}}} + \delta_{{\text{N}}} - \frac{{\delta + \delta_{{\text{N}}} }}{3}} \right)$
The second term on the right side of Eqs. (5) and (6) denotes the overlapping regions of two neighboring carbon particles with shape of spherical cap.
By solving Eqs. (2), (3), (5) and (6), the following cubic equation for determining δN with carbon particle contact and overlap can be obtained
$A\delta_{{\text{N}}}^{3} + B\delta_{{\text{N}}}^{2} + C\delta_{{\text{N}}} + D = 0$
where A, B, C and D are constants
$A = \frac{4}{3}\pi - \frac{2}{3}\pi \times k$
$B = 4\pi r_{{\text{c}}} - \frac{4}{3}\pi \delta \times k + \left( {\frac{\delta }{3}\pi - \pi r_{{\text{c}}} } \right) \times k$
$C = 4\pi r_{{\text{c}}}^{2} - \frac{2}{3}\pi \delta^{2} \times k + 2\delta \left( {\frac{\delta }{3}\pi - \pi r_{{\text{c}}} } \right) \times k$
$D = - \frac{4}{3}\pi \frac{{{{Pt} / C}}}{{1 - {{Pt} / C}}}\frac{{\rho_{{\text{c}}} }}{{\rho_{{{\text{Pt}}}} }}r_{{\text{c}}}^{3} - \frac{4}{3}\pi r_{{\text{c}}}^{3} \frac{{\rho_{{\text{c}}} }}{{\rho_{{\text{I}}} }} \times {I / C}$
The cubic equation Eq. (7) can be analytically solved. The solution process and the expression of the general solution can be found in Eqs. (S1)-(S3) in the Supplementary materials.
$S_{{\text{c}}} = 4\pi r_{{\text{c}}}^{2} - 2\pi r_{{\text{c}}} \delta \times k$
$S_{{\text{N}}} = 4\pi \left( {r_{{\text{c}}} + \delta_{{\text{N}}} } \right)^{2} - 2\pi \left( {r_{{\text{c}}} + \delta_{{\text{N}}} } \right)\left( {\delta + \delta_{{\text{N}}} } \right) \times k$
$S_{{{\text{Pt}}}} = n_{{{\text{Pt}}}} \times 4\pi r_{{{\text{Pt}}}}^{2}$
where rPt is the radius of the Pt particles and nPt denotes the number of Pt particles deposited on a carbon particle
$n_{{{\text{Pt}}}} = \frac{{V_{{{\text{Pt}}}} }}{{\frac{4}{3}\pi r_{{{\text{Pt}}}}^{3} }} = \frac{{{{Pt} / C}}}{{1 - {{Pt} / C}}}\frac{{\rho_{{\text{c}}} }}{{\rho_{{{\text{Pt}}}} }}\left( {\frac{{r_{{\text{c}}} }}{{r_{{{\text{Pt}}}} }}} \right)^{3}$
The specific surface area of the three constituents is expressed as
$a_{{\text{c}}} = \frac{{S_{{\text{c}}} }}{{{{V_{{{\text{total}}}} } / {\left( {1 - \varepsilon_{{\text{p}}} } \right)}}}},\,\,a_{{\text{N}}} = \frac{{S_{{\text{N}}} }}{{{{V_{{{\text{total}}}} } / {\left( {1 - \varepsilon_{{\text{p}}} } \right)}}}},\,\,a_{{{\text{Pt}}}} = \frac{{S_{{{\text{Pt}}}} }}{{{{V_{{{\text{total}}}} } / {\left( {1 - \varepsilon_{{\text{p}}} } \right)}}}}$
where εp is volume fraction of pores in the CLs, namely the porosity. εp is a crucial parameter of CL which can significantly affect oxygen diffusion. In this study εp is a constant because carbon particle overlap has minimal effects on CL porosity. It can be calculated that, for δ as 3nm, as k increases from 0 to 4, the reduction of the total volume of carbon phase due to overlap is only 0.55%, 1.10%, 1.66%, and 2.21%, respectively. Accordingly, the CL porosity increases slightly and can be negligible.
Finally, Pt loading, is related to the Pt/C as follows
$L_{{{\text{Pt}}}} = \frac{{V_{{{\text{Pt}}}} }}{{{{V_{{{\text{total}}}} } / {\left( {1 - \varepsilon_{{\text{p}}} } \right)}}}} \times \delta_{{{\text{CL}}}} \rho_{{{\text{Pt}}}} = \frac{{{{Pt} / C}}}{{1 - {{Pt} / C}}}\frac{{\rho_{{\text{c}}} V_{{\text{c}}} \delta_{{{\text{CL}}}} }}{{{{V_{{{\text{total}}}} } / {\left( {1 - \varepsilon_{{\text{p}}} } \right)}}}}$
where δCL denotes the CL thickness.
Fig. 2(a) displays the variation of ionomer thickness δN with δ and k under a typical I/C as 0.95 and Pt/C as 0.2 [38,39]. The values of other related variables are listed in Table 1. For the case with both k and δ as zero, corresponding to the single-particle model proposed in Ref. [9], δN is only about 5.7 nm. With the contact between carbon particles considered, even if δ is zero indicating loose contact, δN increases as k increases, because the space between carbon particles is squeezed. When the overlap is further considered, it can be clearly found that the local confined space between the overlapping carbon particles leads to thicker ionomer film. For example, with the typical value of k as 3~4 and δ as 5 nm, the value of δN can be as high as 10 nm. What’s more, it can be found that at relatively high δ, the range of k will be reduced. For example, with δ as 5 nm, the range of k is limited to 0-3. This is because as δ increases, the space between carbon particles is compressed, and a larger k will lead to insufficient space for attachment of ionomer film on the carbon surface (i.e., no real solutions for Eq. (7)). δN under different I/C is also evaluated (as shown in Fig. S2 in the Supplementary materials), and the results show that generally a higher I/C results in a higher δN (namely a thicker ionomer film) as expected.
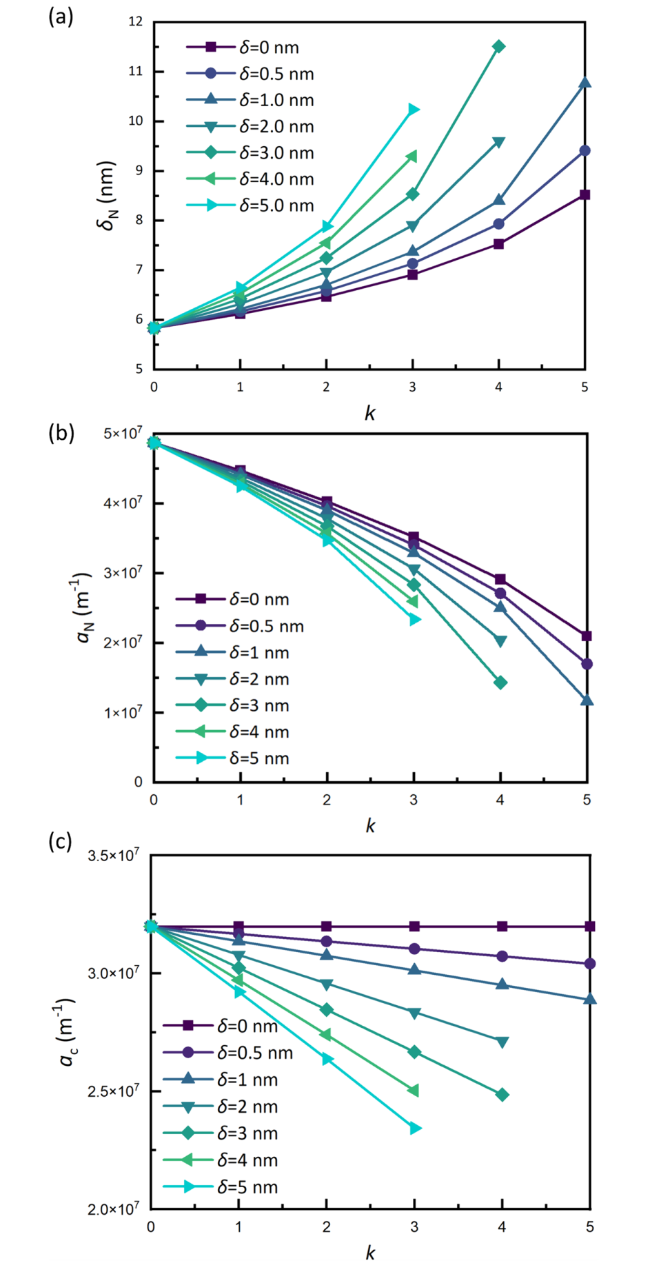
Fig. 2 Effects of contact and overlap of carbon particles on key structural parameters. (a) Ionomer film thickness δN. (b) Specific surface area of ionomer aN. (c) Specific surface area of carbon ac |
| Variables | Symbols | Values |
|---|---|---|
| Carbon radius | rc | 25 nm |
| Carbon density | ρc | 1.8 g cm-3 |
| Nafion density | ρN | 2.0 g cm-3 |
| Pt density | ρPt | 21.45 g cm-3 |
| Catalyst layer thickness | δCL | 10 μm |
| Electrochemical surface area | ECSA | 70 m2 g-1 |
| Porosity | εp | 0.5 |
| Henry’s constant | HN | 2.21×10⁴ Pa m3 mol-1 |
| Ionomer-Pt interfacial coefficient | ζ | 0.8 |
| Temperature | T | 333.15 K |
| Oxygen diffusivity in ionomer | DN | 1×10⁻¹⁰ m2 s-1 |
The contact and overlap also significantly affect the specific surface area of the ionomer aN as shown in Fig. 2(b). It can be found that as δ or k increases, aN decreases. Note that aN in fact is the specific surface area between pore-ionomer that is available for oxygen to diffuse into the ionomer, therefore a lower aN is not desirable for the oxygen transport to the reactive sites. It is worth mentioning aN determined by our model agrees well with experimental results in the literature. For example, Zhao et al. [42] measured the specific surface area by standard porosimetry (MSP) which is about 2.4~3.6×10⁷ m-1. Finally in Fig. 2(c), ac linearly decreases as k or δ increases, consistent with Eq. (9). A lower ac will lead to reduced surface area of carbon particles for loading Pt particles.
Overall, it can be found that the contact and overlap of carbon particles significantly changes the geometrical variables, which will further affect the local oxygen reactive transport processes as discussed in the following section.
2.3 Local oxygen reactive transport model
In this section, the local oxygen reactive transport processes around the above carbon particle overlapping structures are discussed and the corresponding reactive transport model is established. Figure 3 illustrates the oxygen transport processes within the CLs. As shown in Fig. 3(a), oxygen first diffuses in the pores between carbon particles before arriving at each carbon particle. The resistance related to this process is called bulk transport resistance. Figure 3(b) schematically shows the oxygen reactive transport processes around a carbon particle, including dissolution at the pore-ionomer interface, transfer inside the ionomer and electrochemical reaction at the Pt surface. The oxygen concentration undergoes drop in each of the above processes as schematically shown in Fig. 3(c), and the corresponding transport resistance in such local structure is called local transport resistance. The model related to the above processes is as follows.
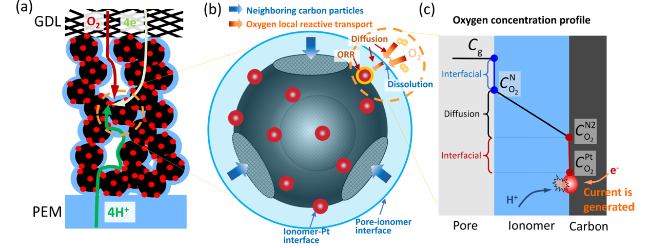
Fig. 3 Schematic of oxygen reactive transport processes in CLs. (a) Oxygen transport processes in the entire CLs. (b) Local oxygen reactive transport around a carbon particle with overlap considered. (c) Oxygen concentration profile across the ionomer film covered on Pt particles |
At the pore-ionomer interface oxygen concentration undergoes a drop obeying the Henry’s law [40]
$C_{{{\text{O}}_{{2}} }}^{{\text{N}}} { = }\frac{RT}{{H_{{\text{N}}} }}C_{{\text{g}}}$
where HN, R and T are the Henry’s constant, the ideal gas constant, and the temperature, respectively. $C_{{{\text{O}}_{{2}} }}^{{\text{N}}}$ is the interfacial oxygen concentration at the ionomer side.
Subsequently, the dissolved oxygen transport inside the ionomer follows the Fick’s law with diffusivity DN [41]
$N_{{{\text{O}}_{{2}} }} { = }\frac{{D_{{\text{N}}} }}{{\delta_{{\text{N}}} }}\left( {C_{{{\text{O}}_{{2}} }}^{{\text{N}}} - C_{{{\text{O}}_{{2}} }}^{{{\text{N2}}}} } \right)$
where $C_{{{\text{O}}_{{2}} }}^{{{\text{N2}}}}$ is the oxygen concentration at the ionomer-Pt interface. Note that in practice the Pt particles are discretely distributed on the carbon particle surface which means before arriving at the Pt surface the oxygen needs to transport a longer way than the ionomer physical thickness δN (Eq. (7)), especially under a low Pt loading [32]. Hence, an effective oxygen transport length in the ionomer film $\delta_{{\text{N}}}^{{{\text{eff}}}}$ is defined and the oxygen flux in Eq. (16) is updated as follows [32]
$N_{{{\text{O}}_{{2}} }} { = }\frac{{D_{{\text{N}}} }}{{\delta_{{\text{N}}}^{{{\text{eff}}}} }}\left( {C_{{{\text{O}}_{{2}} }}^{{\text{N}}} - C_{{{\text{O}}_{{2}} }}^{{{\text{N2}}}} } \right){ = }\frac{1}{{\Omega_{{\text{local,N}}} }}\left( {C_{{{\text{O}}_{{2}} }}^{{\text{N}}} - C_{{{\text{O}}_{{2}} }}^{{{\text{N2}}}} } \right)$
where $\Omega_{{\text{local,N}}}$ represents the oxygen transport resistance in the ionomer film. In the study of Hao et al. [9], the following formula is proposed to calculate $\delta_{{\text{N}}}^{{{\text{eff}}}}$
$\delta_{{\text{N}}}^{{{\text{eff}}}} { = }\chi \times \delta_{{\text{N}}},\,\,\chi { = }\frac{{a_{{\text{N}}} }}{{a_{{{\text{Pt}}}} }}$
While Eq. (18) is directly proposed without detailed explanation in Ref. [9], here pore-scale modeling of oxygen transport around carbon particles with overlapping is further conducted to validate Eq. (18). Details of the pore-scale modeling can be found in Supplementary materials. By comparing the modeling results of Eq. (18) and pore-scale modeling results as shown in Fig. S8, it can be found that ${{a_{{\text{N}}} } / {a_{{{\text{Pt}}}} }}$ leads to accurate prediction and thus in following studies ${{a_{{\text{N}}} } / {a_{{{\text{Pt}}}} }}$ is adopted to calculate the $\delta_{{\text{N}}}^{{{\text{eff}}}}$.
Now attention is turned to oxygen reactive transport around the Pt surface. Oxygen undergoes interfacial transport resistance at the Pt surface $\Omega_{{\text{int,Pt}}}$, which has been recognized in the literature to be an important source of local transport resistance [34,40,43,44,45]. Kudo et al. experimentally studied the interfacial resistance which is equivalent to 30~70 nm thick ionomer film coated on Pt surface [40,46]. The interfacial resistance was also demonstrated by several Molecular Dynamics (MD) simulations [47,48], which demonstrate that the ionomer-Pt interface contributes about 85 % of the local transport resistance. In contrast, the existence of pore-ionomer interfacial resistance is in debate no matter in experimental studies [40,43] or MD simulations [47,48]. Therefore, in the present study, only the ionomer-Pt interfacial resistance is considered in our model, which can be expressed as follows
$N_{{{\text{O}}_{{2}} }} { = }\frac{1}{{\Omega_{{\text{int,Pt}}} }}\left( {C_{{{\text{O}}_{{2}} }}^{{{\text{N2}}}} - C_{{{\text{O}}_{{2}} }}^{{{\text{Pt}}}} } \right)$
where $C_{{{\text{O}}_{{2}} }}^{{{\text{N2}}}}$ and $C_{{{\text{O}}_{{2}} }}^{{{\text{Pt}}}}$ denote the interfacial oxygen concentration at the ionomer side and Pt side, respectively. Following the study of Hao et al. [9], $\Omega_{{\text{int,Pt}}}$ can be determined as a multiple of the oxygen transport resistance in the ionomer $\Omega_{{\text{int,Pt}}} = \zeta \times {{\delta_{{\text{N}}} } / {D_{{\text{N}}} }}$.
Finally, at the Pt surface covered by ionomer electrochemical reaction takes place with the volumetric current density jc calculated by [49].
$\begin{aligned} j_{{\text{c}}} { = 4}Fk_{{{\text{elec}}}} a_{{{\text{Pt}}}} C_{{{\text{O}}_{{2}} }}^{{{\text{Pt}}}}, \\ k_{{{\text{elec}}}} { = }\frac{1}{4F}\frac{{i_{0}^{{{\text{ref}}}} }}{{C_{{{\text{O}}_{{2}} {\text{,ref}}}} }}\exp \left( { - \frac{{E_{{\text{c}}} }}{R}\left( {\frac{1}{T} - \frac{1}{353.15}} \right)} \right) \times \left( {1 - \theta_{{{\text{PtO}}}} } \right)\exp \left( { - \frac{{\alpha_{\text{c}} F}}{RT}\eta - \frac{{\omega \theta_{{{\text{PtO}}}} }}{RT}} \right) \\ \theta_{{{\text{PtO}}}} = 1/\left( {1 + \exp \left( { - 22.4\left( {\eta - 0.818} \right)} \right)} \right) \\ \end{aligned}$
where kelec denotes the reaction rate of oxygen reduction reaction (ORR) on Pt surface.$i_{0}^{{{\text{ref}}}}$, $C_{{{\text{O}}_{{2}} {\text{,ref}}}}$, Ec, αc, ω, and F are the reference current density, the reference oxygen concentration, the activation energy of ORR, the charge transfer coefficient, the energy parameter for Temkin isotherm, and the Faraday constant, respectively. θPtO denotes the Pt-oxide coverage on Pt surface depending on the local overpotential η. Under high voltage, Pt surfaces undergo oxidation reactions, leading to the formation of PtO and reduction of the ECSA [9].
As the amount of oxygen across the pore-ionomer interface should equal that consumed at the Pt surface, the following equation should be satisfied
$a_{{\text{N}}} \frac{{C_{{{\text{O}}_{{2}} }}^{{\text{N}}} - C_{{{\text{O}}_{{2}} }}^{{{\text{N2}}}} }}{{\Omega_{{\text{local,N}}} }}{ = }a_{{{\text{Pt}}}} \frac{{C_{{{\text{O}}_{{2}} }}^{{{\text{N2}}}} - C_{{{\text{O}}_{{2}} }}^{{{\text{Pt}}}} }}{{\Omega_{{\text{int,Pt}}} }}{ = }a_{{{\text{Pt}}}} k_{{{\text{elec}}}} C_{{{\text{O}}_{{2}} }}^{{{\text{Pt}}}}$
and thus, based on Eq. (21) the volumetric oxygen consumption rate ψ can be obtained
$\psi { = }a_{{{\text{Pt}}}} k_{{{\text{elec}}}} C_{{{\text{O}}_{{2}} }}^{{{\text{Pt}}}} = \frac{{a_{{\text{N}}} }}{{\Omega_{{\text{local,N}}} + \frac{{a_{{\text{N}}} }}{{a_{{{\text{Pt}}}} }}\Omega_{{\text{int,Pt}}} + \frac{{a_{{\text{N}}} }}{{a_{{{\text{Pt}}}} }}\frac{1}{{k_{{{\text{elec}}}} }}}}\frac{RT}{{H_{{\text{N}}} }}C_{{\text{g}}} { = }\frac{{j_{{\text{c}}} }}{4F}$
It can be found that aPt can directly affect the local ψ. As shown in the denominator of Eq. (22), a lower aPt can amplify the effects of $\Omega_{{\text{int,Pt}}}$ and $k_{{{\text{elec}}}}^{ - 1}$, and reduce the local ψ and the local jc. It is worth mentioning that this model can easily consider the Pt agglomeration effects by modifying the Pt particle diameter and the aPt.
Up to now, the particle-overlapping model has been completely established, which considers the effects of contact and overlap of carbon particles, the corresponding alteration of ionomer and carbon structures and the local oxygen reactive transport processes. Here a few comments on the particle-overlapping model developed are made. First, compared with the conventional agglomerate model with agglomerate size of 100nm~1000nm and unphysical ionomer film thickness adopted to match the experimental results [46] as well as with the single-particle model which does not consider the interactions between different carbon particles [9], the particle-overlapping model developed recognizes the connection and overlap between carbon particles yet eliminates the shortcomings of the agglomerate model. Second, with the contact number k as zero, the single-particle model can be fully recovered by our particle-overlapping model which is thus more general. For example, by setting k as zero, Eq. (7) is the same as Eq. (4). In addition, the overlapping tolerance δ also can be set as zero to consider the circumstance that carbon particles loosely contact with each other. Third, our model considers the effective oxygen transport length in the ionomer film $\delta_{{\text{N}}}^{{{\text{eff}}}}$, the ionomer-Pt interfacial resistance $\Omega_{{\text{int,Pt}}}$, and the PtO coverage at Pt surface and thus the local oxygen transport process can be described more accurately.
3 Model validation
The model developed is validated at the microscale by oxygen local transport resistance, the single cell-scale by polarization curve and further the commercial-size cell scale by local current density distribution.
3.1 Validation of local transport resistance
The particle-overlapping model is validated by predicting the local transport resistance under different roughness factor fPt (the surface area of Pt particles per unit electrode area). The local transport resistance, which cannot be directly measured, is indirectly determined by the limiting current density scheme [50]. The limiting current density is the maximum current density obtained in the concentration polarization region of polarization curve, where the electrochemical reaction rate kelec is significantly high leading to the maximum $\psi_{\max }$ in Eq. (22). Thus, the limiting current density can be calculated
$I_{\lim } = 4F\psi_{\max } \delta_{{{\text{CL}}}} = 4F\frac{{a_{{\text{N}}} }}{{\Omega_{{\text{local,N}}} + \frac{{a_{{\text{N}}} }}{{a_{{{\text{Pt}}}} }}\Omega_{{\text{int,Pt}}} }}\frac{RT}{{H_{{\text{N}}} }}C_{{\text{g}}}$
Correspondingly, the oxygen transport resistance can be determined
$R_{{{\text{other}}}} { = }\frac{{C_{{\text{g}}} }}{{}^{I_{\lim }}\!\!\left/\! \right.{}_{4F}}{ = }\left( {\frac{{\delta_{{\text{N}}}^{{{\text{eff}}}} }}{{D_{{\text{N}}} }} + \zeta \frac{{a_{{\text{N}}} }}{{a_{{{\text{Pt}}}} }}\frac{{\delta_{{\text{N}}} }}{{D_{{\text{N}}} }}} \right)\frac{1}{{a_{{\text{N}}} \delta_{{{\text{CL}}}} }}\frac{{H_{{\text{N}}} }}{RT}$
In the literature, the relationship between the local transport resistance and fPt is analyzed. The definition of fPt is as [38]
$f_{{{\text{Pt}}}} = L_{{{\text{Pt}}}} A_{{{\text{Pt}}}}$
$A_{{{\text{Pt}}}} = \frac{{4\pi r_{{{\text{Pt}}}}^{2} }}{{\frac{4}{3}\pi r_{{{\text{Pt}}}}^{3} \rho_{{{\text{Pt}}}} }} = \frac{3}{{r_{{{\text{Pt}}}} \rho_{{{\text{Pt}}}} }}$
Fig. 4 shows the relationship between Rother and 1/fPt calculated by Eq. (24). The I/C, Pt loading and δ are 0.95, 0.02-0.4 mg cm-2 and 3 nm, respectively. Note that the structural parameters in the particle-overlapping model are obtained from the real CLs. In validation, I/C in this model is 0.95 which is consistent with the studies of Greszler et al. [38] and Owejan et al. [50]. Pt and carbon particle radii are 1.4 nm and 25 nm based on experimental observations [13,52]. 3 nm is adopted as a typical value of δ, which can also be estimated by experimental observations in Fig. 1(b) [12]. It can be found that Rother linearly changes with 1/fPt and the slope will increase as k increases, meaning that a higher contact number leads to higher oxygen transport resistance. Such linear relationship was also reported in experimental studies in the literature [38,39,40,53], such as the studies of Greszler et al. [38]. They further defined the slope as oxygen transport resistance on Pt surface RPt, the value of which is about 1226 s m-1. In addition, the values of RPt in the experimental studies of Sakai et al. [54], Ono et al. [53] and Owejan et al. [50] are 1987 s m-1, 1243 s m-1 and 750 s m-1, respectively. In Fig. 4, these experimental results are also plotted for comparison. It can be found that good agreement between modeling and experimental results are obtained, leading to RPt as 1200 s m-1 and 1600 s m-1 for k as 3 and 4, respectively.
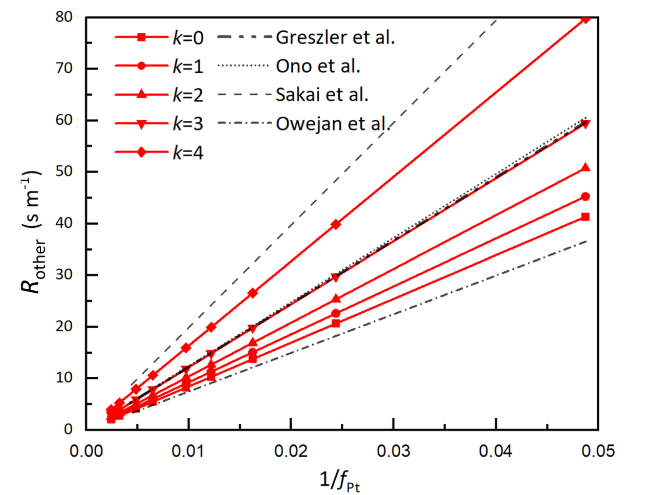
Fig. 4 Relationship between oxygen transport resistance and the reverse of Pt roughness |
3.2 Validation at the single cell-scale
To fully describe the multiple transport processes inside PEMFCs, the particle-overlapping model developed and validated above is coupled with single cell-scale models. In the single cell-scale models, the transport processes inside PEMFCs are generally described by a set of conservation equations (such as mass, momentum, energy, species concentration, potential, etc.). The coupling scheme between the two models at different scales is the same as that of the single-particle model [9]. Figure 5 is provided to clearly illustrate the coupling scheme and are introduced as follows.
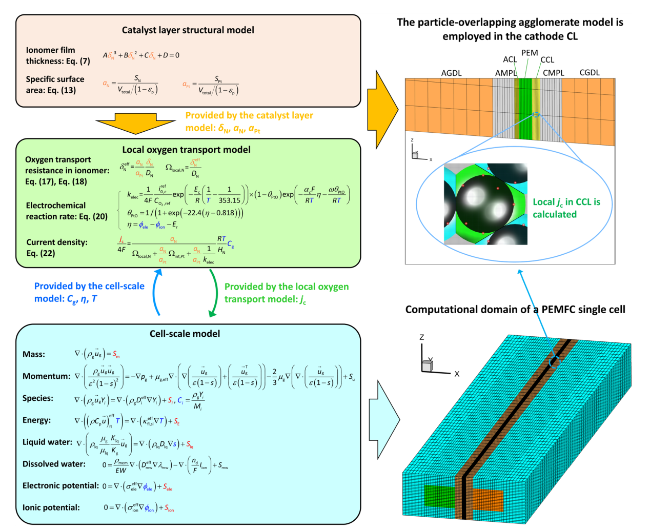
Fig. 5 Schematic of the coupling scheme between particle-overlapping model and cell-scale models |
(1) Determining δN, aN and aPt by the CL structural model developed in Section 2.2. The CL structural model is adopted to determine the ionomer film thickness δN according to Eq. (7), and to calculate the specific surface area of ionomer film aN and Pt particles aPt by Eq. (13). Note that for determining δN, aN and aPt, values of variables including k, δ, I/C, Pt loading, rc should be prescribed. Without specially mentioned, in the subsequent studies the values are as follows: k as 3, δ as 3 nm, I/C as 0.95, Pt loading as 0.1 mg cm-2 and rc as 25 nm.
(2) Calculating volumetric current density jc. Based on δN, aN and aPt determined, the effective transport length of oxygen in ionomer film $\delta_{{\text{N}}}^{{{\text{eff}}}}$ and further the oxygen transport resistance in ionomer film $\Omega_{{\text{local,N}}}$ can be determined by using Eqs. (17)- (18). Subsequently, the volumetric current density jc is calculated based on Eq. (22) which takes into account the local transport resistance in the ionomer and across the ionomer-Pt interface as described in Section 2.3.
(3) By upscaling jc, the source terms in the cell-scale model as marked in red in the conservation equations are updated. Note that the coupling between the particle-overlapping model and the cell-scale model actually are two-way, as clearly displayed in Fig. 5. On the one hand, the particle-overlapping model is employed for calculating the source terms in the cell-scale model. On the other hand, the cell-scale model also provides the particle-overlapping model with the concentration Cg, the overpotential η and the temperature T as marked blue in the cell-scale models. The two-way coupling is implemented iteratively in each time-step of the simulation until convergence is obtained.
In this study, a 3D two-phase non-non-isothermal cell-scale model is adopted, and the corresponding governing equations are displayed in Fig. 5. Details of this cell-scale model can be found in the literature [7,55,56]. Related source terms, transport properties and electrochemical parameters of this model are provided in Tables S1-S2 in Supplementary materials, and structural parameters are provided in Table 2. Figure 6 illustrates the polarization curves and power density curves obtained by the coupled model, where the experimental results are also shown for comparison [57]. The range of k as 0~4 is studied. As shown in Fig. 6, in the activation region and ohmic regions, both our model and the single-particle model (k=0) reach acceptable agreement with the experimental results. In the concentration polarization region, where the local oxygen transport processes inside the CLs play important roles, the discrepancy between different curves can be observed, demonstrating the effects of particle overlapping on the cell performance. Note that k of 0 indicates the absence of carbon particle overlap. The results reveal that neglecting carbon particle overlap will underestimate the mass transfer loss and overestimate the cell performance in the concentration polarization region. While in the activation polarization and ohmic polarization regions, the effects of carbon particle overlap are minimal, because the ECSA and the electron/proton conductivities are assumed not affected by the carbon particle overlap.
| Parameters | Value |
|---|---|
| CCL thickness | 11 μm |
| ACL thickness | 6 μm |
| PEM thickness | 18 μm |
| GDLs thickness | 160 μm |
| GC length/width/height | 10.0 mm/0.5 mm/0.7 mm |
| Land width | 0.5 mm |
| Thermal conductivity of PEM | 0.77+3.7e-3λ |
| Thermal conductivity of CL | 0.27+0.66𝑠εCL |
| Thermal conductivity of MPL | In-plane: 0.15+0.66𝑠εMPL Through-plane:3+0.66𝑠εMPL |
| Thermal conductivity of GDL | In-plane: 1.7+0.66𝑠εGDL Through-plane:21+0.66𝑠εGDL |
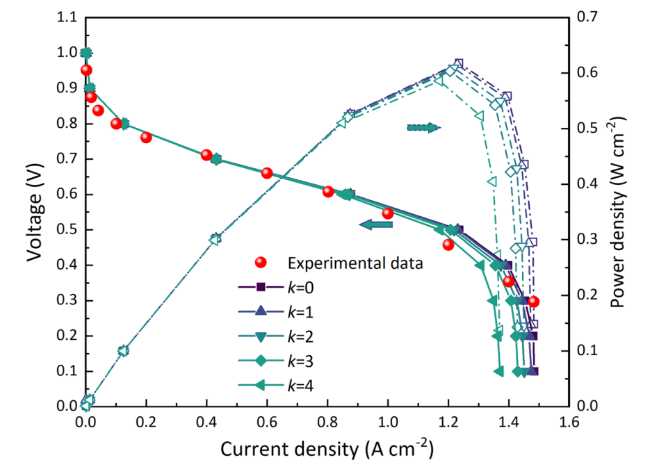
Fig. 6 Effects of carbon particle overlapping on cell performance |
To more clearly illustrate the effects on concentration polarization, the oxygen concentration in CL pores Cg, and that on Pt surface $C_{{{\text{O}}_{{2}} }}^{{{\text{Pt}}}}$ on the middle plane of the cathode CL under output voltage as 0.1 V are presented in Fig. 7(a) and (b). In Fig. 7(a), as k increases from 0 to 4, Cg increases while $C_{{{\text{O}}_{{2}} }}^{{{\text{Pt}}}}$ decreases, because a higher k means higher local transport resistance, and thus the oxygen consumption rate is lower, leading to higher Cg and lower $C_{{{\text{O}}_{{2}} }}^{{{\text{Pt}}}}$ (Fig. 7(b)). Finally, as the volumetric current density jc is highly dependent on $C_{{{\text{O}}_{{2}} }}^{{{\text{Pt}}}}$ according to Eq. (22), jc as shown in Fig. 7(c) has the same trend as $C_{{{\text{O}}_{{2}} }}^{{{\text{Pt}}}}$, which decreases as k increases.
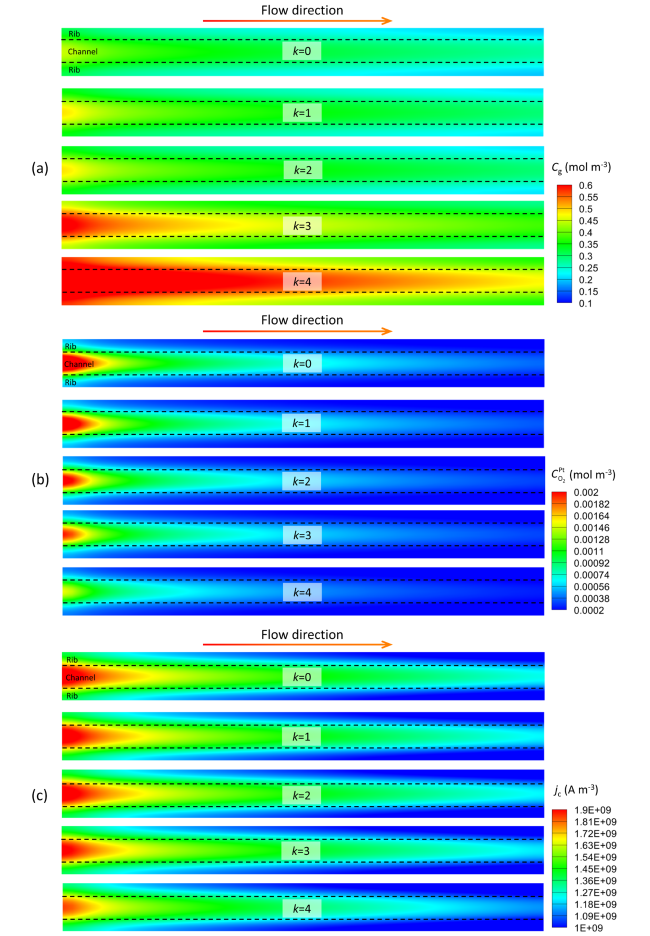
Fig. 7 Distributions of oxygen concentration and current density (0.1V). (a) Oxygen concentration in pores Cg, (b) oxygen concentration at Pt surface $C_{{{\text{O}}_{2} }}^{{{\text{Pt}}}}$ and (c) volumetric current density jc in the middle plane of the cathode CL |
3.3 Validating at the commercial-size scale
With the development of experimental techniques, more information about the electrochemical transport processes in the PEMFCs can be obtained [59,60], and thus it is possible to validate the models at multiple aspects rather than only the polarization curves. In this section, the model developed in the present study is further adopted to simulate a commercial-size PEMFC with size of 7.1×7.1 cm2 (as shown in Fig. 8(a)) previously experimentally studied by Los Alamos National Laboratory (LANL) [60]. In Ref. [60], the collector plate was divided into 10×10 segments, and the local current density in each of these 100 subregions was obtained, which can be employed to further validate the model developed.
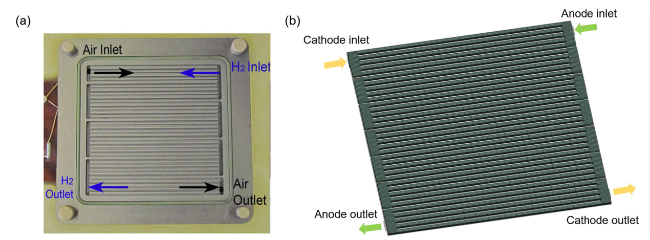
Fig. 8 A commercial-size PEMFC with size of 7.1×7.1 cm2. (a) Bipolar plate with flow field in study of Los Alamos National Laboratory [60]. (b) Computational domain in this study |
Key information for the PEMFC to be simulated is briefly introduced follows. The PEM is GORE® 710 with a thickness of 18 μm. The CL thickness is 7 μm for the anode and 12 μm for the cathode, and the correspondingly Pt loadings is 0.2 and 0.4 mg cm-2, respectively. The GDL is SGL®24BC with a total thickness of 250 μm, which includes a microporous layer (MPL) that accounts for about 20 % of the total thickness. The PEMFC is operated under back pressure of 275.84 kPa, temperature of 353.15 K, relative humidity (RH) of 25-100 % and current density of 0.1-1.2 A cm-2. Other structural parameters and operating conditions can be found in Table 3, and for more details one can refer to Ref. [60]. Figure 8(b) shows the computational domain in this simulation. The grid number is about 2.4 million which was determined after a grid-independent test in Ref. [60]. The simulation results of this study are also post-processed according to the resolution of the experimental data to obtain a coarsened result with a 10×10 grid.
Table 3 Structural parameters and operating conditions of the commercial-size PEMFC [60] |
| Parameters | Value |
|---|---|
| MEA area | 7.1×7.1 cm2 |
| CCL thickness | 12 μm |
| ACL thickness | 7 μm |
| PEM thickness | 18 μm |
| GDLs thickness | 200 μm |
| GC width/height | 1 mm/1 mm |
| Land width | 1.03 mm |
| Manifold width | 3 mm |
| Total bipolar plate thickness | 3 mm |
| Stoichiometry ratio | Anode: 1.2/Cathode: 2.0 |
| Porosity of GDL/MPL/CL | 0.6/0.4/0.4 |
| Pt loading in CCL | 0.4 mg cm-2 |
| I/C | 0.8 |
| Back pressure | 275.84 kPa |
| Relative humidity | 25%, 50%, 75%, 100% |
| Temperature | 353.15 K |
| Current density | 0.1, 0.4, 0.8, 1.0, 1.2 A cm-2 |
Figure 9(a) and (c) present the measured local current density distributions at two different output current densities (1.2 and 0.1 A cm-2) with the same RH of 50 %. It should be noted that in Ref. [60] local current density distribution under five different output current densities (0.1, 0.4, 0.8, 1.0, and 1.2 A cm-2) were studied, but only the detailed distributions under 1.2 and 0.1 A cm-2 were provided. It can be observed in Fig. 9(a) and (c) that under both high and low output current density, the regions of high local current density are mainly located in the up-middle area, with maximum local current density reaching 130 %-140 % of the output current density. In the lower region, particularly the bottom-right corner, the local current density is the lowest, approximately 50 %-60 % of the output current density. As the bottom-right corner corresponds to the cathode outlet, it can be inferred that the presence of liquid water in gas channels in this region impedes oxygen mass transfer, resulting in the lowest local current density. Figure 9(b) and (d) show the simulation results from the model. It can be found that the simulation results are in good agreement with the experimental results, with high local current density regions located in the up-middle area. Note that in the bottom-right corner, the simulation results are higher than the experimental results, which is also observed in the simulation results of Wang et al. [60] and Zhang et al. [58]. It is speculated that this discrepancy is due to the inability of the present model to accurately predict the water flooding inside the gas channel near the cathode outlet. Further coupling of gas-water two-phase sub-models inside the gas channels can potentially reduce the prediction deviation in this region.
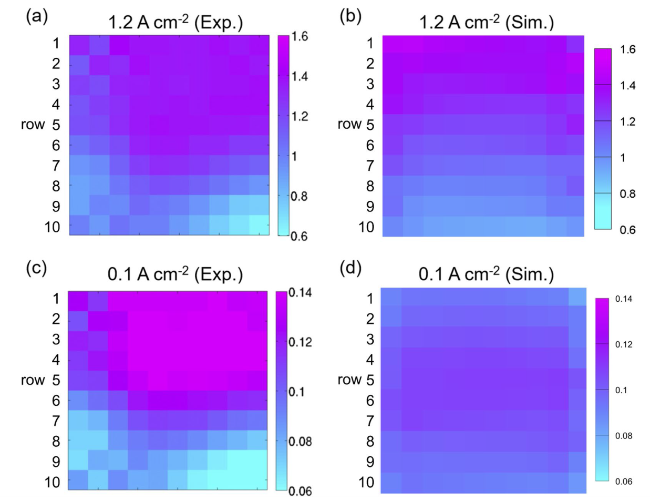
Fig. 9 Distribution of local current density under (a-b) 1.2 A cm-2, and (c-d) 0.1 A cm-2 (50% RH). The experimental results are from Ref. [60] |
Figures 10(a) and (c) further display the measured local current density distributions at two different RH (50 % and 25 %) with the same output current density as 1.0 A cm-2 [60]. Similarly, it should be noted again that in Ref. [60] four different RH (25 %, 50 %, 75 %, and 100 %) were measured but only the detailed current density distributions under 25 % and 50% RH were provided. It can be observed in Fig. 10(a) and (c) that as the RH decreases from 50 % to 25 %, the regions of high local current density shift downward from the up region (approximately rows 1-5) to the lower region (approximately rows 3-6). This is attributed to the decreased hydration capability of the incoming hydrogen and air on the ionomer at low RH conditions. The humidification of the ionomer relies on water produced from the electrochemical reactions, thus causing the high local current density to shift downward. Figures 10(b) and (d) display the predicted results from the model. It can be found that the model obtains similar results compared with the experiments, with the high local current density shifting downward.
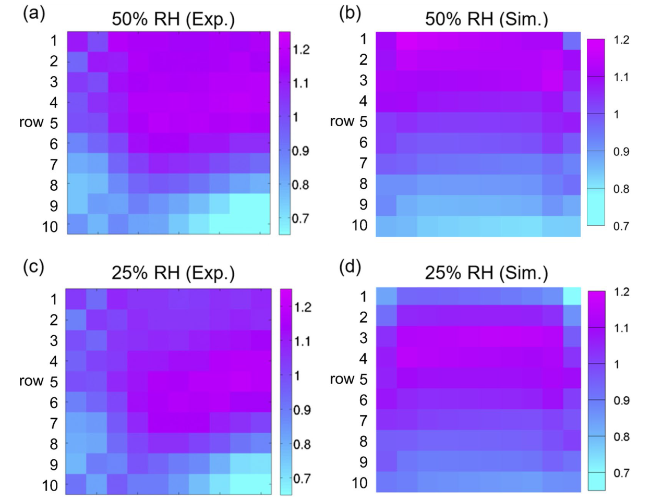
Fig. 10 Distribution of local current density under (a-b) 50% RH, and (c-d) 25% RH (1.0 A cm-2). The experimental results are from Ref. [60] |
Fig. 11 provides a quantitative comparison between the experimental and simulation results. In Fig. 11(a), the average current density of each row is plotted for different output current densities ranging from 0.1 to 1.2 A cm-2 (50 % RH). Figure 11(b) shows the relative error (RE) between the simulation and experimental results, defined as
${\text{RE = }}\frac{1}{{I_{\exp } }}\left( {I_{{{\text{sim}}}} - I_{\exp } } \right) \times 100\%$

Fig. 11 Comparison between simulation and experimental results [60]. Distribution of average current density of each row under different (a) output current density and (c) RH. (b, d) Relative error between experimental and simulation results |
It can be found that the agreement between the simulation and experimental results is acceptable. Particularly, under high output current densities of 0.8, 1.0, and 1.2 A cm-2, the maximum RE is below 15 %. This indicates the accurate description of local transport resistance by the proposed multiscale model. However, under low output current densities of 0.1 and 0.4 A cm-2, the RE increases, with the maximum RE reaching about 35 %. As discussed in Fig. 9(d), the predicted current density distribution appears to be more uniform than the experimental measurements, resulting in the deviation between the simulation and experimental results. Nevertheless, this level of deviation under low output current density is deemed acceptable [60]. Figure 11(c) and (d) illustrate the average current density of each row under different RH with the output current density as 1.0 A cm-2. It can be found that the maximum RE is below 15 %, demonstrating the high accuracy of the proposed model. It is worth mentioning that in existing literature, only a few studies have validated the simulated local current density distribution against the experimental results [58,60], because up to now perfectly predicting the local current density in the entire bipolar plate is still very challenging. Model development is an ongoing process, and in future work, our multiscale model will be further improved to achieve higher accuracy in predicting the local distribution of physical quantities.
4 Results and discussion
4.1 Effects of Pt loading
In this section, effects of Pt loading are explored. As shown in Fig. 12(a), reduction of Pt loading leads to significant deterioration of the cell performance, due to the increased local transport resistance as shown in Fig. 12(b). Note that the effect of Pt loading on the cell performance is monotonic, indicating that lower Pt loading leads to worse cell performance. This is because the CL thickness is constant in this study, and the Pt loading is reduced by loading less Pt particles on carbon surface, resulting in higher local transport resistance. Figure 13 further shows the effects of Pt loading on oxygen concentration in pores Cg in the cathode CL under 0.1 V. It can be found from Fig. 13(a) that Cg reduces with the increase of Pt loading due to higher current density and thus higher oxygen consumption rate. Figure 13(b) displays the distribution of Cg on the center section of cathode CL perpendicular to the flow direction. It can be seen that Cg under the channel is higher than that under the ribs due to longer oxygen transport length, and Cg reduces as Pt loading increases.
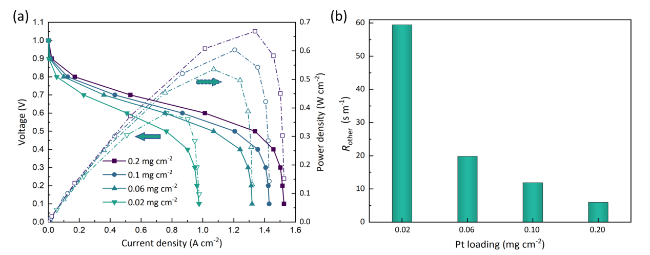
Fig. 12 Effects of Pt loading on cell performance. (a) Polarization curves and power density curves. (b) Oxygen transport resistance Rother |
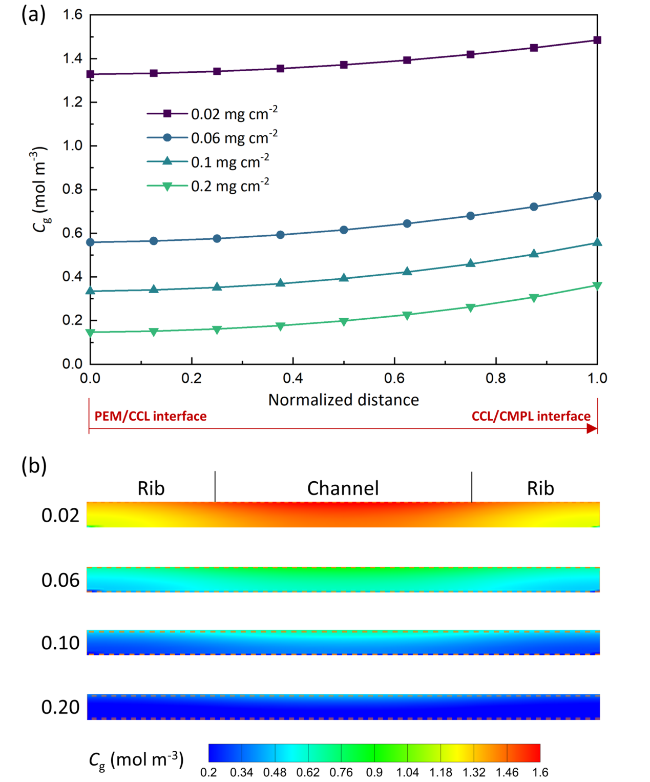
Fig. 13 Effects of Pt loading on oxygen concentration in pores Cg in the cathode CL (0.1 V). (a) Through-plane distribution of Cg. (b) Distribution of Cg on the center section of cathode CL perpendicular to the flow direction |
The Pt loading not only affects the oxygen reactive transport process but also influences the water transport within the CLs. For the CD flow and PCI flow as mentioned in the introduction part, stronger PCI flow rate can reduce the liquid water saturation. The fluxes of CD flow (JCD) and PCI flow (JPCI) can be calculated by the following equations [26]
$J_{{{\text{CD}}}} = \frac{{\rho_{{{\text{lq}}}} }}{{M_{{{\text{H}}_{{2}} {\text{O}}}} }}\frac{{K_{{{\text{lq}}}} }}{{\mu_{{{\text{lq}}}} }}\frac{{{\text{d}}P_{{\text{c}}} }}{{{\text{d}}s}}\nabla s$
$J_{{{\text{PCI}}}} = - \frac{{D_{{{\text{H}}_{{2}} {\text{O}}}} }}{R}\frac{{{\text{d}}\left( {P_{{{\text{sat}}}} /T} \right)}}{{{\text{d}}T}}\nabla T$
Fig. 14 illustrates the impact of Pt loading on the PCI and CD flows within the cathode CL under 0.1 V. As shown in Fig. 14(a) as Pt loading increases, the temperature within the cathode CL rises, due to higher current density and thus more heat generated in the CL. Figure 14(b) illustrates the temperature gradient within the cathode CL, where a positive gradient indicates temperature increase and vice versa. For high Pt loading (0.1 and 0.2 mg cm-2), the temperature gradient is positive near the PEM/CL interface, transitioning to negative value towards CL/MPL interface. This indicates that the temperature variation within the cathode CL is non-monotonic, leading to the highest temperature within the CL. As the Pt loading reduces (0.02 and 0.06 mg cm-2), it can be observed that the temperature gradient inside the entire CL remains negative. This means that the highest temperature is at the PEM/CL interface. The above different temperature variation is due to the fact that the heat generation is directly correlated to the Pt loading. At high Pt loading, the current density is relatively high, leading to huge heat generation in the cathode CL, which results in the highest temperature point inside the cathode CL. As the Pt loading reduces, both the current density and heat generation decrease, causing the highest temperature point to move towards the PEM/CL interface. The highest temperature point is critical for the distribution of temperature gradient. To the left of this point, the temperature gradient is positive, while to the right, it is negative. As Pt loading reduces, the highest temperature point moves to the left, the regions of positive and negative temperature gradient also move accordingly. Such temperature gradients lead to different PCI flow directions, as shown in Fig. 14(c). It can be found that, at high Pt loading (0.1 and 0.2 mg cm-2), the PCI flow rate near the PEM/CL interface is negative, indicating reverse flow of water vapor from the CL to the PEM driven by the negative temperature gradient. Such interesting results suggest that there exist complex thermal and water transport processes within the cathode CL.
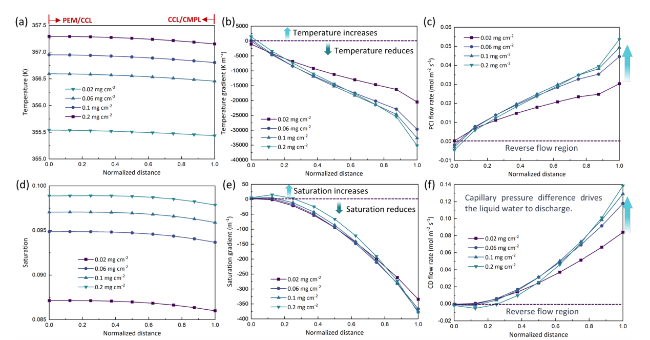
Fig. 14 Effects of Pt loading on PCI flow and CD flow in the cathode CL. Distributions of critical quantities are plotted, including (a) temperature, (b) temperature gradient, (c) PCI flow rate, (d) saturation, (e) saturation gradient, (f) CD flow rate |
Now attention is turned to the liquid water saturation and the CD flow. As shown in Fig. 14(d), an increase in Pt loading leads to higher liquid water saturation as more water is generated due to higher current density. It also can be found that the changing trend of the saturation is different. Under relatively low Pt loading of 0.02 mg cm-2 and 0.06 mg cm-2, the saturation shows a monotonic decrease from CL/PEM to CL/MPL interface. However, under relatively high Pt loading of 0.1 mg cm-2 and 0.2 mg cm-2, the saturation first increases and then decreases in the CLs, and the slightly low saturation near the CL/PEM interface is due to the local relatively high temperature which results in higher evaporation rate. Such different changing trends lead to different variations of the saturation gradient as shown in Fig. 14(e) and further the different CD flow rate in Fig. 14(f). Particularly in Fig. 14(f), under Pt loading of 0.1 mg cm-2 or 0.2 mg cm-2, the CD flow direction inside the CLs can be reverse, with most of the regions towards the CL/MPL interface while remaining regions towards the CL/PEM interface. The reverse flow of both PCI and CD near the PEM/CL interface has both positive and negative effects on the cell performance. It aids in increasing the hydration level of the PEM and the ionomer in the depths of CL at high temperature, thereby alleviating membrane drying. However, it may exacerbate cathode CL flooding and hinder the oxygen transport. Such results provide a new perspective for optimizing the cathode CL structure in the future work, namely, creating reverse PCI flow and forward CD flow within the cathode CL to simultaneously improve ionomer hydration and facilitate liquid water removal.
Furthermore, it can be observed from our simulation results that the absolute value of PCI flow rate is in the range from 0 to 0.06 mol m-2 s-1, while that of CD flow is from 0 to 0.15 mol m-2 s-1. Specifically, at the CL/MPL interface, for Pt loadings of 0.02, 0.06, 0.1, and 0.2 mg cm-2, the ratio of PCI flow to CD flow, denoted as Ts, is around 0.362, 0.378, 0.382, and 0.387, respectively, which qualitatively agrees with the studies in the literature of Xu et al. [21]. They employed a 1D PEMFC model to study PCI and CD flow rates within the PEMFC, and found that at temperature of 363.15 K and current density of about 1.25 A cm-2 with cell voltage of 0.5 V, the PCI and CD flow rates at the CL/MPL interface are around 0.045 and 0.06 mol m-2 s-1, respectively, resulting in Ts about 0.75.
4.2 Effects of I/C
Fig. 15(a) shows the polarization curves and power density curves under different I/C in cathode CL. There are opposite effects of I/C on the cell performance, due to the multiple roles played by the ionomer. On the one hand, a higher ionomer is beneficial for the proton conduction. On the other hand, too much ionomer leads to reduced porosity in the CLs, thus deteriorating the oxygen diffusion in the bulk pores. In addition, as discussed in Section 2, a higher I/C results in thicker ionomer film coated on carbon particles δN leading to higher local transport resistance. The above opposite effects clearly can be observed in Fig. 15(a)-(c). Note that the ohmic polarization region is crucial for PEMFC operation due to its lower heat generation and higher energy conversion efficiency, and thus the range of I/C is extended to 0.6-1.3 @0.6V. It can be found that the positive effect of ionomer on proton conduction is more significant in the ohmic polarization region (for example, @0.6V in Fig. 15(b)), and thus a high I/C as 1.1 is optimal for the cell performance. However, the negative effect overwhelms in the concentration polarization region (for example, @0.1V in Fig. 15(c)), where the current density decreases as I/C increases.
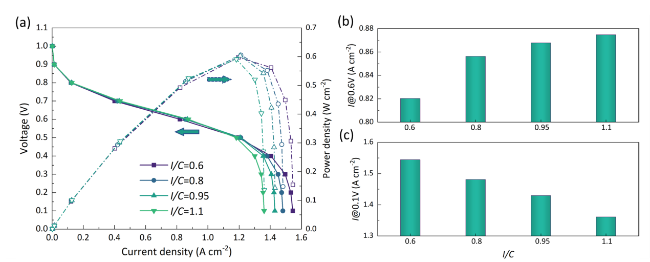
Fig. 15 Effects of I/C on cell performance. (a) Polarization curves and power density curves. (b) Current density at voltage of 0.6V. (c) Current density at voltage of 0.1V |
Fig. 16 illustrates effects of I/C on PCI and CD flows within the cathode CL under 0.1 V. As I/C decreases from 1.1 to 0.6, the current density gradually increases, leading to increased heat generation within the CL and thus higher temperature (Fig. 16(a)), which further results in overall higher temperature gradients (Fig. 16(b)) and an increase of PCI flow rate (Fig. 16(c)). It is worth mentioning that at 0.1 V, as I/C decreases from 0.95 to 0.6, the current density and heat generation rate significantly increase, resulting in higher positive temperature gradient near the PEM/CL interface and increase of PCI reverse flow rate, similar to that in Section 4.1. This is because the highest temperature point inside the cathode CL serves as the critical point for the direction of the PCI flow. To the left of the highest temperature point, the PCI flow is reverse, while to the right of the highest temperature point, the PCI flow is forward. As the I/C reduces, the highest temperature point gradually moves from the PEM/CL side towards the right side, leading to increased PCI reverse flow rate. It can be observed that reducing I/C to 0.6 will lead to even higher PCI reverse rate (over 145% improvement at the CL/MPL interface) than increasing the Pt loading to 0.2 mg cm-2, indicating that optimizing the cathode CL structure can increase current density and improve the cell performance, while it may also lead to highly complex water and thermal transport processes within the CLs (e.g, with I/C as 0.6, about 30% of the cathode CL near the PEM/CL interface occurs reverse CD flow). This is of great significance and deserves future research for enhancing thermal and water management inside PEMFCs.
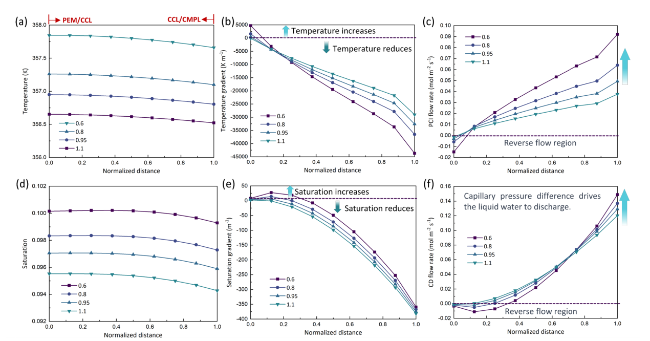
Fig. 16 Effects of I/C on PCI flow and CD flow in the cathode CL. Distributions of critical quantities are plotted, including (a) temperature, (b) temperature gradient, (c) PCI flow rate, (d) saturation, (e) saturation gradient, (f) CD flow rate |
Due to the increased water production rate within the CL, the saturation level rises (Fig. 16(d)). As shown in Fig. 16(e)-(f), the case with I/C as 0.6 generates largest backflow region (normalized distance less than approximately 0.4). This is attributed to the highest CL temperature for I/C as 0.6, which accelerates the evaporation rate of liquid water near the CL/PEM interface. The above result indicates that reducing I/C in the high current density region not only enhances oxygen transport but also strengthens the heat pipe effect, causing more liquid water to evaporate and be expelled in the vapor form, which is beneficial for the water and thermal management of PEMFCs.
4.3 Effects of ionomer partial coverage
Most of the previous studies assume that the ionomer uniformly covers the surface of carbon particles [6,9,61]. However, due to the difference of adsorption force caused by the morphology defect on carbon surface, the ionomer may only partially cover the carbon particles [28,62]. Adopting experimental techniques to observe the nanoscale ionomer distribution in the catalyst layer is still quite challenging. For the first time, Haro et al. [12] employed HAADF-STEM technology to resolve the ionomer distribution on the carbon particle surface. The results indicate that with I/C as 0.2, the coverage of ionomer on the carbon surface is 49.9%. With I/C increased to 0.5, the ionomer coverage rises to 79.5%. The structural reconstruction work of Inoue et al. [28] found that the ionomer film only covers 87 % of the carbon particle surface under I/C as 0.32. In this section, such partial converge of ionomer is considered by assuming that only a certain percentage of carbon particles, denoted as ωc, are covered with ionomer film, while the remaining carbon particles are free of ionomer. Therefore, under the same I/C in the entire CL, for carbon particles covered with ionomer, the local I/C will increase
${I / C}_{{{\text{local}}}} { = }\frac{{{I / C}}}{{\omega_{{\text{c}}} }}$
The local I/C should be substituted into Eqs. (7)- (8) to calculate the local structural variables. Then, the local jc, local corresponding to carbon particles covered by ionomer film can be obtained, which then is upscaled into the cell-scale model as follows
$j_{{\text{c}}} { = }\omega_{{\text{c}}} j_{{\text{c,local}}}$
Fig. 17(a) shows the effects of ionomer coverage on the cell performance. It can be observed that the ionomer coverage plays significant roles on the cell performance especially in the concentration polarization region. A lower coverage ratio will increase the local ionomer film thickness and thus effective oxygen transport length. It will also reduce the ECSA as Pt particles will not be fully covered by the ionomer. It can be found in Fig. 17(b)-(c) that by reducing the ionomer coverage by 30 %, the effective transport length increases from 23.4 nm to 32.5 nm by 39 %, while the oxygen transport resistance shows a considerable rise from 11.9 s m-1 to 28.8 s m-1 by 142 %.
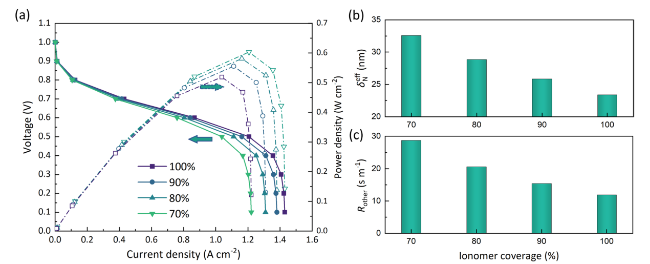
Fig. 17 Effects of ionomer coverage on cell performance. (a) Polarization curves and power density curves. (b) Effective oxygen transport length $\delta_{\mathrm N}^{\mathrm{eff}}$. (c) Oxygen transport resistance Rother |
Fig. 18 illustrates the effects of ionomer coverage on PCI and CD flows within the cathode CL under 0.1 V. It can be observed that the impact of ionomer coverage on current density is not as significant as Pt loading and I/C, thus leading to less pronounced effects on PCI and CD flow rates. Specifically, it is noteworthy that with reduced ionomer coverage, there exists nearly no reverse flow region within the CL, indicating that the heat pipe effect is weakened.
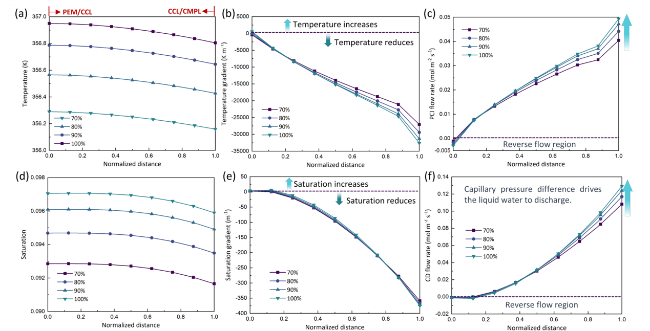
Fig. 18 Effects of ionomer coverage on PCI flow and CD flow in the cathode CL. Distributions of critical quantities are plotted, including (a) temperature, (b) temperature gradient, (c) PCI flow rate, (d) saturation, (e) saturation gradient, (f) CD flow rate |
4.4 Effects of carbon particle radius
Effects of the carbon particle radius ranging from 10 to 100 nm on the cell performance are investigated by the coupled model. It can be found from Fig. 19 that there exists an optimal carbon particle radius that leads to the highest current density and the best cell performance, which is 25 nm in the present study. To understand such results, the local transport resistance is further plotted, which is also the lowest for carbon particle radius as 25 nm. On the one hand, as the carbon particle radius reduces, the specific surface area will increase, leading to higher specific surface area of the carbon as well as the ionomer phase, as shown in Fig. 19(b). However, as the carbon radius further reduces, the effects of contact and overlap becomes remarkable, squeezing the space between carbon particles and resulting in a lower specific surface area of the ionomer as shown in Fig. 19(b). The lower ionomer specific surface area undoubtedly leads to higher local transport resistance shown in Fig. 19(c). The above discussions are also schematically illustrated in Fig. 19(d), indicating that with considering the carbon particle overlap the carbon particle size should not be too small. It is worth mentioning that the optimal radius of 25nm in the present study is consistent with the general size of commercial Pt/C catalysts such as Vulcan and Ketjenblack [13,63]. However, in the single-particle model proposed in Ref. [9], which is also illustrated in Fig. 19(d), the carbon particle radius rc under a constant given I/C has monotonous effects on local structural parameters and thus oxygen transport resistance [56], which may fail to capture the effects of carbon particle radius on local transport processes.
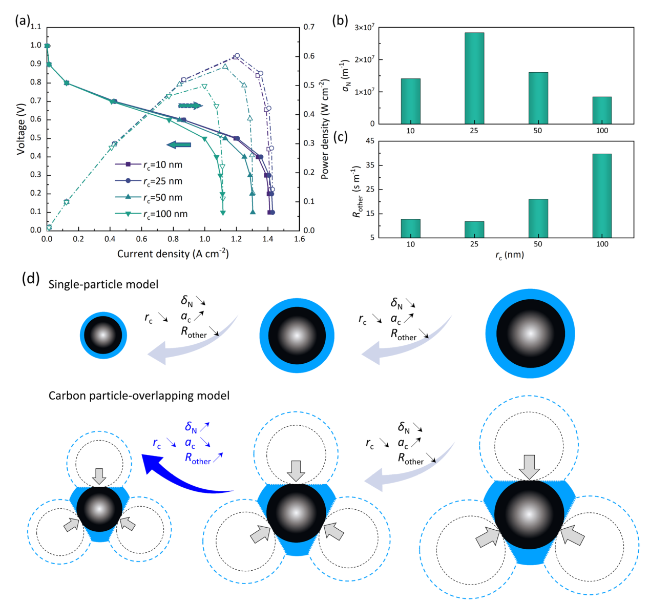
Fig. 19 Effects of carbon particle radius on cell performance. (a) Polarization curves and power density curves. (b) Specific surface area of ionomer aN. (c) Oxygen transport resistance Rother. (d) Schematic of variation of structural parameters and ionomer distribution in the single-particle model and the particle-overlapping model |
Figure 20 illustrates the effects of carbon particle radius on the PCI and CD flows within the cathode CL under 0.1 V. It can be observed that at the optimal carbon particle radius of 25 nm, the temperature within the CL is the highest, resulting in the largest temperature gradient and the highest PCI flow rate. Consequently, the reverse flow region within the CL is the largest, and the liquid water flux at the CL/MPL interface is also the highest. From Figs. 14, 16, 18, and 20, it is evident that Pt loading and I/C have the most significant impact on the PCI and CD flow rates. Increasing Pt loading and optimizing I/C can strengthen the heat pipe effect within the CLs, which is beneficial for optimizing the water and thermal management of PEMFCs.
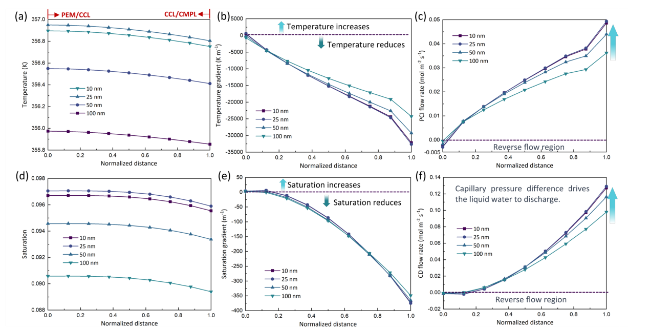
Fig. 20 Effects of carbon particle radius on PCI flow and CD flow in the cathode CL. Distributions of critical quantities are plotted, including (a) temperature, (b) temperature gradient, (c) PCI flow rate, (d) saturation, (e) saturation gradient, (f) CD flow rate |
5 Conclusions
Deep understanding of the complicated interplay between nanoscale CL structures and the multiple physicochemical processes is vital for improving the cell performance. In this study, a carbon particle-overlapping model is proposed, which provides more accurate description of the distinct local CL structures around the reactive sites, including contact and overlap between different carbon particles, the ionomer film covered on the carbon surface, and dispersion of Pt particles loaded on the carbon particles. The particle-overlapping model, improved from the existing agglomerate model, is very promising to become the next-generation CL model. The model further comprehensively involves the local oxygen reactive transport processes, including dissolution at the pore-ionomer interface, diffusion inside the ionomer, interfacial resistance at the ionomer-Pt surface, and electrochemical reactions at the Pt surface. The model is validated by predicting the relationship between local transport resistance and the roughness factor. The particle-overlapping model is then coupled with a 3D, non-isothermal, and multiphase cell-scale model, and the coupled model established is validated by comparing the polarization curves and local current density with experimental results. PCI flow and CD flow are also analyzed to provide a clearer understanding of the transport processes of liquid water within the CLs. Then, the coupled model is employed to study effects of Pt loading, I/C, ionomer coverage and carbon particle radius on the cell performance. The main conclusions are as follows.
1. The particle-overlapping model successfully describes the CL local structure and local transport resistance. As k and δ increase, the ionomer thickness increases, the specific surface area of ionomer and that of the carbon particle decreases. For the typical k as 3 and δ as 3 nm in CLs, the ionomer film thickness can be 1.46 times higher than and the specific surface area of ionomer 1.72 times lower than the values predicted by the state-of-art single particle model. Such structural alternation leads to higher oxygen effective transport length and the local transport resistance. It is found that as Pt loading reduces from 0.4 mg cm-2 to 0.02 mg cm-2, the particle overlapping lead to higher local transport resistance and the slop of relationship between local transport resistance and roughness factor as high as 800 s m-1~1600 s m-1.
2. The coupled model integrating the particle-overlapping model and the cell-scale model successfully predicted the cell performance and the local current density distribution. The results show that as k increases, the oxygen concentration at the reactive sites decreases, leading to reduced current density. The local current density distribution of a commercial-size PEMFC, as predicted by the proposed model, exhibits good agreement with experimental results. Quantitative comparisons are performed to evaluate the distribution of local current density at different output current density. Under the range of 0.8-1.2 A cm-2, the maximum RE between the simulation and experimental results is below 15 %. For the range of 0.1-0.4 A cm-2, the maximum RE reaches about 35 %. Additionally, comparisons are conducted for the distribution of local current density at different RH, with the maximum RE below 15 %. The present model accurately considers the effect of operating conditions on local current density, demonstrating the capability of the model developed. In future study, the coupled model with high prediction accuracy can also be applied to predict and optimize the cell performance of large commercial-scale PEMFCs.
3. Adopting the coupled model, effects of Pt loading, I/C, ionomer coverage ratio and the carbon particle radius are explored. It is found that a small reduction of the ionomer coverage leads to remarkable increase of local ionomer film thickness and the transport resistance. It is also found that there exists an optimum carbon particle radius of about 25 nm, as too large carbon particle leads to low ionomer specific surface area, while too small carbon particle results in limited space between carbon particles and thus low ionomer specific surface area as well.
4. The PCI flow and CD flow within the cathode CL are explored. The results indicate that at high current density, there exists negative temperature gradient and liquid water saturation gradient near the PEM/CL interface, leading to the reverse flow of PCI and CD. Such results provide a new perspective for optimizing the cathode CL structure in the future work, enhancing reverse PCI flow and forward CD flow within the cathode CL to improve ionomer hydration and facilitate liquid water removal. It is demonstrated that a profound understanding of these complex processes is crucial for improving cell performance, reducing costs, and promoting commercialization applications of PEMFCs.
Abbreviations
a :$\ \ \ \ \ \ \ \ $ Specific surface area [m-1]
C :$\ \ \ \ \ \ \ \ $ Concentration [mol m-3]
CD:$\ \ \ \ \ \ \ \ $ Capillary-driven
CL:$\ \ \ \ \ \ \ \ $ Catalyst layer
D :$\ \ \ \ \ \ \ \ $ Diffusivity [m2 s-1]
E c :$\ \ \ \ \ \ \ \ $ Activation energy in oxygen reduction reaction [kJ mol-1]
ECSA:$\ \ \ \ \ \ \ \ $ Electrochemical surface area [m2 g-1]
F :$\ \ \ \ \ \ \ \ $ Faraday’s constant [C mol-1]
f Pt :$\ \ \ \ \ \ \ \ $ Pt roughness
GC:$\ \ \ \ \ \ \ \ $ Gas channel
GDL:$\ \ \ \ \ \ \ \ $ Gas diffusion layer
H N :$\ \ \ \ \ \ \ \ $ Henry’s constant [Pa m3 mol-1]
I/C :$\ \ \ \ \ \ \ \ $ Weight ratio of ionomer to carbon
I lim :$\ \ \ \ \ \ \ \ $ Limiting current density [A m-2]
j c :$\ \ \ \ \ \ \ \ $ Volumetric current density [A m-3]
k elec :$\ \ \ \ \ \ \ \ $ Reaction rate constant [m s-1]
M :$\ \ \ \ \ \ \ \ $ Molecular weight [g mol-1]
MPL:$\ \ \ \ \ \ \ \ $ Microporous layer
N :$\ \ \ \ \ \ \ \ $ Flux [mol m-2 s-1]
PCI:$\ \ \ \ \ \ \ \ $ Phase-change-induced
PEMFC:$\ \ \ \ \ \ \ \ $ Proton exchange membrane fuel cell
P t/C :$\ \ \ \ \ \ \ \ $ Weight ratio of Pt to Pt/C catalyst
R other : $\ \ \ \ \ \ \ \ $Oxygen transport resistance [s m-1]
r :$\ \ \ \ \ \ \ \ $ Radius [m]
T :$\ \ \ \ \ \ \ \ $ Temperature [K]
V :$\ \ \ \ \ \ \ \ $ Volume [m3]
x/y/z :$\ \ \ \ \ \ \ \ $ Coordinates
α c :$\ \ \ \ \ \ \ \ $ Charge transfer coefficient
γ :$\ \ \ \ \ \ \ \ $ Water phase change rate [s-1]
δ :$\ \ \ \ \ \ \ \ $ Carbon particle overlap tolerance [m]
δ N :$\ \ \ \ \ \ \ \ $ Ionomer film thickness [m]
ε :$\ \ \ \ \ \ \ \ $ Porosity
ζ :$\ \ \ \ \ \ \ \ $ Ionomer-Pt interfacial coefficient
η :$\ \ \ \ \ \ \ \ $ Overpotential [V]
θ PtO :$\ \ \ \ \ \ \ \ $ Pt-oxide coverage
ρ :$\ \ \ \ \ \ \ \ $ Density [kg m-3]
${{\psi}}$ :$\ \ \ \ \ \ \ \ $ Reaction rate [mol m-3 s-1]
ω :$\ \ \ \ \ \ \ \ $ Energy parameter for the Temkin isotherm [kJ mol-1]
Subscripts
act$\ \ \ \ \ \ \ \ $ Active
elec$\ \ \ \ \ \ \ \ $ Electrochemical reaction
g$\ \ \ \ \ \ \ \ $ Gas in pores
int$\ \ \ \ \ \ \ \ $ interfacial
ion$\ \ \ \ \ \ \ \ $ Ionomer
N$\ \ \ \ \ \ \ \ $ Nafion
O2 $\ \ \ \ \ \ \ \ $ Oxygen
Pt$\ \ \ \ \ \ \ \ $ Platinum
ref$\ \ \ \ \ \ \ \ $ Reference value
Supplementary Information
The online version contains supplementary material available at https://doi.org/10.1007/s43979-024-00089-5.
Acknowledgements
The authors thank the support of National Key Research and Development Program (2021YFB4001701), National Nature Science Foundation of China (52376074) and the Fundamental Research Funds for the Central Universities.
Authors’ contributions
All authors contributed to the study conception and design. RYZ: Conceptualization, Methodology, Investigation, Writing original draft. LC: Conceptualization, Methodology, Validation, Supervision, Writing-review and editing, Project administration. TM: Conceptualization, Methodology. YTM: Conceptualization, Resources. LH: Conceptualization, Resources, Methodology, Validation. WQT: Conceptualization, Methodology, Supervision.
Funding
This work was supported by the National Key Research and Development Program (2021YFB4001701), National Nature Science Foundation of China (52376074) and the Fundamental Research Funds for the Central Universities.
Availability of data and materials
The datasets used and analyzed during the current study are available from the corresponding author on reasonable request.
Declarations
Ethics approval and consent to participate
Not applicable.
Consent for publication
All authors agree to the publication of this manuscript.
Competing interests
The authors declare that they have no known competing financial interests or personal relationships that could have appeared to influence the work reported in this paper. Professor Wen-Quan Tao is an Editorial Advisory Board Member of Carbon Neutrality and was not involved in the editorial review, or the decision to publish this article.
Publisher’s Note
Springer Nature remains neutral with regard to jurisdictional claims in published maps and institutional affiliations.
