
1 Introduction
The IPCC category represents emissions associated with the burning of fossil fuels [20], making it the largest source of greenhouse gas emissions in the whole world [21]. The issue of CO2 emission is a critical concern for many regions, including New York State. The role of fossil fuels in contributing to carbon emissions is well-documented and requires strategic solutions to address. This includes fuels combusted for electricity, transportation, and heating in residential, commercial, and industrial buildings. It is evident that reducing these emissions is imperative for the state. New York State took significant action in response to the latest climate science by enacting the Climate Leadership and Community Protection Act (CLCPA) during the 2019 legislative session. The CLCPA sets some of the most ambitious climate targets in the United States. By 2030, the state aims to achieve a 40% reduction in greenhouse gas (GHG) emissions below 1990 [30].
In order to analyze and accurately predict the future trajectory of emissions, machine learning algorithms were applied to examine historical data. This study validated four machine learning algorithms with historical data from 1990-2020. After evaluation of the result, it was found that the ELM algorithm showed the most accurate results with the smallest MAPE, making it the ideal choice for forecasting carbon emissions until 2050.
The study also explored three pathways in alignment with the goals of the CLCPA for New York State. These pathways were designed to scrutinize the potential impact of different policies on carbon emissions in 2030 and 2050. The forecast trajectory was compared with the most recent values of CO2 emission in 2021, revealing small deviations in the commercial, industrial, and electric power sectors, and underestimations in residential, transportation, and total state carbon emissions. Previous studies have noted a decrease in carbon emissions for 2019 and 2020, assuming the trend will continue to decline. However, the analysis in this article indicates an increase in emissions in 2021, emphasizing the need to adopt a number of proposed policies for each pathway in order to achieve neutrality. Overall, the findings from this research highlight the importance of implementing effective strategies to combat carbon emissions in NYS. With the use of machine learning [18] and detailed analysis of historical data [14], it is possible to make informed predictions and work towards a more sustainable future for the state.
One of the primary challenges faced was the need to make accurate percentage settings for carbon emissions in 2030 and 2050 for different economic sectors in accordance with the state's future plans for carbon reduction. Another issue encountered was the selection of a simple and effective forecasting method [33] that would be suitable for the study's focus on carbon emissions as the single variable of interest. Was carefully evaluate and compared various forecasting algorithms, including ELM, SVM, SVM-ELM, and GM optimized with SVM-ELM, to determine the most suitable approach for the study. Additionally, the big problem faced was the impact of the pandemic on different economic sectors. As the study aimed to understand the effect of the pandemic on carbon emissions, the analysis of emissions from 1990-2020 revealed a decreasing trend in the forecast model for 2050. Upon further examination, it was observed that while some sectors showed small deviations with actual values in 2021 compared to the scenario-based forecast, other sectors exhibited larger underestimations, particularly those that had seen a significant uptrend in 2021. This discrepancy in the forecasted values poses a challenge for researchers in developing effective strategies and policies to reduce carbon emissions. This study will present comprehensive plans for the development of policies and measures tailored to each sector of the economy.
The research roadmap Fig. 1 outlines the comprehensive approach taken to analyze state-wide CO2emissions in New York State:
● The first step involves collecting data on CO2 emissions from various sectors, including electric power, residential, commercial, industrial, and transportation. The data is then analyzed by fuel categories, such as natural gas, coal, and petroleum. Additionally, an investigation into existing policies and initiatives in New York State to achieve carbon neutrality is conducted, along with an examination of different scenarios and targets outlined in these policies for reducing CO2 emissions [15].
● The second step involves data analysis. Four different machine-learning models were chosen for validation in order to forecast fossil fuel combustion emissions. These models are then trained and tested using historical CO2 emissions data from 1990 to 2020. Key metrics such as Mean Absolute Error (MAE), Mean Squared Error (MSE), and Mean Absolute Percentage Error (MAPE) are calculated to assess the accuracy of each forecasting model, and the most accurate model is selected.
● The third step is Scenario-based prediction, which outlines three prediction scenarios for carbon emission reduction pathways in New York State. These scenarios are based on the city's goal of achieving carbon neutrality and are essential for informing policies and energy development plans. The chosen forecasting model has been employed to predict CO2 emissions for the period of 2020-2050.
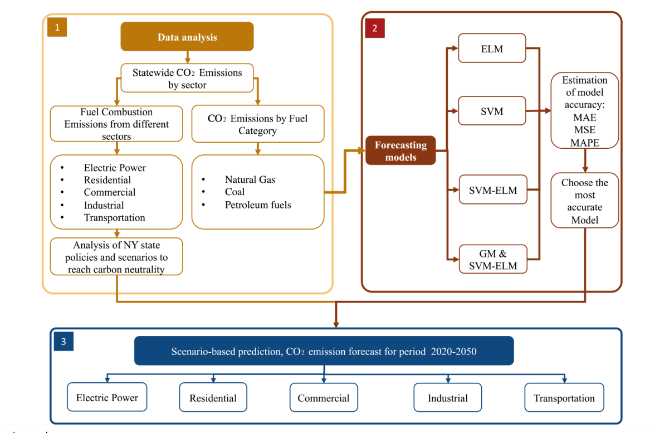
Fig. 1 Research roadmap |
2 Literature review
2.1 Literature on Carbon emission studies and reports
The issue of carbon emissions and its impact on the environment has garnered significant attention in recent years. With the growing concerns about climate change, many researchers and organizations have been focusing on analyzing carbon emissions and exploring ways to mitigate its effects. The study by Dietz and Rosa (1997), they developed a stochastic version of the IPAT model to estimate the effects of population, affluence, and technology on national CO2 emissions [8]. Their results suggest that there are diseconomies of scale for the largest nations and that the effects of affluence on CO2 emissions reach a maximum at about \$10,000 in per-capita gross domestic product. These findings highlight the complex interplay of socio-economic factors in influencing carbon emissions. The study conducted by Zhao and Yu in 2013 were able to identify key influences on carbon emissions, including industrial production, energy consumption, and transportation [48]. Charfeddine and Kahia (2019) [2] utilized the panel vector autoregressive (PVAR) model to examine the impact of renewable energy consumption and financial development on carbon dioxide (CO2) emissions and economic growth in the MENA region. Their Inglesi-Lotz [19] analysis suggested that both renewable energy consumption and financial development have a slight influence on CO2 emissions and economic growth, highlighting the need for stronger policies to improve environmental quality and economic growth in the region. Another study by Keerthana et al. (2023) focused on the United States' energy consumption and carbon dioxide emissions, providing a comprehensive forecast using a regression model. The study emphasized the significance of energy consumption and its link to carbon dioxide emissions. It also highlighted the challenges and potential approaches for reducing emissions and developing improved greenhouse gas mitigations for the country [22]. Ren and Long (2021) examined carbon emission forecasting and scenario analysis in Guangdong Province, China, utilizing a Fast Learning Network (FLN) forecasting algorithm improved by Chicken Swarm Optimization (CSO). Their study provided insights into the potential for achieving carbon emission peak and carbon neutrality in the province, offering scenarios and countermeasures to reduce emissions [33].
The New York State Climate Action Council's Scoping Plan [29], published in 2022, outlines sector-specific and economywide actions necessary to achieve the Climate Act's ambitious goals and requirements. The plan is driven by the urgent need to address climate mitigation, justice, economic opportunity, and long-term job growth for New Yorkers. Developed through a comprehensive, science-based integration analysis of advisory panel recommendations, the Scoping Plan is founded on the principles of energy system reliability, cost-effectiveness, and the welfare, safety, and prosperity of New Yorkers. The plan's recommended actions aim to meet the Climate Act's requirements across various economic sectors, including transportation, buildings, electricity, industry, agriculture, forestry, and waste. Through rigorous analysis, the plan seeks to ensure that the strategies put forth are both effective and achievable, considering the complexities and challenges of reducing greenhouse gas emissions in each sector. As New York moves forward with its climate action strategy, the Scoping Plan provides a clear roadmap to navigate the intricate landscape of climate policy and sets the stage for meaningful progress towards a sustainable future. In support of these efforts, the New York State Energy Research and Development Authority (NYSERDA) published a report in 2023 on energy sector greenhouse gas emissions under the Climate Act [30]. This report, prepared by the Eastern Research Group Inc, provides valuable insights into the trends and dynamics of greenhouse gas emissions within New York's energy sector between 1990 and 2021. The data and analysis presented in the report offer a critical foundation for understanding the state's progress in addressing climate change and inform future actions to achieve the Climate Act's targets. As New York continues its journey towards a cleaner, more sustainable energy future [6], this report serves as an essential tool for policymakers, researchers, and stakeholders to make informed decisions and drive meaningful change.
2.2 Literature on machine learning algorithms
The literature on machine learning algorithms is extensive and diverse, with multiple methodologies and approaches for estimating empirical models from data [28]. Cherkassky and Mulier (2007) highlight the emergence of various methodologies from classical statistics, engineering, signal processing, and computer science, among others. They emphasize the need for a clear understanding of fundamental issues involved in learning algorithms [3]. Alternatively, Huang, Zhu, and Siew (2006) [17] propose the Extreme Learning Machine (ELM) as a fast learning algorithm for single-hidden layer feedforward neural networks. They demonstrate its generalization performance and fast learning speed compared to conventional algorithms. Olatunji [32] (2017) compares ELM and Support Vector Machines (SVM) on the problem of email spam detection, finding that SVM outperforms ELM in accuracy but lags in speed. The research of Huang and colleagues (2015) discusses ELM as a unified learning solution for feature learning, clustering, regression, and classification applications. They highlight the independence of hidden neurons from training samples as a key feature of ELM [16]. The review by Chorowski, Wang, and Zurada (2014) compares SVM and ELM-based classifiers, demonstrating similar performance across various datasets but varying computational resource requirements [4]. Zeng, Zhou, and Zhang (2017) forecast the total energy consumption of China's manufacturing using the Homologous Grey Prediction Model, showcasing its improved performance over traditional Grey Models. They also emphasize the importance of optimizing manufacturing structures and promoting energy-saving technologies [46]. Similarly with study of Zhang et al. (2017) [47]. In the context of environmental protection, Additionally, Li et al. (2018) utilized the grey prediction theory and SVM-ELM algorithm to forecast carbon emissions related to energy consumption in the Beijing-Tianjin-Hebei region, showing the effectiveness of these methods in addressing sustainability challenges [25]. Collectively, these studies underscore the significance of machine learning algorithms in addressing complex challenges related to carbon emissions, energy consumption, and environmental sustainability. Ko et al. (2021) [23] developed a machine learning-based sketch planning model for predicting mobile emissions, highlighting the diverse applications of these algorithms in transportation and urban planning.
3 Methodology and data collection
3.1 Data collection
To effectively analyze Fuel Combustion Emissions for different economic sectors and Fuel Combustion Emissions by Fuel Category for the period from 1990 to 2020 in New York State [1], the following pre-processing and sorting steps was implemented:
Data Collection: Obtain comprehensive datasets from reputable sources such as the New York State Department of Environmental Conservation, the U.S. Environmental Protection Agency, and other relevant governmental agencies. These datasets should encompass detailed information on fuel consumption, emissions, and economic sector data.
● Data Cleaning: Clean the datasets to ensure accuracy and consistency. This involves checking for missing or incomplete data, removing duplicates, and rectifying any inconsistencies in the data [44].
● Segmentation by Economic Sectors: Categorize the emissions data based on economic sectors such as electric power, industrial, commercial, residential, and transportation sectors.
● Fuel Category Classification: Classify the fuel data into categories such as coal, natural gas, and petroleum.
● Temporal Segmentation: Organize the data chronologically to analyze emissions trends over the period from 1990 to 2020 [31].
● Standardization and Consolidation: Normalize the data if necessary to adjust for any variations in the scale of emissions across different sectors and fuel categories [39]. Aggregate the emissions data based on the economic sectors and fuel types for a comprehensive overview of emissions trends.
When it comes to analyzing CO2 emissions in New York State, there are several common sources of data that are frequently used by researchers and policymakers. One of the primary sources of data is the NYSERDA [30] which collects and analyzes data related to energy consumption and emissions within the state. The United States Energy Information Administration (EIA) is another important source of data for analyzing CO2 emissions in New York State. The EIA provides comprehensive data on energy production, consumption, and emissions at both the state and national levels, allowing for comparisons and trend analysis [40,41,42,43].
Finally, the Environmental Protection Agency (EPA) also offers valuable data and resources for studying CO2 emissions in New York State. The EPA collects data on greenhouse gas emissions from various sources, including industrial facilities, transportation, and energy production, making it a crucial source for understanding the sources and trends of CO2 emissions [10,11,12].
3.2 Description of the implementation of the four algorithms and the hyperparameters used
In order to forecast CO2 emissions, four different algorithms were implemented and tested: Extreme Learning Machines (ELM), Support Vector Machines (SVM), SVM-ELM, and the grey prediction model optimized with SVM-ELM. The implementation involved preparing the data, normalizing the input, setting the parameters for the models, generating random input weights and biases, computing hidden layer output matrices, training the regression models, and predicting the output for the training and testing data.
The choice of these methods was based on their ability to handle non-linear data and their effectiveness in regression tasks. ELM and SVM are well-known for their capability to handle complex, non-linear relationships, making them suitable for forecasting CO2 emissions. The SVM-ELM hybrid model was chosen to leverage the strengths of both algorithms and maximize performance. Additionally, the grey model optimized with SVM-ELM was included to incorporate a different approach to forecasting based on historical data patterns. The hyperparameters used for each model were based on prior research and experimentation to optimize their performance in accurately forecasting CO2 emissions. Overall, the combination of these algorithms provided a comprehensive approach to forecasting CO2 emissions and allowed for comparison and evaluation of their effectiveness in handling the given dataset.
3.2.1 Basic methodology of extreme learning machine algorithm
ELM is a machine learning algorithm that involves a three-layered neural network structure. The first layer is the input layer, which receives the input data. The second layer, called the hidden layer, contains a randomly initialized set of neurons that are summed together with the input data to produce a set of hidden layer outputs. The outputs of the hidden layer are then connected to the third layer, the output layer. The output layer has the final classification or prediction based on the weighted sum of the hidden layer outputs. The training of an ELM network involves randomly selecting the weights that connect the input layer to the hidden layer and then solving a set of linear equations to calculate the weights that connect the hidden layer to the output layer. Further details of this calculation can be found in [17,32] (Fig. 2).
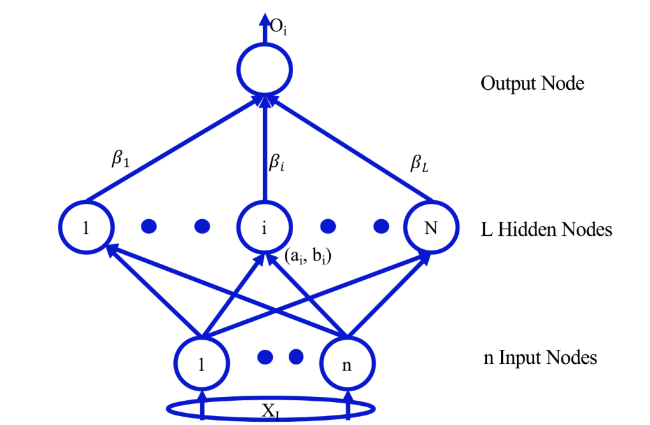
Fig. 2 The topological structure of the ELM algorithm |
ELM doesn’t require gradient-based backpropagation to work. It uses the Moore-Penrose generalized inverse to set its weights.
$\sum_{i=1}^{L}{\beta}_{i}f\left({\omega }_{i}*{x}_{j}+{b}_{i}\right)={O}_{j},j=1,\dots,N$
Where: f is the activation function, L is the number of hidden units, N is the number of training samples, $\beta$ is output weight,
$\omega$ i = [$\omega$ i1, $\omega$ i2,... $\omega$ in]T is a weight vector between input and hidden layer, bi is the offset of the hidden layer unit. The goal of the extreme learning machine algorithm is to minimize the input error which can be expressed as:
$\sum_{j=1}^{L}{O}_{j}-{T}_{j}=0$
Where βi, ${\omega }_{i}$ and bi must make sure:
$\sum_{i=1}^{L}{\beta}_{i}f\left({\omega }_{i}*{x}_{j}+{b}_{i}\right)={T}_{j},j=1,\dots,N$
The matrix can be written shortly as:
${M}_{\beta }=T$
${M}_{\beta }=\left[\begin{array}{lll}f\left({\omega }_{1}*{x}_{1}+{b}_{1}\right)& \dots & f\left({\omega }_{L}*{x}_{1}+{b}_{L}\right)\\ \vdots & \dots & \vdots \\ f\left({\omega }_{1}*{x}_{N}+{b}_{1 }\right)& \dots & f\left({\omega }_{L}*{x}_{N}+{b}_{L}\right)\end{array}\right]N\times L$
$\beta =\left[\begin{array}{c}{\beta }_{1}^{T}\\ \vdots \\ {\beta }_{L}^{T}\end{array}\right] {L\times m }^{T=}\left[\begin{array}{c}{t}_{1}^{T}\\ \vdots \\ {t}_{L}^{T}\end{array}\right] N \times m$
According to Huang and Babri's proposal, the output matrix of the neural network is considered. In light of this, the training procedures for the ELM-based classifier can be summarized in the following algorithmic steps. For more comprehensive information regarding the functionality of the ELM algorithm, refer to [16,17].
The parameter settings used in the process are described in Fig. 3. Firstly, historical data from 1990-2020 was imported and prepared for analysis. The input data was normalized, a recommended step to ensure accurate predictions. Next, the parameters were set. In this case, 100 hidden nodes were used in the hidden layer. Random input weights and biases were generated, and the hidden layer output matrix was computed using the sigmoid function. The output weights were then solved using the Moore-Penrose pseudo-inverse method. Finally, the model was used to predict the CO2 emissions for both the training and testing data.
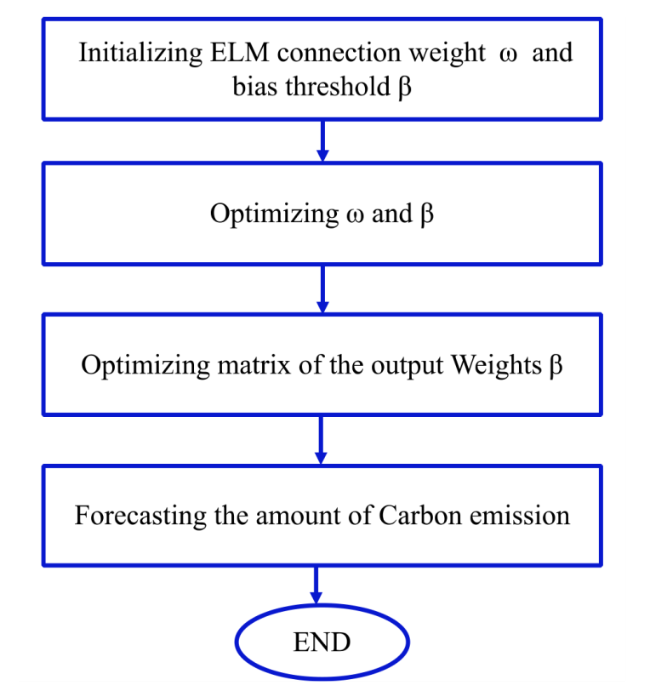
Fig. 3 Flow chart of the model ELM |
3.2.2 Basic methodology of support vector machines
Support vector machines (SVM) is a statistical machine learning technique that uniquely models complex relationships among variables [7]. The Support Vector Machine (SVM) algorithm aims to identify a classification boundary [27] that minimizes the error of training samples about the optimal classification boundary. However, when applying SVM to regression fitting analysis for predicting carbon emissions, multiple influencing factors come into play [37], making it a linearly inseparable problem. In such cases, the kernel function can transform the sample data into a high-dimensional space, reducing the computation efforts required at higher dimensions. For a training sample (xi, yi), i = 1, 2, …, n, mapping with a kernel function, the sample can be mapped to a high dimensional linear space:
$f\left(x\right)=\omega Kernel\left(x\right)+ p$
It is hard for a computer to solve the strict constraint conditions, so the relaxation factor ${\beta}_{i}$ is added, and the problem is transformed into a linear programming problem of the convex function.
$max=\left(\frac{1}{2}{|\omega |}^{2}\right)+C\sum_{i=1}^{n}{\beta}_{i}$
Subject to yi × (ω xi + b) ≥ 1−${\beta }_{i},{\beta}_{i}$ ≥ 0.
Quoting Lagrange factor:
$\begin{array}{ll}f\left(x\right)=\omega Kernel\left(x\right)+ p\\ -\sum_{i=1}^{n}{\alpha }_{i}\times \left({y}_{i}\times \left(\omega {x}_{i}+b\right)-1+{\beta }_{i}\right)-\sum_{i=1}^{n}{\mu }_{i}\times {\beta }_{i}\end{array}$
To obtain the Lagrange dual problem, the problem is transformed into solving the equation αi.
${\text{min}}\begin{array}{ll}\left(\sum_{i=1}^{n}\sum_{j=1}^{n}{\mathrm{\alpha }}_{i}{\mathrm{\alpha }}_{j}{{\text{y}}}_{i}{y}_{j}Kernel\left({x}_{i}\times {x}_{j}\right)-\sum_{i=1}^{n}{\mathrm{\alpha }}_{i}\right)\\ C\ge {\mathrm{\alpha }}_{i}\ge 0\end{array}$
In Eq. (9), C is a regularization parameter that controls the tradeoff between margin and misclassification error. These ${x}_{j}$ are called Support Vectors only if the corresponding ${\mathrm{\alpha }}_{i}>0$. Further details on the algorithmic implementation of SVM utilized in this work can be found in [25].
The Fig. 4 describes the parameter settings, which involve the following steps: importing the data for training an SVM regression model, preparing the data for training, training the SVM, and making predictions. The use of the Gaussian kernel function suggests that the model is suitable for capturing non-linear relationships in the data.
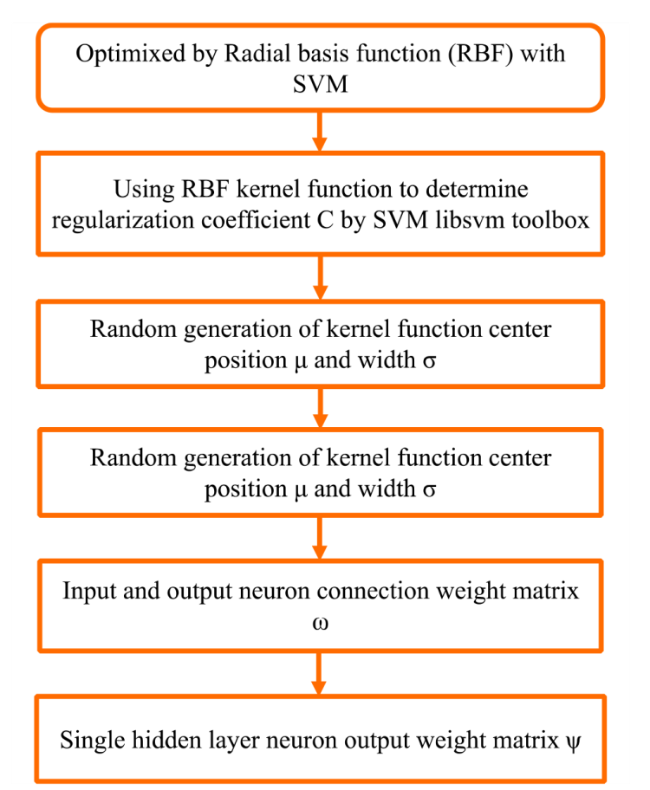
Fig. 4 Flow chart of the model SVM |
3.2.3 Principal of the SVM-ELM model
To exploit the similar mapping functionality as the kernel function in SVM, this study replaces the single hidden layer map h(x) in the extreme learning machine (ELM) algorithm with the kernel function used in SVM. In cases where the exact form of h(x) is unknown, a nuclear matrix is defined based on the Mercer condition [4].
${\Omega }_{ELM}={HH}^{T}=h\left({x}_{i}\right)h\left({x}_{j}\right)= K\left({x}_{i}, {x}_{j}\right)$
Using the kernel function ${\text{K}} \left({{\text{X}}}_{{\text{i}}},{{\text{X}}}_{{\text{j}}}\right)$can enhance the stability of the original ELM algorithm. According to the standard optimization principle, the initial objective function can be expressed as:
$min{L}_{p}=\frac{1}{2}{\omega }^{2}+\frac{1}{2}C\sum_{i=1}^{n}{{\xi }_{i}}^{2}$
s.t.ψ(xi)ω = yi − ξi,i = 1,2…,n, where C is a regular coefficient and ξi is a training error. According to the KKT theory (Karush-Kuhn-Tucker conditions) [13], the above problem can be transformed into:
$\begin{array}{c}{L}_{p kelm}=\frac{1}{2}{\omega }^{2}+\frac{1}{2}C\sum_{i=1}^{n}{{\xi }_{i}}^{2}-\\ -\sum_{i=1}^{n}{\eta }_{i}\left(\psi \left({x}_{i}\right)\omega = {y}_{i} -{\xi }_{i}\right)\end{array}$
where ηi is the Lagrange operator. The output function of the SVM-ELM algorithm is:
$\omega = \sum_{i=1}^{n}{\eta }_{i}\psi {\left({x}_{i}\right)}^{T}={\psi }^{T}\eta$
${\text{C}}\xi i = \eta i$
$\psi \left({x}_{i}\right)\omega - {y}_{i}+{\xi }_{i}=0$
where η = [η1,η2,…,ηn]T
Defining the kernel function K(xi, xj) = ψ(xi) · ψ(xj) T, i = 1, 2... n, and SVM-ELM single hidden layer output is:
$f\left(x\right)=\psi \left(x\right)\omega =\psi \left(x\right){\psi }^{T}{\left(\psi {\psi }^{T}+\frac{1}{C}\right)}^{-1}Y$
Due to the arbitrary assignment of initial input weight and threshold in the original ELM, the algorithm exhibits instability. In contrast, the SVM-ELM algorithm leverages the powerful non-linear mapping capability of the kernel function, resulting in improved function approximation. Consequently, the SVM-ELM algorithm showcases higher learning speed, accuracy, and generalization ability than the original model. Different multi-core functions such as RBF, wavelet, and polynomial can be used to address SVM. In this study, we utilized the RBF kernel function.
The parameter settings for the model to forecast state-wide CO2 emissions using ELM and SVM regression. The settings begin by specifying the import options for a spreadsheet, including the number of variables, the sheet and range, and the variable names and types. It then imports the data from the specified Excel file into a table. The input data is then normalized. The parameters for the ELM model are then set, including the number of hidden nodes. Random input weights and biases are generated for the ELM model, and the hidden layer output matrix is computed using the sigmoid activation function. Subsequently, the SVM regression model is trained using the ELM outputs, with a Gaussian kernel function specified. Finally, the model is used to predict the output for the training data. The model described is a hybrid SVM-ELM regression model, combining the strengths of ELM in feature extraction and the power of SVM in regression tasks (Fig. 5).
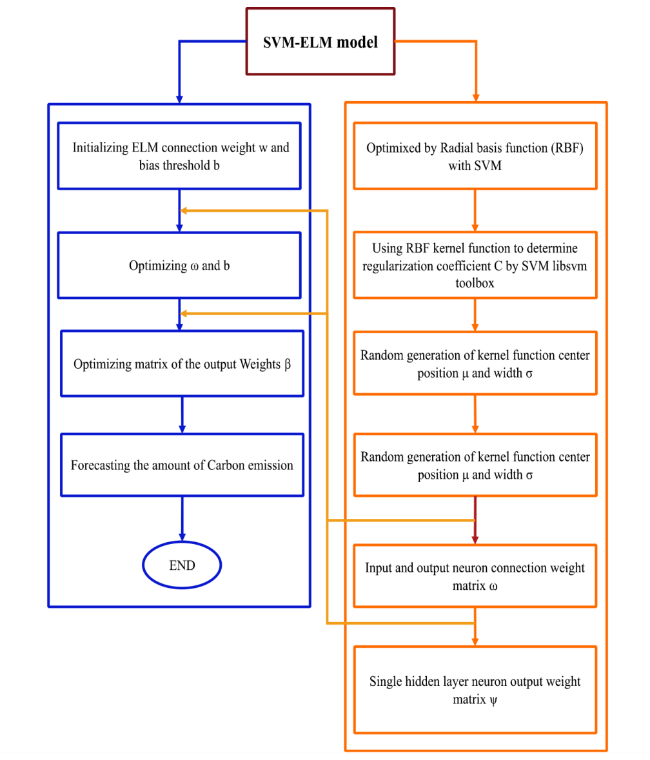
Fig. 5 Flow chart of the model SVM-ELM |
3.2.4 Hybrid GM (1,1) optimized by SVM -ELM algorithm
The grey prediction theory is used to find the laws of the system through processing, writing data, and establishing the corresponding mathematical model Fig. 6. Therefore, using GM to predict the main type of Fuel Combustion Emissions by Fuel Category and Statewide Greenhouse Gas Emissions. GM(1;1) [26,34,35] is mainly divided into the following step:
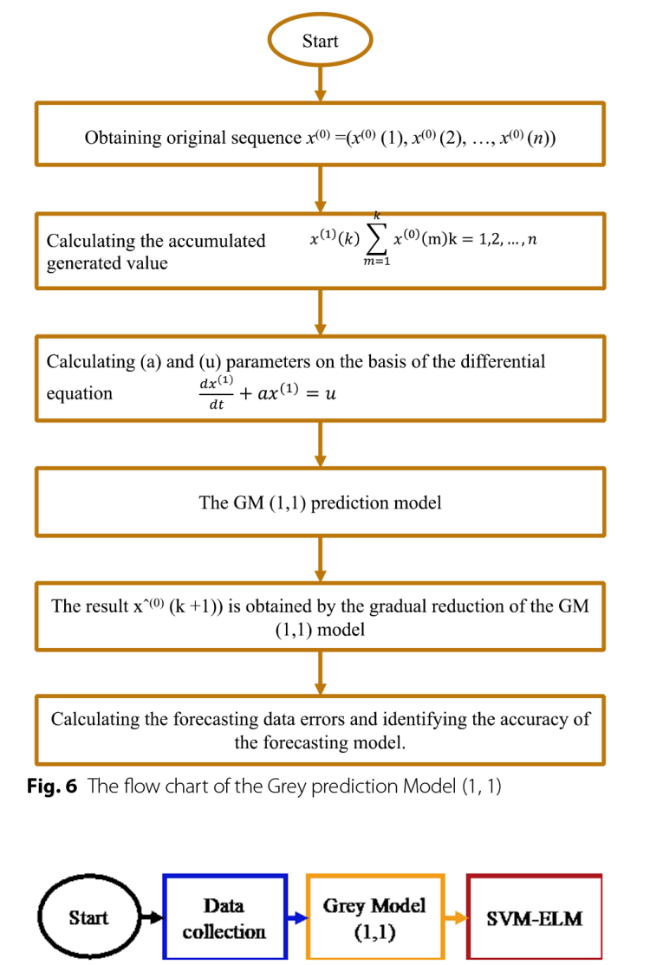
Fig. 6 The flow chart of the Grey prediction Model (1, 1) |
Obtaining original sequence
$x(0) =(x(0) (1), x(0) (2), \dots, x(0) (n))$
Calculating the accumulated generated value
${x}^{\left(1\right)}\left(k\right)\sum_{m=1}^{k}{x}^{\left(0\right)}\left({\text{m}}\right){\text{k}}=\mathrm{1,2},\dots,n$
Calculating (a) and (u) parameters on the basis of the differential equation
$\frac{{dx}^{\left(1\right)}}{dt}+{ax}^{\left(1\right)}=u$
The GM (1,1) prediction model
$\begin{array}{c}\text{x}^\wedge\left(1\right)\left(\mathrm k+1\right)=\left(\text{x}\left(0\right)\left(1\right)-\frac ua\right)\text{e}-\mathrm{ak}+\\+\frac ua\text{k}=1,2,\dots,\text{n}\end{array}$
The result xˆ(0) (k + 1)) is obtained by the gradual reduction of the GM (1,1) model [46].
The Hybrid GM (1,1) Optimized by SVM-ELM Algorithm Fig. 7, this model includes a number of processes that are executed in order to prepare, analyze, and predict carbon dioxide emission data using the GM(1,1) and SVM-ELM regression. The code first imports the data from an Excel file and then splits it into a training set and a testing set. The data is then preprocessed by normalizing the input data and preparing it for the Grey Prediction model. The Grey Prediction model is then implemented to forecast carbon emissions based on the training data. This involves calculating the accumulated generation (AG) sequence, estimating parameters a and b, and computing the predicted CO2 emissions using the Grey Prediction model. Next, sets the parameters for the ELM and computes the hidden layer output matrix using ELM. The SVM regression model is then trained using the ELM outputs and the predicted emissions. Finally, predicts the output for the testing data using the ELM-SVM model.
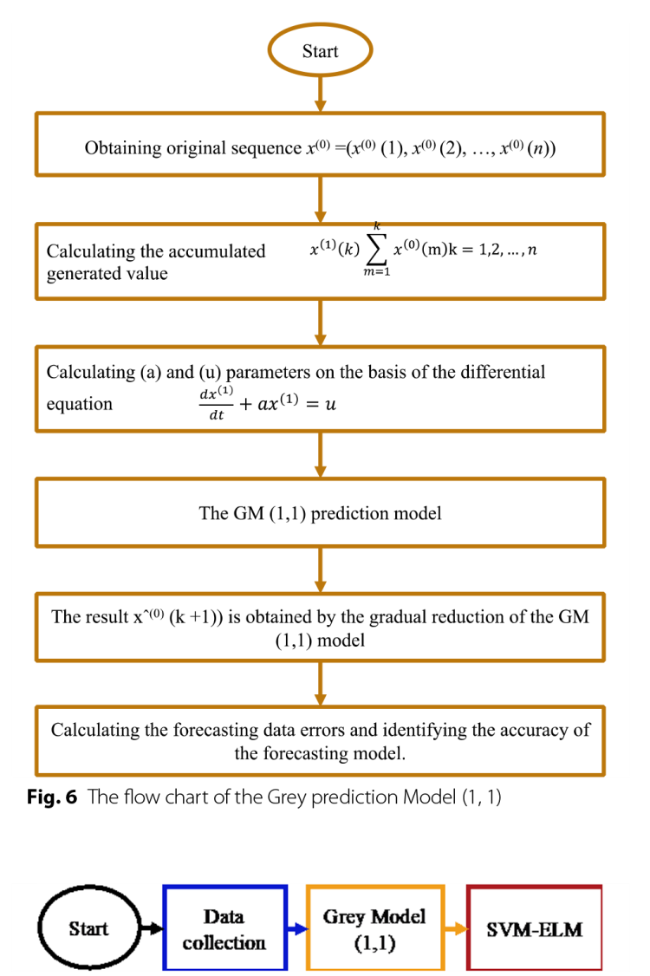
Fig. 7 The flow chart of the Grey prediction Model (1, 1) optimized by the SVM-ELM model |
3.3 Performance metrics used for evaluating the accuracy of the models
To understand the performance of the forecasting model, error analysis indicators are necessary. This research uses mean absolute error (MAE), mean absolute percentage error (MAPE), and mean square error (MSE). MAE represents the mean absolute errors and is used to reflect the actual situation of the forecast error. MAE is calculated as:
$MAE= \frac{1}{n}\sum_{i=1}^{n}\left|y\left(i\right)-\widehat{y}\left(i\right)\right|$
where $\widehat{y}\left(i\right)$ is the prediction, and y(i) is the actual value. The range of values for MAE is 0 to + ∞. As the result of MAE increases, the size of the error likewise increases.
MAPE is a straightforward measure of the prediction accuracy of a forecasting method and is thus usually considered the fairest indicator. On this basis, MAPE is generally viewed as the most critical precision evaluation indicator. Dividing each error by the actual value to get an average result in percentage Table 1, MAPE is defined by:
Table 1 Interpretation of typical MAPE |
| MAPE (%) | Model accuracy |
|---|---|
| < 10 | EXCELLENT |
| 10-20 | GOOD |
| 20-50 | QUALIFIED |
| > 50 | UNQUALIFIED |
Source; Lewis (1982, p. 40) [24] |
$MAPE=\frac{1}{n}\sum_{i=1}^{n}\left|\frac{y\left(i\right)-\widehat{y}\left(i\right)}{y\left(i\right)}\right|*100\%$
MSE denotes the ratio of the square of the two norms of the error vector to the number of samples and is defined as
$MSE= \frac{1}{n}\sum_{i=1}^{n}\left(y\left(i\right)-\widehat{y}\left(i\right)\right){ }^{2}$
The performance evaluation metrics such as MSE, MAE, and MAPE are used to assess the accuracy and robustness of the different modeling approaches. By carefully adjusting the parameters and evaluating the model performance, the effectiveness of each method and make informed decisions about the most suitable model for predicting CO2 emissions.
3.4 Experimental setup and implementation
Parameter settings for the algorithms used in this study involved the use of historical data from 1990-2020 as training data. The data was prepared in Excel and then imported into MATLAB for further processing. Each model required specific implementation steps, including algorithm training, testing, and results evaluation.
In the context of scenario forecasting, preliminary emissions calculations for 2030 and 2050 were utilized. These calculations were based on carbon dioxide emissions reduction pathways. The training set for the models included historical data from 1990-2020, as well as the calculated data for the specified scenarios in 2030 and 2050. This approach allowed for the comprehensive evaluation of different parameter settings within the algorithms used, taking into account historical data and projected scenarios.
3.5 New York State decarbonization pathways analysis
New York State has developed decarbonization pathways for various sectors [38], outlining a comprehensive strategy to achieve substantial reductions in greenhouse gas emissions [45] Table 2. In the transportation sector, the focus is on transitioning to zero-emission vehicles and equipment, enhancing public transportation and mobility alternatives, promoting smart growth and mobility-oriented development, and facilitating market-based solutions and financing. The residential and commercial buildings sector aims to adopt zero-emission codes and standards, transition from hydrofluorocarbons, and electrify space and water heating using heat pumps. The electric power sector aims to transform power generation, enhance the grid, and invest in new technology to achieve renewable energy and energy storage goals. In the industrial sector, the strategies are focused on providing financial and technical assistance, incentivizing procurement for low-carbon products, supporting workforce development, and facilitating research, development, and demonstration. By implementing these strategies, New York State aims to achieve a zero-emission electricity system by 2040, electrify 85% of homes and commercial building space by 2050, and reduce direct GHG emissions from industrial activities. These initiatives reflect a commitment to addressing climate change and transitioning towards a sustainable and low-carbon future.
Table 2 Strategy for economic sectors to develope pathways, key assumptions |
| Strategy | Pathway 1: High Technology Availability | Pathway 2: Integrated Pathway | Pathway 3 (Reference Case Pathway) | |
|---|---|---|---|---|
| Electric Power | Clean Electricity Generation: Technology-specific targets | Share of renewable/zero- emission generation: 70% renewable by 2030, 100% zero- emission by 2040 Offshore wind capacity: 9 GW by 2035 Behind-the-meter solar PV: 6 GW by 2025 Energy storage: 3 GW by 2030 | Share of renewable/zero- emission generation:50% renewable by 2030 Offshore wind capacity: 2.4 GW by 2030 Behind-the-meter solar PV: 3 GW by 2023 Energy storage: 3 GW by 2030 | |
| Residential and Commercial sector | Building Electrification Appliance Efficiency (non-HVAC) | Electric heat pump sales share: 50% by 2030, 95% by 2050 Appliance Efficiency (non-HVAC): 90% by 2023, 100% by 2025 | Electric heat pump sales share: 6% by 2025 Appliance Efficiency (non-HVAC): 100% by 2025 | |
| Industrial | Efficiency increaser elative to baseline projection: Share of natural gas and LPG use electrified: | 10% by 2030, 45% by 2045 | 10% by 2030; 20% by 2050 60% by 2045 | |
| Transportation | Smart Growth of LDV VMT reduction relative to Reference Aviation Efficiency: | 3% by 2030, 9% by 2050 10% by 2030, 40% by 2050 | ||
| Vehicle Electrification | ● DV: 60% by 2030, 100% by 2040; ● Bus: 60% by 2030, 100% by 2040; ● MDV/HDV: 35% by 2030; 95% by 2040 | ● LDV: 70% by 2030, 100% by 2035; ● Bus: 70% by 2030, 100% by 2035; ● MDV/HDV: 50% by 2030; 95% by 2040 | ● LDA: 25% by 2025; ● LDT: 8% by 2025; ● MDV/Bus: 2% by 2050 | |
| Zero Emissions Fuels | Biofuels Blend: Share of conventional fuel use replaced with biofuels | 100% renewable gas in CNG vehicles by 2030, 40% renewable diesel by 2030, ~ 100% renewable diesel by 2050, 8% renewable gas in pipeline by 2050 | 100% renewable gas in CNG vehicles by 2030, 40% renewable diesel by 2030, 100% renewable diesel by 2050, 100% renewable gasoline by 2050, 68% renewable jet kerosene by 2050, 18% renewable gas in pipeline by 2050 | 7% aggregate ethanol blend for gasoline, 8.4% biodiesel blend for heating oil in Downstate model segment by 2034 to account for areas with biodiesel mandates |
3.6 Scenario settings
The specific percentage carbon emission reduction pathways for New York State's economic sectors were chosen based on careful analysis and consideration of various factors Table 3. Pathway 1, which focuses on high technology availability, aims for a 40% reduction in CO2 emissions by 2030 and an 85% reduction by 2050 across all sectors. This pathway was chosen because it is ambitious yet achievable with the technological advancements expected in the coming years. Pathway 2, known as the Integrated Pathway, sets higher targets for the electric power sector (70% reduction by 2030, 100% reduction by 2050) and moderate targets for the other sectors. This pathway was selected to prioritize the decarbonization of the electric power sector, which is crucial for overall emissions reductions. Pathway 3, with lower reduction targets across all sectors, provides a more conservative approach. This pathway was included to show the potential outcomes if more modest efforts are made to reduce carbon emissions.
Table 3 Carbon emission percentage reduction for different pathways relative to 1990 |
| Economic sectors | 2030 | 2050 | ||||
|---|---|---|---|---|---|---|
| P1 | P2 | P3 | P1 | P2 | P3 | |
| Electric Power | 40% | 70% | 30% | 85% | 100% | 70% |
| Residential | 31% | 10% | 85% | 20% | ||
| Commercial | 31% | 10% | 85% | 17% | ||
| Industrial | 6% | 15% | 81% | 25% | ||
| Transportation | 31% | 30% | 86% | 55% | ||
| Total CO2 emission reduction | 40% | 43% | 23% | 85% | 89% | 44% |
4 Results and discussion
4.1 NY state CO2 emission data analysis and pre-processing
Table 4 NY state Fuel Combustion Emissions for different economic sectors, 1990-2020 (MMt CO2 e) |
| Economic sectors | 1990 | 2005 | 2015 | 2016 | 2017 | 2018 | 2019 | 2020 |
|---|---|---|---|---|---|---|---|---|
| Electric Power | 63.2 | 55.4 | 29.1 | 27.7 | 22.0 | 24.4 | 21.4 | 23.4 |
| Residential | 33.8 | 39.4 | 35.3 | 30.7 | 31.4 | 36.4 | 35.7 | 31.5 |
| Commercial | 26.8 | 28.6 | 22.8 | 21.7 | 22.1 | 23.2 | 22.9 | 20.3 |
| Industrial | 19.6 | 14.7 | 9.5 | 9.2 | 8.9 | 9.1 | 9.0 | 8.0 |
| Transportation | 63.9 | 73.4 | 77.6 | 80.8 | 81.5 | 82.0 | 79.8 | 60.1 |
Source State Energy Data System (SEDS), U.S. Energy Information Administration \* MERGEFORMAT [36] |
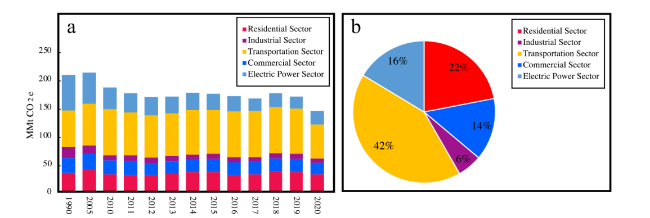
Fig. 8 (a) New York carbon dioxide emissions from fossil fuel consumption (1990-2020) (b) Energy-related CO2 in New York State: relative to 2020 for different economic sectors |
Transportation emissions in New York State are a significant contributor to air pollution and carbon emissions. The extensive road network and high population density result in elevated emissions from cars, trucks, planes and public transit. In 2020, the transportation sector was responsible for 42% of New York’s carbon emissions. It is largely dependent on petroleum-based fuels such as gasoline, diesel, and jet fuel. The emissions from fossil fuel combustion grew 25% from 1990 to 2019 and declined 6% from 1990 to 2020. This deference is described with restriction during the COVID-19 pandemic period.
Residential and commercial sectors: The emissions from the combustion of fossil fuels in 2020 in the residential sector are 22%, and in the commercial sector, they are 14%. Together, this makes it the second-largest source of emissions. Direct emissions from buildings originate from the burning of fossil fuels onsite in residential and commercial buildings, primarily for space and water heating, cooking, and associated upstream emissions. The fuels used in buildings today include fossil natural gas, distillate fuel, wood, propane, kerosene, and residual fuel.
Electric power sector: comprised 16% of statewide emissions in 2020. In New York, the electricity sector consists of conventional fossil fuel-fired power generation facilities and nuclear generation facilities, as well as renewable energy generation from sources like wind, solar, hydropower, energy storage, and transmission infrastructure. The most significant trend in fuel combustion emissions since 1990 was a 63% reduction from the electricity sector.
Industrial sector: Industrial emissions made up 6% of statewide emissions in 2020, including emissions from combustion from the oil and gas system in New York. The largest share of emissions is created by the production of food, paper, bulk chemicals, glass, cement, metals, semiconductors, wood products, and plastics.
The majority of fuel combustion emissions in 2020 were from the burning of petroleum fuels, which is unsurprising as these are the main fuels used in transportation. However, emissions from the combustion of petroleum fuels have declined by 41,7% since 1990, while emissions from natural gas increased by nearly 46%. Emissions from the combustion of coal declined by 84% Table 5. Fuel Combustion Emissions In New York State from natural gas makes up for 48% of the fuel combustion emissions, with petroleum fuels accounting for the remaining 52%. the absence of coal in New York State's fuel combustion emissions highlights a shift towards cleaner fuel sources Fig. 9.
Table 5 NY state fuel combustion emissions by fuel category, 1990-2020 (MMt CO2 e) |
| Fuel Category | 1990 | 2005 | 2015 | 2016 | 2017 | 2018 | 2019 | 2020 |
|---|---|---|---|---|---|---|---|---|
| Natural Gas | 47.23 | 58.54 | 73.70 | 70.52 | 67.37 | 73.53 | 70.57 | 68.86 |
| Coal | 33.15 | 24.49 | 3.92 | 2.82 | 1.86 | 1.59 | 1.30 | 0.54 |
| Petroleum fuels | 126.95 | 128.47 | 96.73 | 96.80 | 96.61 | 99.98 | 97.10 | 73.97 |
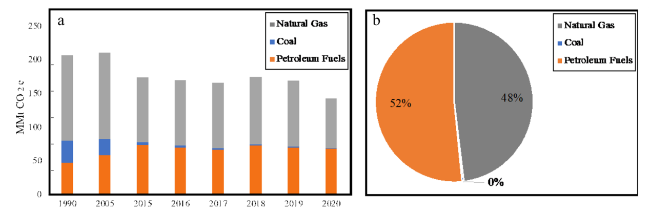
Fig. 9 (a) NY state Fuel Combustion Emissions by Fuel Category, 1990-2020 (MMt CO2 e) (b) Energy-related CO2 in New York State: and relative to 2020 for different Types of Fuel |
4.2 New York State carbon emission forecasting results and projections for fuel categories
The comparison of simulation results for four different machine learning algorithms—ELM, SVM, SVM-ELM, and GM & SVM-ELM—has provided the accuracy of predicting carbon emissions for different types of fossil fuels in NYS. The MAPE values for each model were analyzed to determine their accuracy in forecasting carbon emissions for coal, petroleum fuels, and natural gas.
For coal, from Table 1 can be concluded the ELM model demonstrated excellent accuracy with a MAPE of 5%, while the SVM model exhibited a MAPE of 32%, indicating reasonable but less accurate predictions. The combined SVM-ELM model showed improved accuracy with a MAPE of 19%, while the GM&SVM-ELM model was considered unqualified due to its significantly high MAPE of 276%. This analysis allows for the evaluation of the performance of the machine learning models and their ability to accurately predict coal carbon emissions.
In the case of petroleum fuels, the ELM and SVM models exhibited the smallest MAPE values of 2%, suggesting that they are the most accurate in predicting carbon emissions for this category. This visual comparison enabled an assessment of the accuracy and reliability of the forecasting provided by each model.
For natural gas, according to the interpretation of typical MAPE values from Table 1 all four machine learning algorithms demonstrated excellent results in predicting carbon emissions. However, the ELM and SVM models stood out with the smallest percentage error, indicating their particularly accurate predictions (Fig. 10).
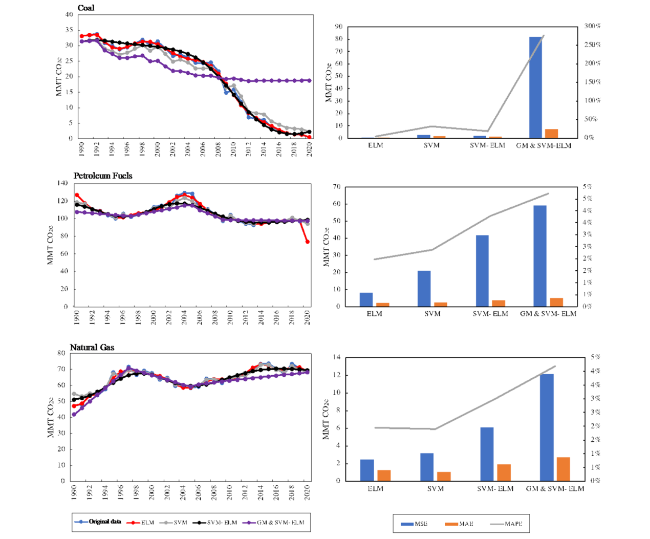
Fig. 10 Validation of the comparison between the original amount of carbon emissions and the forecasting output of four models for Coal, Petroleum fuels and natural gas. Evaluation of models the comparison of prediction errors |
According to the evaluation results in Table 6, which include the calculation of MAE, MSE, and MAPE, it can be concluded that the ELM model has demonstrated the highest accuracy in predicting fossil fuel type emissions. This model achieved the lowest values for MAE, MSE, and MAPE, indicating a closer fit between predicted and actual values. The SVM-ELM model comes in second place in terms of accuracy. Although it performed slightly less accurately than the ELM model, it still demonstrated good predictive capabilities for fossil fuel types. Next in line, we have the SVM model and the GM&SVM-ELM model. These models have shown relatively lower accuracy levels in predicting fossil fuel types compared to the ELM and SVM-ELM models.
Table 6 The evaluation of four models |
| Model | Type of Fuel | MSE | MAE | MAPE (%) |
|---|---|---|---|---|
| ELM: | Coal | 0.753 | 0.600 | 5% |
| Petroleum fuels | 8.217 | 2.111 | 2% | |
| Natural Gas | 2.470 | 1.276 | 2% | |
| SVM: | Coal | 2.979 | 1.724 | 32% |
| Petroleum fuels | 20.936 | 2.369 | 2% | |
| Natural Gas | 3.179 | 1.090 | 2% | |
| SVM-ELM: | Coal | 1.962 | 1.199 | 19% |
| Petroleum fuels | 41.662 | 3.883 | 4% | |
| Natural Gas | 6.094 | 1.899 | 3% | |
| GM & SVM-ELM: | Coal | 81.966 | 7.264 | 276% |
| Petroleum fuels | 59.079 | 4.994 | 5% | |
| Natural Gas | 12.152 | 2.711 | 4% |
Overall, based on the evaluation results shown in Table 6, it can be concluded that the ELM model is the most accurate for predicting fossil fuel types, followed by the SVM-ELM model. The SVM and GM&SVM-ELM models achieved lower levels of accuracy in this regard.
4.3 NY state CO2 emission scenario-based prediction
The parameters of the three scenarios outlined in Table 3 are primarily set based on the proposed percentage goals for total CO2 emissions in the state of New York. These projections are visually represented in Fig. 11 and Fig. 12. The data set contains 33 values, including those from 1990-2020, projections for 2030 and 2050. The calculation for 2030 and 2050 is made based on the proposed percentage goals for each economic sector. The process begins with the importation of the data. The data is then read and manipulated to prepare it for analysis. Then parameters for the ELM are set, including the number of hidden nodes. Random input weights and biases are generated, followed by the computation of the hidden layer output matrix using the sigmoid function. The output weights are then solved using the Moore-Penrose pseudo-inverse, and the predicted output for training and testing data is calculated (Table 7).
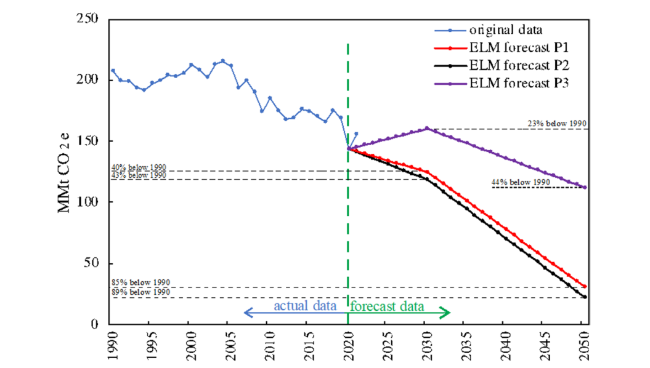
Fig. 11 Scenario-based prediction of NY state, total CO2 emission from 2020-2050 |
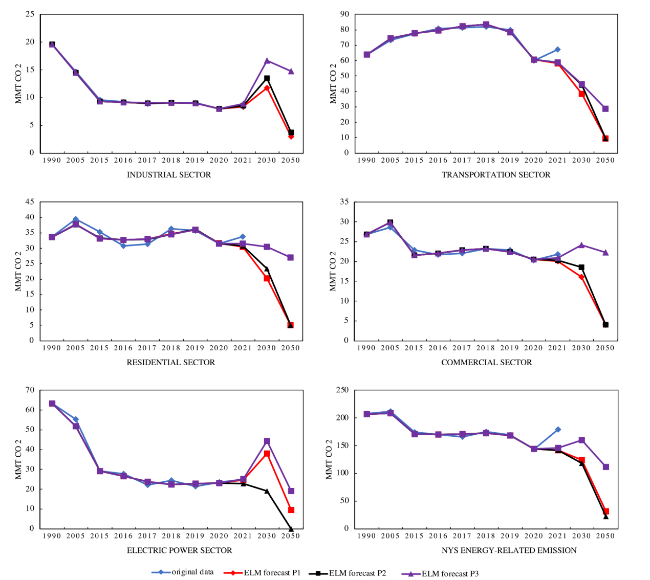
Fig. 12 Pathway1 (P1), Pathway 2 (P2), Pathway 3 (P3) prediction of NY state CO2 emissions for residential (a), commercial (b), industrial (c), transportation (d), electric power (e), and total state energy-related CO2 e by sector (f). for the period 1990-2050 based on the E LM model |
Table 7 Predicted values of CO2 emissions for New York State, MMtCO2 e. in different economic sectors |
| Residential Sector | Commercial Sector | Industrial Sector | ||||||||||
|---|---|---|---|---|---|---|---|---|---|---|---|---|
| original data | ELM forecast | original data | ELM forecast | original data | ELM forecast | |||||||
| P1 | P2 | P3 | P1 | P2 | P3 | P1 | P2 | P3 | ||||
| 1990 | 33.79 | 33.629 | 33.624 | 33.63 | 26.835 | 26.833 | 26.835 | 26.84 | 19.605 | 19.557 | 19.561 | 19.56 |
| 2005 | 39.406 | 37.794 | 37.737 | 37.78 | 28.636 | 29.874 | 29.871 | 29.87 | 14.704 | 14.52 | 14.52 | 14.52 |
| 2015 | 35.342 | 33.166 | 33.254 | 33.2 | 22.844 | 21.601 | 21.603 | 21.6 | 9.534 | 9.324 | 9.324 | 9.32 |
| 2016 | 30.719 | 32.714 | 32.695 | 32.7 | 21.739 | 22.093 | 22.096 | 22.1 | 9.218 | 9.123 | 9.126 | 9.13 |
| 2017 | 31.368 | 33.003 | 32.877 | 32.95 | 22.07 | 22.866 | 22.867 | 22.87 | 8.872 | 9.018 | 9.021 | 9.03 |
| 2018 | 36.393 | 34.595 | 34.533 | 34.57 | 23.204 | 23.208 | 23.206 | 23.2 | 9.07 | 9.058 | 9.058 | 9.06 |
| 2019 | 35.72 | 35.992 | 36.158 | 36.06 | 22.92 | 22.406 | 22.405 | 22.41 | 9.037 | 8.985 | 8.981 | 8.97 |
| 2020 | 31.501 | 31.589 | 31.528 | 31.56 | 20.321 | 20.507 | 20.508 | 20.51 | 7.99 | 8.011 | 8.012 | 8.02 |
| 2021 | 33.702 | 30.458 | 30.707 | 31.45 | 21.763 | 20.067 | 20.309 | 20.87 | 8.284 | 8.386 | 8.564 | 8.88 |
| 2030 | 20.274 | 23.314 | 30.41 | 16.101 | 18.516 | 24.15 | 11.763 | 13.528 | 16.67 | |||
| 2050 | 5.069 | 5.068 | 27.03 | 4.026 | 4.026 | 22.27 | 2.941 | 3.725 | 14.71 | |||
| Transportation Sector | Electric Power Sector | NYS energy-related Emission | ||||||||||
| original data | ELM forecast | original data | ELM forecast | original data | ELM forecast | |||||||
| P1 | P2 | P3 | P1 | P2 | P3 | P1 | P2 | P3 | ||||
| 1990 | 63.903 | 63.938 | 63.938 | 63.94 | 63.192 | 63.223 | 63.228 | 63.21 | 207.324 | 207.179 | 207.178 | 207.18 |
| 2005 | 73.363 | 74.499 | 74.505 | 74.49 | 55.394 | 51.881 | 51.862 | 51.9 | 211.504 | 208.586 | 208.589 | 208.59 |
| 2015 | 77.553 | 77.685 | 77.676 | 77.69 | 29.086 | 29.109 | 29.122 | 29.1 | 174.36 | 170.878 | 170.873 | 170.87 |
| 2016 | 80.801 | 79.617 | 79.628 | 79.62 | 27.673 | 26.519 | 26.547 | 26.49 | 170.151 | 170.076 | 170.078 | 170.08 |
| 2017 | 81.478 | 82.299 | 82.321 | 82.29 | 22.041 | 23.834 | 23.842 | 23.82 | 165.83 | 171.036 | 171.045 | 171.05 |
| 2018 | 82.012 | 83.406 | 83.41 | 83.4 | 24.417 | 22.374 | 22.354 | 22.39 | 175.097 | 172.642 | 172.647 | 172.65 |
| 2019 | 79.849 | 78.342 | 78.315 | 78.35 | 21.446 | 22.742 | 22.731 | 22.76 | 168.971 | 168.453 | 168.442 | 168.44 |
| 2020 | 60.119 | 60.521 | 60.533 | 60.52 | 23.445 | 23.128 | 23.136 | 23.12 | 143.377 | 143.764 | 143.769 | 143.77 |
| 2021 | 67.295 | 58.303 | 58.89 | 58.94 | 25.004 | 24.606 | 22.718 | 25.23 | 179.486 | 141.827 | 141.233 | 145.41 |
| 2030 | 38.34 | 44.093 | 44.73 | 37.914 | 18.956 | 44.23 | 124.395 | 118.41 | 160.19 | |||
| 2050 | 9.584 | 9.585 | 28.76 | 9.478 | 0 | 18.96 | 31.099 | 22.405 | 111.96 | |||
Based on the results obtained from the ELM model Fig. 12 it can be observed.
For the residential sector, the original data of 33.702 MMt CO2 e in 2021 is closest to the P3 prediction of 31.45 MMt CO2 e. In the commercial sector, the original data of 21.763 MMt CO2 e in 2021 is closest to the P1 prediction of 20.067 MMt CO2 e. For the industrial sector, the original data of 8.284 MMt CO2 e in 2021 is closest to the P1 prediction of 8.386 MMt CO2 e. In the transportation sector, the original data of 67.296 MMt CO2 e in 2021 is closest to the P3 prediction of 58.94 MMt CO2 e. For the electric power sector, the original data of 25.004 MMt CO2 e in 2021 is closest to the P3 prediction of 25.23 MMt CO2 e. Lastly, for NYS energy-related emissions, the original data of 179.486 MMt CO2 e in 2021 is closest to the P3 prediction of 145.41 MMt CO2 e.
These comparisons indicate that for certain sectors, the predictions of Pathway 3 (P3) are closer to the original data for CO2 emissions in 2021. This suggests that a more conservative approach, as outlined in Pathway 3, may align better with the actual emissions data in certain economic sectors.
Table 8 and Fig. 13 the findings of the carbon emission share in New York State under different scenarios for 2030 and 2050 reveal significant differences in the distribution of emissions across various sectors. In Pathway 1, the total CO2 emissions in 2030 are projected to be 124.395 MMtCO2 e, with the residential sector accounting for 16.3%, the commercial sector for 12.9%, the industrial sector for 9.5%, the transportation sector for 30.8%, and the electric power sector for 30.5%. Similarly, in 2050, the percentages remain consistent across these sectors.
Table 8 Share of carbon emission in NYS under different scenarios in 2030 and 2050 (%) |
| 2030 | 2050 | |||||
|---|---|---|---|---|---|---|
| P1 | P2 | P3 | P1 | P2 | P3 | |
| Residential Sector | 16.3 | 19.7 | 19 | 16.3 | 22.6 | 24.2 |
| Commercial Sector | 12.9 | 15.6 | 15.1 | 12.9 | 18 | 19.9 |
| Industrial Sector | 9.5 | 11.4 | 10.4 | 9.5 | 16.6 | 13.2 |
| Transportation Sector | 30.8 | 37.2 | 27.9 | 30.8 | 42.8 | 25.7 |
| Electric Power Sector | 30.5 | 16 | 27.6 | 30.5 | 0 | 17 |
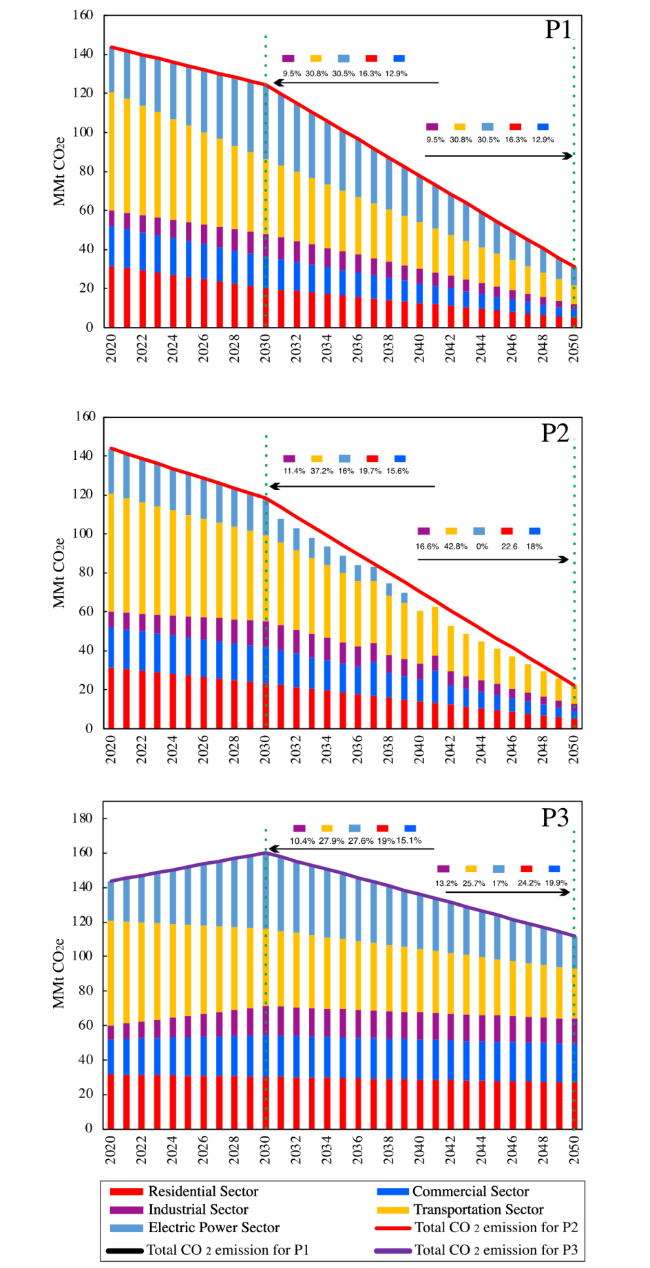
Fig. 13 Share of carbon emission in NYS for different Pathways from 2020 to 2050 |
In Pathway 2, the total CO2 emissions in 2030 are projected to be 118.410 MMtCO2 e, with the residential sector accounting for 19.7%, the commercial sector for 15.6%, the industrial sector at 11.4%, the transportation sector at 37.2%, and the electric power sector for 16.0%. Interestingly, in 2050, the percentages for the residential, commercial, and industrial sectors increase while the electric power sector will decrease to 0%.
In Pathway 3, the total CO2 emissions in 2030 are projected to be 160.19 MMtCO2 e, with the residential sector accounting for 19%, the commercial sector at 15.1%, the industrial sector at 10.4%, the transportation sector at 27.9%, and the electric power sector for 27.6%. And in 2050, the percentages for each sector show slight variations from the 2030 numbers.
These findings suggest that each pathway offers an approach to reducing carbon emissions, with varying impacts on sectors such as transportation and electric power. Therefore, policymakers must carefully consider these pathways and their implications for achieving emission reduction targets.
4.4 Suggestions
The comparison of forecasted results with 2021 shows that NYS is still far from its ambitious targets. Suggestions for reaching these targets include switching to zero-emission energy sources, improving energy efficiency, electrifying space and water heating, electrifying vehicles, and increasing the use of renewable energy in the power sector.
Residential and commercial sector: Transition from fossil fuels to highly efficient equipment and systems powered by zero-emission energy sources. Implement more sustainable building construction methods, such as reusing existing structures and utilizing lower carbon materials. Electrify space and water heating with high-efficiency heat pumps. Promote the use of ground source heat and district geothermal energy networks to reduce the strain on the electric grid. By 2030, aim to make 250 thousand NY homes and commercial buildings energy efficient. By 2050, target electrification of 85% of buildings.
Industrial sector: Improve energy efficiency and promote industrial electrification. Utilize alternative fuels and increase the use of renewable electricity. Implement carbon capture [5], utilization, and sequestration technologies.
Transportation: Aim for the electrification of all light-duty vehicles by 2030, as well as 40% of medium and heavy-duty vehicles. Increase the use of renewable diesel and low-carbon fuels. Progressively shift from fossil fuels to low-carbon electricity. By 2050, target a 10% shift to zero-emission vehicles. Promote the use of low-carbon options in public transportation and reduce personal trips. Encourage the aviation industry to transition to green hydrogen and renewable biofuels.
Electric power: Work towards achieving a 100% zero-emission power grid by phasing out the use of fossil fuels for power generation. Increase the deployment of renewable energy technologies such as solar, energy storage, and wind power to achieve a 70% renewable energy target by 2030. Reduce the use of emitting fuels in the electricity sector by deploying clean energy resources such as land-based wind and solar, offshore wind, hydropower, fuel cells, and energy storage.
These suggestions align with the goals outlined in the New York State's climate action plan to reduce emissions and transition to a sustainable, low-carbon future. Implementing these changes across the residential, commercial, industrial, transportation, and electric power sectors will be crucial in meeting the ambitious targets set for 2030 and 2050. It will require collaboration between government, businesses, and communities to drive the necessary transformation and achieve a more sustainable and environmentally friendly state.
5 Conclusion
This paper has made significant contributions to the understanding of carbon emissions in the state of New York. The analysis of emissions from different economic sectors, including transportation, residential, commercial, industrial, and electric power, has provided clarification into the sources and trends of carbon emissions in the state. The comparison of four different machine learning algorithms to predict carbon emissions has demonstrated the effectiveness of the ELM model in accurately forecasting emissions for different types of fossil fuels.
The findings of this research have also shed light on the pathways to reach carbon neutrality in New York. The comparison of three pathways—Pathway 1, Pathway 2, and Pathway 3—has revealed the potential impact of different strategies on emissions reduction across various sectors. The analysis of the data for 2021 and the projections for 2030 and 2050 have shown that the predictions of Pathway 3 aligned better with the actual emissions data in certain economic sectors, suggesting that a more conservative approach may be essential in achieving emission reduction targets.
The analysis of this research focused solely on emissions from fossil fuel combustion and did not consider other sources of carbon emissions, such as industrial processes, waste management, and agriculture. Future research should expand the scope to include a comprehensive analysis of all sources of carbon emissions to provide a more complete understanding of the carbon footprint of New York state. Future research should also focus on the development and forecasting of green energy use and the replacement of fossil fuels. The transition to renewable and sustainable energy sources is needed to achieve carbon neutrality, and additional studies should explore the potential impact of investing in green technologies and infrastructure on carbon emissions reduction.
Abbreviations
CLCPA $\ \ \ \ \ \ \ \ $Climate Leadership Community Protection Act
CCS $\ \ \ \ \ \ \ \ $Carbon Capture and Storage
BECCS $\ \ \ \ \ \ \ \ $Bioenergy with Carbon Capture and Storage
EPA $\ \ \ \ \ \ \ \ $Environmental Protection Agency
EIA $\ \ \ \ \ \ \ \ $Energy Information Administration
GHG $\ \ \ \ \ \ \ \ $Greenhouse Gas
NY $\ \ \ \ \ \ \ \ $New York
ELM $\ \ \ \ \ \ \ \ $Extreme Learning Machine
SVM $\ \ \ \ \ \ \ \ $Support Vector Machines
GM&SVM-ELM $\ \ \ \ \ \ \ \ $Grey Prediction Model optimized by SVM-ELM
MAPE $\ \ \ \ \ \ \ \ $Mean Absolute Percentage Error
MAE $\ \ \ \ \ \ \ \ $Mean Absolute Error
MSE $\ \ \ \ \ \ \ \ $Mean Square Error
IPCC $\ \ \ \ \ \ \ \ $Intergovernmental Panel on Climate Change
CO2 $\ \ \ \ \ \ \ \ $Carbon Dioxide
MMt $\ \ \ \ \ \ \ \ $Million Metric tons
P1 $\ \ \ \ \ \ \ \ $Pathway 1 High technology availability
P2 $\ \ \ \ \ \ \ \ $Pathway 2 Integrated pathway
P3 $\ \ \ \ \ \ \ \ $Pathway 3 Reference case pathway
HVAC $\ \ \ \ \ \ \ \ $Heating, ventilation, and air conditioning
LPG $\ \ \ \ \ \ \ \ $Liquid petroleum gas
LDV $\ \ \ \ \ \ \ \ $Light-duty vehicle
LDA $\ \ \ \ \ \ \ \ $Light-duty auto
LDT $\ \ \ \ \ \ \ \ $Light-duty truck
MDV/HDV $\ \ \ \ \ \ \ \ $Medium-duty vehicle/Heavy-duty vehicle
ZEV $\ \ \ \ \ \ \ \ $Zero -emission vehicle
Supplementary Information
The online version contains supplementary material available at https://doi.org/10.1007/s43979-024-00083-x.
Acknowledgements
This work was supported by the National Natural Science Foundation of China (51534005, 51278293and 51178262) and China Environmental Protection Foundation.
Authors’ contributions
EG performed the methodology employed in this study, allowing for accurate data collection. EG and JL carried out the experiment design and implementation. JL provided conceptualization and played a vital role in the project administration and supervision. The original draft was written by EG, who also conducted data analysis and diagramming. JL contributed significantly to the document's writing, reviewing, and editing process. All authors read and approved the final manuscript.
Funding
Shanghai Jiao Tong University provides open-access funding.
Availability of data and materials
All data generated or analyzed during this study are included in this published article.
Declarations
Ethics approval and consent to participate
Not applicable.
Consent for publication
All authors agree to the publication of this manuscript.
Competing interests
The authors declare no competing financial interest.
Publisher’s Note
Springer Nature remains neutral with regard to jurisdictional claims in published maps and institutional affiliations.
