
1 Introduction
Since the commercialization of lithium-ion batteries by Sony in 1991, they are now widely developed and utilized as energy sources of mobile electronic devices, electric vehicles and hybrid electric vehicles, relying on their high energy density, long cycle life and good theoretical safety. With the rise of the EV and HEV markets, the demand for lithium has increased dramatically, while the uneven distribution and limited reserves of lithium resources in the earth's crust have further triggered the fluctuating prices. Compared with lithium, sodium with high abundance is widely distributed in the earth's crust and sea, and have similar intercalation chemistry [1,2,3,4,5], which demonstrates great potential for application in stationary energy storage systems [6,7].
Today, research on sodium-ion batteries (NIBs) is growing every year, and their operating principle (Fig. 1a) is similar to lithium-ion batteries. The cathode material plays a vital role in reversible capacity, energy density and lifespan of sodium ion batteries. A broad range of compounds, including layered oxides [8,9,10,11,12,13], polyanion compounds [14,15,16,17], Prussian blue analogues [18,19,20], have been studied as potential candidates. Among them, layered oxide cathode materials are one of the most promising cathode materials for commercial application due to their appropriate operating voltage, high reversible capacity and facile synthesis [21]. Layer oxide cathode materials (NaxTMO2) are mainly divided into P2-type and O3-type cathode (Fig. 1b), the letters “P” and “O” represent the trigonal prismatic coordination environment and octahedral coordination environment of sodium ion, respectively; The number “2” and “3” refer to the number of oxygen stacking layers in one unit cell [22]. In general, O3-type cathode materials have sufficient Na content (x ~ 0.9-1.0) and deliver higher reversible specific capacity, which can be directly matched with anode materials to assemble full cells according to the initial coulombic efficiency (ICE) and reversible capacity of the materials. It is worth pointing out that the widely applied cathode materials of lithium ion batteries such as LiCoO2 and LiNixCoyMnzO2, are O3 type materials, if the O3 type cathode materials of SIBs can achieve the application, it will be able to achieve rapid large-scale production with the previous process for lithium ion battery. In contrast, P2-type materials are deficient in sodium content (x ~ 0.6-0.8), generally have low capacity with abnormal initial coulombic efficiency, and may require the additional sodium to achieve full-cell assembly. Therefore, O3-type materials are the most promising cathode materials for large-scale commercial applications [23]. In Table 1, the electrochemical performance of recent reported O3-type layered cathode materials for SIBs are presented. It is worth pointing out that O3-type materials require higher migration energy barriers due to the sodium ion migration through intermediate tetrahedral site between two adjacent octahedral sites (Fig. 1c) [21], compared to P2-type materials that can migrate directly between two adjacent trigonal prismatic sites (Fig. 1d). Thus, rate performance of O3-type materials is slightly lower than that of P2-type materials, which can be improved by reasonable adjustment of the crystal structure [24,25]. The Chinese HiNa has already achieved small scale manufacture of 18,650 cylindrical cells based on Cu-based O3-type material as cathode, with a gravimetric energy density of 135 Wh kg−1 and excellent high and low temperature performance [6,26]. Almost the same time, Ma’s group prepared 1 Ah soft-packed sodium-ion battery based on Ni-Fe-Mn based O3 cathode in 2016 [27] and they further achieved a capacity retention of 92.2% after 1000 cycles via using FEC-PST-DTD (FPD) as electrolyte additives [28].
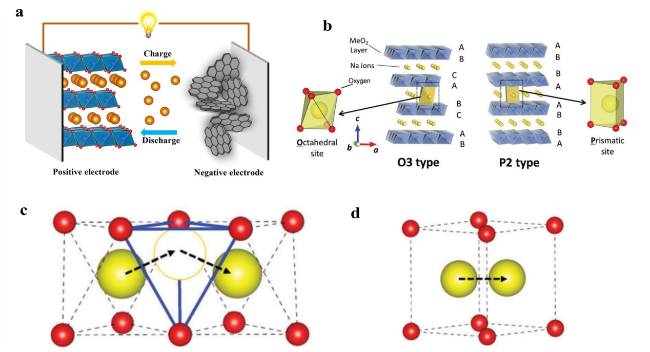
Fig. 1 a Working principles diagram of sodium ion batteries. b Schematic illustrations of crystal structures of O3 and P2 type NaxTMO2. Reproduced with permission [46]. Copyright 2014, American Chemical Society. c The indirect Na-ion diffusion path with the intermediate tetrahedron site in O-type frameworks. d The direct Na-ion diffusion path without the intermediate site in P-type frameworks. The red and yellow balls represent oxygen ions and sodium ions, respectively. Reproduced with permission [47]. Copyright 2016, Royal Society of Chemistry |
Table 1 Summary of the electrochemical performance of recent reported O3-type layered cathode materials for SIBs |
| Materials | Voltage windows(V) | Reversible capacity(mAh g−1) | Capacity retention | Ref |
|---|---|---|---|---|
| NaNi0.45Cu0.05Mn0.4Ti0.1O2 | 2-4 | 124 | 70.2% (500 cycles at 1 C) | [11] |
| NaFeO2 | 2.5-3.4 | 80 | 75% (30 cycles at 0.1 C) | [48] |
| Na4FeRuO6 | 2-4 | 120 | 80% (100 cycles at 2 C) | [49] |
| NaFeO2@C | 2-3.4 | 89.6 | 83.7% (100 cycles at 0.1 C) | [50] |
| NaMnO2 | 2-3.8 | 185 | 71.4% (20 cycles at 0.1 C) | [51] |
| NaMn0.6Al0.4O2 | 1-4 | 160 | 81% (100 cycles at 500 mA g−1) | [52] |
| Na1.2Mn0.4Ir0.4O2 | 1.5-4.4 | 179 | 60% (50 cycles at 0.5 C) | [53] |
| Na[Li0.05Mn0.50Ni0.30Cu0.10Mg0.05]O2 | 2-4 | 172 | 70.4% (1000 cycles at 20 C) | [54] |
| NaNiO2 | 1.25-3.75 | 123 | 94.3% (20 cycles at 0.1 C) | [55] |
| Na0.8Ni0.6Sb0.4O2 | 2-4.3 | 106 | 78% (100 cycles at 1 C) | [56] |
| Na0.7Ni0.35Sn0.65O2 | 2-4 | 64 | 80% (100 cycles at 0.1 C) | [57] |
| NaTi0.5Ni0.5O2 | 2-4 | 102 | 75% (300 cycles at 1 C) | [58] |
| Na0.8Ni0.3Co0.1Ti0.6O2 | 2-4 | 92 | 98% (1000 cycles at 5 C) | [59] |
| Na0.9Ni0.3Co0.15Mn0.05Ti0.5O2 | 2-4 | 112.7 | 81.6% (1000 cycles at 100 C) | [60] |
| Na3Ni2RuO6 | 2-3.8 | 130 | 81% (1000 cycles at 1 C) | [61] |
| Na3Ni2SbO6 | 2-4 | 120 | 70% (500 cycles at 2 C) | [62] |
| NaNi0.5Mn0.2Ti0.3O2 | 2-4 | 135 | 85% (200 cycles at 5C) | [63] |
| NaNi0.47Zn0.03Mn0.5O2 | 2-4 | 113 | 80% (150 cycles at 0.5C) | [64] |
| NaNi0.5Mn0.1Sn0.4O2 | 2-4.2 | 91 | 85% (200 cycles at 0.1 C) | [65] |
| MgO-NaNi0.5Mn0.5O2 | 2-4.2 | 167 | 75% (100 cycles at 0.5 C) | [66] |
| NaFe0.2Ni0.4Mn0.4O2 | 2-4 | 131 | 96.4% (30 cycles at 0.05 C) | [67] |
| NaFe0.3Ni0.35Mn0.35O2 | 2-4 | 130.3 | 80% (100 cycles at 1 C) | [68] |
| NaNi0.4Fe0.2Mn0.2Ti0.2O2 | 2-4.2 | 145 | 84% (200 cycles at 0.1 C) | [69] |
| Na0.85Li0.1Ni0.175Mn0.525Fe0.2O2 | 2-4.5 | 160 | 88% (100 cycles at 1 C) | [70] |
| NaNi1/3Fe1/3Mn1/3O1.99F0.01 | 2-4 | 122 | 85% (70 cycles at 1 C) | [71] |
| NaNi0.25Mg0.05Cu0.1Fe0.2Mn0.2Ti0.1Sn0.1O2 | 2-4 | 130.8 | 75% (500 cycles at 1 C) | [72] |
| Na0.94Ni0.29Cu0.1Fe0.16Mn0.3Ti0.15O2 | 2-4 | 122 | 79% (300 cycles at 0.5 C) | [73] |
| Na2SiO3@NaNi1/3Fe1/3Mn1/3O2 | 1.5-4.2 | 134 | 83.3% (200 cycles at 0.5 C) | [74] |
| ZrO2@NaNi1/3Fe1/3Mn1/3O2 | 1.5-4.3 | 152.4 | 81.9% (100 cycles at 1 C) | [75] |
| Na7/9Ni2/9Mn4/9Fe1/9Mg1/9Li1/9O2 | 2.0-4.4 | 170.5 | 71.8% (500 cycles at 5 C) | [76] |
O3-type cathode materials demonstrate great advantages in commercialization, but still face some inherent challenges. On the one hand, with the continuous extraction of Na, the O3-type cathode materials undergo a suite of complex multilevel phase transition involving different stacking sequences of the oxide layers [29,30]. For instance, the representative O3-type cathode material NaNi0.5Mn0.5O2, the phase transition in charge process in the voltage range of 2.2-4.5 V is corresponding to O3-O'3-P3-P'3-P3'' [31,32]. It should be noted that different stacking sequences have widely varying cell parameters, and multi-phase transitions can bring about large volume expansion and internal stresses, leading to the generation of microcracks within the bulk along with continuous electrolyte infiltration and corrosion, further resulting in poor mechanical integrity and capacity degradation [12]. Meanwhile, it needs extra energy barrier for phase boundary movement, leading poor rate capability [21]. On the other hand, the advantage of sodium ion batteries is low cost, so the preferential elements choice for cathode materials should be low cost, high abundance and easy access, such as Fe and Mn. However, Fe will inevitably migrate from the transition metal layer to the sodium layer during the charge-discharge process, which will impede the sodium ion transport and lead to capacity degradation [33,34]. Mn3+ has a strong Jahn-Teller effects, which will cause distortion of the crystal structure and further aggravate the irreversible phase transition [35,36]. Therefore, the components and valence states of the elements in the O3-type material need to be regulated reasonably in the application. It is worth mentioning that Fe-Mn based O3-type cathode usually have poor cyclic performance and large voltage hysteresis along with a series of impurity phase [37,38,39,40]. A large number of articles have pointed out that a small quantity of Ni can greatly improve these disadvantages [41,42,43,44]. In addition, poor air stability also limits the commercialization of O3-type cathode materials, which will increase production, transportation and storage costs. O3-type cathode materials are prone to spontaneous exchange of Na+ and H+ in ambient air, resulting in loss of bulk Na and insertion of water in the bulk [43,45]; Residual Na species on the particle surface will react with water and CO2 in ambient air to form sodium carbonate, sodium hydroxide etc., which are insulative to sodium ion transport, and excessive surface residual alkali will make the slurry gelation [46].
Currently, the modifications of O3-type cathode materials mainly include ion doping, surface modification and composite structure construction. The ion doping can well suppress the multilevel phase transition and regulate the working voltage; the surface modification can effectively protect the material from electrolyte corrosion and reduce the dissolution of transition metal ions; the composite structure construction can fully utilize the advantages of multiple phases and synergistically improve the comprehensive performance of the cathode material. A great deal of effort has been made to obtain outstanding electrochemical properties.
This review thoroughly summarized recent research progress in modifications of O3-type NaxNiyFezMn1-y-zO2 layered transition metal oxides, focusing especially on three challenges of irreversible phase transitions, migration of transition metal ions and Jahn-Teller effect, and poor air stability. Meanwhile, a detailed and comprehensive understanding of the intrinsic working mechanisms, structural evolution, and sodium ion storage electrochemistry is discussed. The structure-composition-performance relationship is also revealed. It will provide some inspiration for researchers to carry out studies for commercial application of O3-type cathode materials.
1.1 O3-type layered structure
1.1.1 O3-type NaxFeO2
Fe-based cathode materials show great potential for the battery applications due to low cost, high abundance in the Earth’s crust and nontoxic feature. α-NaFeO2 is an representative O3-type layer cathode, it delivers a reversible capacity of 80 mAh g−1 (0.33 mol Na extraction/insertion) along with a flat discharge platform about 3.3 V in the voltage range of 2.5-3.4 V [48], which is similar to that of isostructural LiCoO2 [34]. The electrode performance shows high relevance with cut-off voltage. When the cut-off voltage is surpassed to 3.5 V, the reversibility gradually decreases and polarization drastically increases. The α-NaFeO2 become almost completely inactive when about 0.7 mol Na is extracted. Komaba and co-workers [48] believed that the poor reversibility is resulting from irreversible structural transition and iron ion migration, thus hindering the Na+ re-insertion. Later, chen et al. [77] directly observed iron ion migration to Na layer at the atomic scale and presented the Fe migration from the OFe to TNa (tetrahedron site in the Na layer) is energetically favorable, which is also verified by DFT calculations (Fig. 2a, b). Recently, Chung and co-workers [78] investigated comprehensively the irreversible phase transition process when more than 0.5 Na is extracted in α-NaFeO2 (Fig. 2c). It is demonstrated that formation of Fe3O4 in the surface blocks Na insertion into the structure accompanied with oxygen release. More recently, Johnsonand co-workers [79] found that more than 20% of Fe4+ have spontaneous tendency to reduce back to Fe3+ in a charged state, accompanied by electrolyte decomposition, which is evidenced by exsitu Mössbauer spectroscopy (Fig. 2d). This self-discharge behavior can trigger rapid performance degradation and increase storage cost. Meanwhile, they also presented that desodiation process of α-NaFeO2 is accompanied by coherently nucleated O''3-Na1−xFO and m-Na1−xFO phases in 2.0-3.6 V, rather than to form P3 phase via layer gliding, which is common for most O3-type cathode, such as NaCrO2, NaCoO2 and NaNi0.5Mn0.5O2. The unique phase transition process may ascribe that tetrahedral Fe3+ in Na layer resist layer glide and lead to nonuniform extraction of sodium (Fig. 2e).
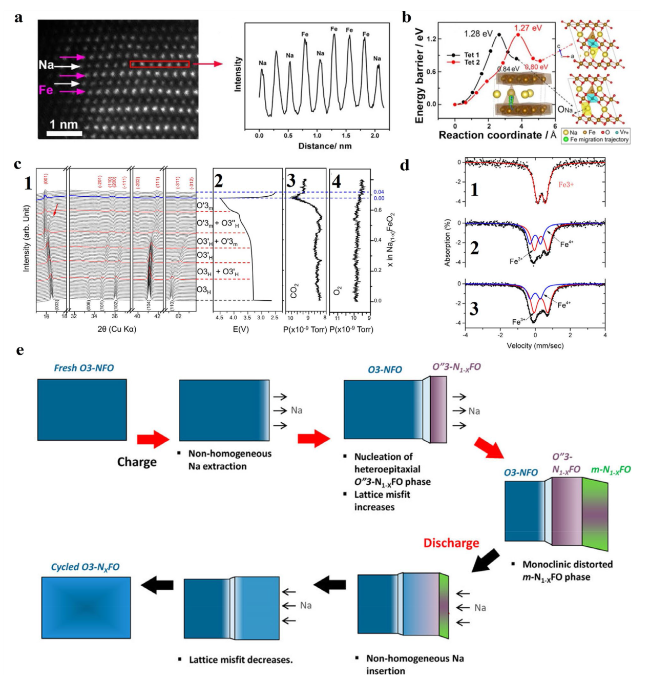
Fig. 2 a The HAADF images of NaFeO2 at the fully charged state and the corresponding line profile acquired from the red rectangular region. b Pathways for the direct Fe migration from the OFe to the TNa sites in Na0.33FeO2. The yellow, brown, red, blue and green balls in the structural schematic are for Na, Fe, O, VFe and the Fe migration trajectory, respectively. Reproduced with permission [77]. Copyright 2018, Elsevier B.V. c c1 In-situ synchrotron X-ray diffraction patterns of Na1−xFeO2 showing the characteristic hkl peak in different phases. c2 In-situ galvanostatic charge and discharge profiles at a rate of 0.05 C with a cutoff voltage of 4.5 V. The arrow indicates broadening of the (003) peak of O3’H. c3 and c4 CO2 and O2 gas evolution from NaFeO2 during sodium extraction and insertion. Reproduced with permission [78]. Copyright 2019, American Chemical Society. d Ex situ Mössbauer spectra for NaFeO2 electrodes a1 in the pristine state, a2 charged to 0.46 SOC, and a3 stored for 2 days under open circuit conditions after being charged to 0.5 SOC. e Schematic illustration of the proposed coherent phase evolution during electrochemical cycling of α-NaFeO2. Reproduced with permission [79]. Copyright 2015, American Chemical Society |
It is known that solvothermal method can make reactants more uniform in the solution, compared with the common solid state method. Specially, in the synthetic process of NaFeO2, reactive Na2O2 was usually used as sodium source rather than Na2CO3 owing to the latter usually easily to form tiny electrochemically inactive β-NaFeO2 [80]. Meanwhile, Na2O2 is highly sensitive to H2O and CO2 in ambient air. Thus, it increases difficulty in preparation. Tabuchi [81,82] et al. prepared high-crystallinity α-NaFeO2 via solvothermal method without Na2O2, it delivers improved cyclic performance compared to the solid state method. Xia [50] came up with a carbon-coated single crystal O3-NaFeO2 nanoflakes by facile solvothermal route with subsequent carbon-coated (Fig. 3a), which exhibits a high capacity of 89.6 mAh g−1 in the voltage range of 2.0-3.4 V and capacity retention of 87.3% after 100 cycles at 0.1C. In addition, carbon coated NaFeO2//hard carbon full cell also presented good cyclic performance with 81.9% capacity retention after 100 cycles.
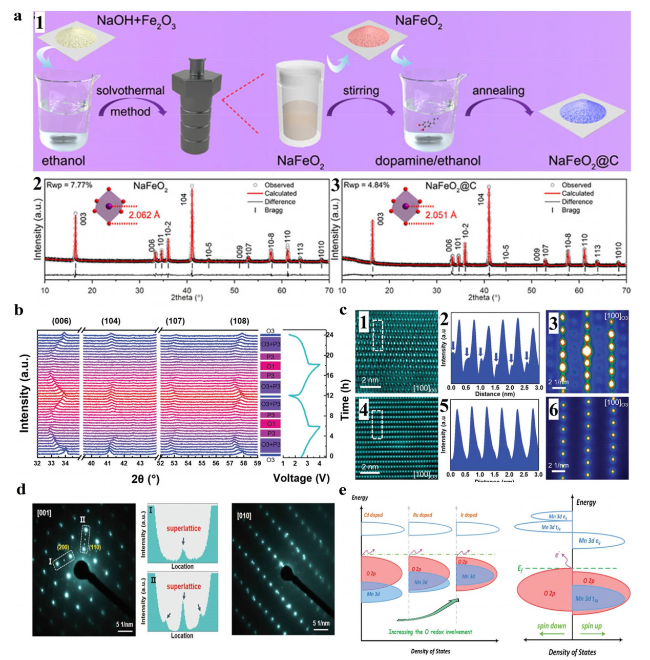
Fig. 3 a a1 Schematic illustration of the synthesis procedure of the NaFeO2 and NaFeO2@C samples. Rietveld-refined XRD patterns of the NaFeO2 a2 and NaFeO2@C a3 samples, respectively. Reproduced with permission [50]. Copyright 2021, Elsevier B.V. b In situ XRD patterns of the NFRO cathode under a current rate of 0.25C at voltage range between 1.5 and 4 V. c Atomic STEM-HAADF images of c1 NFO and c4 NFRO samples charging to 4 V; c2 Line-profile of selected area by dash line in c1, the blue arrow in c2 indicates the migration of Fe ions into Na layers; c5 Line-profile of selected area by dash line in c4; Nanobeam electron diffraction patterns of c3 NFO and c6 NFRO samples charging to 4 V. Reproduced with permission [49]. Copyright 2019, Wiley-VCH. d SAED patterns of sample viewed along the [1] axis and [10] axis, respectively, (I and II are the corresponding line-profiles of the marked regions in SAED pattern). Reproduced with permission [52]. Copyright 2021, Wiley-VCH. e Schematic illustration of the DOS for chosen potential doping species and Ir-doped Na1.2Mn0.4Ir0.4O2. The O-2p band and Mn 3d band are depicted in red and blue, respectively. The Cd Ru and Ir doped Mn-based Na-rich system has a tendency for increasing O redox improvement as the Mn 3d band increases from the deep part, which refers to a suppression of O2 release. Reproduced with permission [53]. Copyright 2019, Wiley-VCH |
Thermal stability and air stability are key component for future commercial applications, which is closely relevant to safety and storage performance. Nishida and co-workers [83] compared thermal properties of α-NaFeO2 and LiCoO2 counterparts by DSC measurements. The results indicated that fully-charged α-NaFeO2 presents better thermal stability in the electrolyte than LiCoO2 counterparts with higher exothermic onset temperature and less heat generation. Of note is that α-NaFeO2 have hygroscopic character and Na+ have spontaneous tendency to diffuse to the surface [48], leading to formation of electrochemically inactive phase, such as NaOH, Na2CO3. It drastically impedes their practical viability (gelation of the slurry) and decrease the electrochemical performance. Thus, it is essential to incorporate proper ion or surface coating to realize improved air stability. Nevertheless, the focus on air stability for NaFeO2 is still few.
Although α-NaFeO2 have been widely developed depending on the economic efficiency, high abundance, thermal stability, and high voltage platform, the cyclic performance is still unsatisfactory for potential application, which is closely relevant to Fe migration and irreversible phase transformation. Zhou and co-workers [49] reported an Ru-substitution Na4FeRuO6 cathode which exhibited a high reversible capacity of 120 mAh g−1 and superior capacity retention of 80% over 100 cycles based on reversible O3-P3-O1 phase transformation (Fig. 3b). In contrast, NaFeO2 severely decay to about 10 mAh g−1 after several cycles and presents an irreversible phase of O'3 and O''3. The larger size of Ru4+ effectively suppress the irreversible migration of Fe ions, which is clearly characterized on an atomic scale by HAADF-STEM (Fig. 3c). Then, the less Fe ion migration maintain the well structure integrality and decrease the local lattice strain, thus particle cracks was remarkably reduced. For all we know that particle crack is one of the main reasons for performance deterioration. Once the mass of cracks generates, the Na+ transport channel will be blocked and layer structure may be destroyed during long term cycling, leading to the battery failure eventually [12,84]. Thus, it is vital to reduce the micro-crack by proper strategy. In addition, Mg introduction to α-NaFeO2 also was demonstrated to greatly reduces migration of Fe ions and increases capacity and cycling stability [85]. Guo et al. prepared a new cathode NaFe0.45Co0.5Mg0.05O2 based on the synergetic effect of multi-metal ions, in which Fe3+ support the high redox potential, Co3+ can realize fast kinetics and Mg2+ show a pinning effect to stabilize the structure with compatible radii. It presented a discharge capacity of 140 mAh g−1 and superior capacity remain (about 95 mAh g−1) after 500 cycles at 1 C in 2.5-4.0 V. Meanwhile, the high-rate performance also is excellent, which delivers a capacity of 118.2 and 73.9 mAh g−1 at 5 C and 10 C, respectively. It can be explained by a wide capacity range (> 70%) of formed P3 and P'3 phases, in which prismatic paths can greatly enhance the Na+ migration compared with octahedral paths resulting from O3 phases [86,87]. The low Na+ migration barrier (0.22 eV) resulting from DFT calculation also support this opinion. Some other elements substitution such as Ni [88,89], Ti [90], Co [91,92] have been reported, but the electrode performance is still unsatisfactory in long term lifespan or average operating voltage.
1.1.2 O3-type NaxMnO2
Mn-based cathode have received great attention due to the low cost and high abundance [93,94]. NaxMnO2 with 2D structures have two polymorphs, which is classified into α-NaMnO2 (space group C2/m) and β-NaMnO2 (space group Pmnm) at low-temperature and high-temperature form, respectively [35,95,96]. α-NaMnO2 is monoclinic O3 layered structure owing to Jahn-Teller distortion of Mn3+ [51]. While β-NaMnO2 has a zigzag layer structure, which is made up of two edge-sharing stacks of the MnO6 octahedra and Na ion [97]. Thus, we will focus on the α-NaMnO2 in the article. O'3-type α-NaMnO2 as electrode materials, was first reported by Hagenmuller and co-workers [35] in 1985, there are reversible de/interealation at the Na content between 0.77 and 1.0 with large voltage hysteresis. It is due to high resistivity resulting from intrinsic semiconductor characteristic for α-NaMnO2, which is also evidenced from first principles computations [98].
In 2011, Ceder et al. [51] revisited the monoclinic α-NaMnO2, it delivers 185 mAh g−1 of reversible capacity at 0.1 C rate in the voltage range of 2.0-3.8 V, corresponding to 0.8 mol Na intercalated back. The charge-discharge curves have a character of muti-plateaus indicating different reaction paths with different intermediate phase. However, it only remains a capacity of 132 mAh g−1 after 20 cycles, mainly resulting from strong Jahn-Teller effect of Mn3+. According to crystal field theory, the Jahn-Teller effect is related to the distribution of transition metal d electrons in the energy level. In octahedral structure, the d orbits are divided into low-energy orbits t2g (dxy, dzx and dyz) and high-energy orbits eg (dz2 and dx2-y2). The electrons occupy the d orbits in the order of low to high energy. Three outermost layer electrons of Mn3+ occupy preferentially the orbit t2g and another electron occupies the dz2 or dx2-y2 orbits, which generally produce elongated or compressed distortions, leading to distortion of the layered structure. Such distortions are usually detrimental to structural stability and may be accompanied by Na+/vacancy ordering [22,99,100]. Thus, it is essential to regulate Jahn-Teller effect to improve the cyclic stability. Li et al. [52] designed a O'3-NaMn0.6Al0.4O2 cathode with queue-ordered superstructure (Fig. 3d). On the one hand, the special superstructure reinforces the layer structure and decrease the harmful effect from Jahn-Teller distortion. On the other hand, the Mn3+ migration from transition metal layer to Na layer is restrained. Thus, it delivers a modest capacity of 160 mAh g−1 and enhanced rate and cyclic performance, compared with the O'3-NaMnO2. In addition, the queue-ordered superstructure is demonstrated that it has the lowest energy and strengthen ionic bonds between Mn and O by DFT calculations, which can increase the structure stability during cycles, which further supports the improved cyclic performance. The anionic redox chemistry has been developed in Li-rich materials due to the additional capacity delivery along with higher energy. However, it usually accompanied with O2 release in the high voltage regions owing to the weak covalence bond from 3d transition metal. Zhou’s group [53] predicted that Ir doping in Mn-based cathode has the most favorable oxygen absorption and compared with Cd and Ru doping by DFT calculations, and increasement of Mn 3d band as well as large hybridization between Ir and O can effectively decrease O2 release (Fig. 3e). Based with the deduction, they prepared Na1.2Mn0.4Ir0.4O2 O3-type Na-rich materials, which delivers a capacity of 179 mAh g−1 in the voltage range of 1.5-4.4 V by employing cationic and anionic redox. The highly reversible O redox was confirmed by in operando Raman and XAS tests. It provides a new strategy to increase the capacity delivery for Mn-based cathode. Cho and co-workers [101] employ first-principles calculations to predict electrochemical performance for Na(Li1/3Mn2/3)O2 cathode. It shows high redox potentials (≈4.2 V vs Na/Na +) with high charge capacity (190 mAh g−1) resulting from the anionic redox reactions.
Moreover, multielement co-doping can also effectively improve the cyclic performance, average operating voltage, energy density and so on depending on synergistic effect. Deng [54] synthesized an air-stable Na[Li0.05Mn0.50Ni0.30Cu0.10Mg0.05]O2 cathode by coprecipitation method and proposed that Li and Mg are contributing to enhancement of electronic conductivity, Cu can improve the surface structure and regulate phase transition, leading an outstanding air stability, Inactive Mn and Li substitution can remain structure stability. It delivers a discharge capacity of 172 mAh g−1 and superior rate capacity up to 50 C. After 1000 cycles at 20 C, 70.4% capacity retention was maintained, which surpass many other reported O3-type cathode. The pouch cell assembled by this cathode/hard carbon delivers discharge capacity of 70 mAh g−1 and good stability. Recently, a O3-type Na0.5Mn0.65Ni0.15Al0.1Mg0.05Co0.05O2 nanoflower [102] was presented based on multi-metal synergetic mechanism, in which Al3+ and Mg2+ have a positive effect on structure stability, Co2+ can enhance rate capacity, Ni2+ and Mn3+ is mainly responsible for charge compensations. A capacity loss of only 0.018% in every cycle was realized after 1000 cycles at 1 C.
1.1.3 O3-type NaxNiO2
NaNiO2 is stable in two polymorphs: a low-temperature layered O3 structure with a monoclinic distortion, and a high-temperature rhombohedral phase. Monoclinic NaNiO2 (space group: C2/m) has been studied extensively owing to the relatively high voltage platform and redox reaction [103]. The structure is categorized as O'3 due to the Jahn-Teller effect of low spin of Ni3+ (t6 2 g e1 g), which is composed of alternately stacked Ni-O layer containing edge sharing elongated NiO6 octahedra and Na layer [104,105]. Ceder [55] investigated electrochemical deintercalation of sodium from NaNiO2 in 2012. It delivers a capacity of about 120 mAh g−1 in 1.25-3.75 V with multiple plateaus, corresponding to 0.52 mol Na back. The complex phase transitions O'3-P'3-P''3-O''3-O'''3 is confirmed by in situ XRD [103,106]. When cycle in 2.0-4.5 V, it shows significant capacity decline in several deintercalation/intercalation, which is due to the formation of an inactive phase at high voltage zone. Unfortunately, the phase can't be identified. Recently, to understand in depth the structural evolution along with irreversible capacity loss in high voltage, Wang et al. [107] visually observed the structural evolution process by in operando TXM-XANES. It exhibits a dissymmetric spatial distribution with a “core-shell” reaction mechanism and one irreversible phase (Na0.17NiO2) result in discrepant intercalation (Fig. 4a, b). The irreversible capacity loss is resulting from two regions, below 3.0 V and above 4.0 V. The former is caused by increased c spacing after the first charge process whereas it cannot shrink back. The latter are affirmed to owing to unrecoverable lattice distortion and possible electrolyte decomposition. Therefore, it is vital to adopt effective strategy such as cation-doping or optimizing cutoff voltage to obtain higher reversibility and structure stability.
It is worth pointing out that pristine NaNiO2 still shows inferior cycle stability and reversibility, and it is very hygroscopic against moist atmosphere, which slow down their practical application in sodium ion batteries. Many investigations have confirmed transition metal substitution have the positive effect in electrochemistry performance, such as Na0.8Ni0.6Sb0.4O2 [56,108], NaNi1-yCoyO2 [109,110,111], Na0.7Ni0.35Sn0.65O2 [57,112], NaNi0.5Ti0.5O2 [58,113]. Xu et at. prepared a Na0.8Ni0.6Sb0.4O2 cathode [56], delivering a capacity of 106 mAh g−1 at 0.1 C based on the Ni2+/Ni3+ redox couple along with a high average working voltage of 3.5 V, which is due to the reduced orbital hybridization between O 2p and M 3d. In addition, the phase evolution process was believed to simplified O3-P3 with small volume change (1.0%), thus shows an excellent cycling life, compared with NaNiO2 [106]. However, the rate performance is inferior may resulting from poor electronic conductivity. Trivalent cobalt also can suppress the cooperative Jahn-Teller distortion and enhance structure stability, whereas the content of cobalt haves to exceed 0.22 (NaNi1-yCoyO2). It is well-established that the price of cobalt is expensive and the distribution is uneven in the earth's crust. Overmuch cobalt addition will make Na-ion batteries lose competitiveness compared with Li counterpart.
Guo et al. [57] introduce Sn into Ni-based layered oxide, it shows the highest redox potential of 3.7 V among all O3-type cathode. It can be explained by electronic structure and molecular orbitals. Sn4+ ([Kr] 4d10) does not hybridize with O 2p orbitals due to no single d electrons. Orbital hybridization only exists in O 2p orbitals and Ni eg orbitals and charge delocalization is thus prevented in the metallic layer, leading to an increasement of Ni-O bond ionicity and Ni redox reaction. In contrast, other traditional transition metals (M') substitution such as Fe, Mn, O 2p orbital hybridization can simultaneously happen with both Ni eg and M' eg, thus the contribution from the Ni eg orbital became smaller, resulting in a relatively lower voltage. The charging and discharging curve is smooth and shows a considerably flat platform. Unfortunately, the reversible capacity is only 64 mAh g−1 in 2.0-4.0 V, which is relevant to internal Na-deficient (0.7).
It is confirmed that titanium as structure stabilizer can reduce the series of structural changes and increase the average potential, compared to half cells using NaNiO2 cathodes. The discharge curves of NaNi0.5Ti0.5O2 is composed of a slope and a platform rather than multistep potential curve [113]. Zhou’s research [58] demonstrated its good performance delivery with a reversible specific capacity of 102 mAh g−1 at 0.2 C and capacity retention of 75% at 1 C after 300 cycles in the voltage range of 2.0-4.0 V, which is well ahead of NaNiO2. The full-cell assembled by NaNi0.5Ti0.5O2/ pre-sodiated hard carbon delivers a reversible capacity of 93 mAh g−1 and good cyclic performance. However, the phase of NaNi0.5Ti0.5O2 is always accompanied by a small quantity of NiO about 7 mol %, which is inevitable regardless of all synthesis conditions. Recently, Zhou’s group [59] design a cation-mixing stabilized cathode (Na0.8Ni0.3Co0.1Ti0.6O2) by composition adjustment. It is verified that there is a typical phase transformation of O3-P3 in the first charge along with cation mixing. However, it unexpectedly maintains the P3 structure in the subsequent cycles (Fig. 4c), which is due to the TM ions in Na layers have a grasp effect on TM sheets. P3-type structure with trigonal prismatic sites can enable fast Na+ migration compared to the octahedral sites in O-type structure, thus can deliver great rate capability. In addition, the P3-type structure shows an extremely low lattice strain in desodiation and sodiation. Therefore, it delivers an excellent rate capability and superior capacity retention of 98% at 5 C after 1000 cycles. More recently, they presented reversibility of phase transition is highly relevant to oxygen vacancy concentrations and thus have a crucial role on electrochemistry performance [60]. The synthetic Na0.9Ni0.3Co0.15Mn0.05Ti0.5O2 sample in O2 atmosphere have abundant oxygen vacancies but the oxygen vacancy decreases in Ar atmosphere. The vacancy-rich sample process an irreversible phase transition of O3-P3. However, the vacancy-poor sample is a mixed phase containing O3 and partial P3 after cycling. In other words, it is irreversible process. Moreover, the electronic and ionic conduction are facilitated due to incorporation of oxygen vacancy. As expected, it shows the splendid rate capability (about 50 mAh g−1 at 100 C) and excellent cycling performance (capacity retention of 81.6% over 1000 cycles).
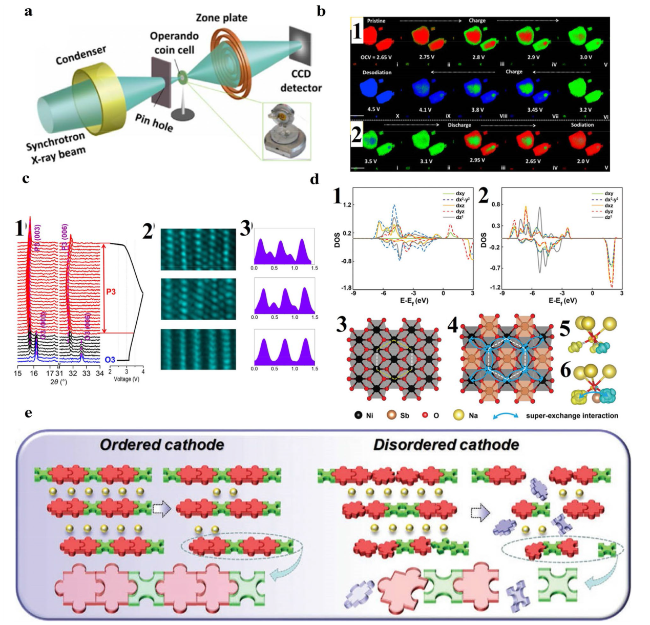
Fig. 4 a Schematic illustration of the TXM experimental setup. b b1 and b2 are the two-dimensional chemical phase mapping during the first charge and discharge process. Scale bar: 10 µm. Reproduced with permission [107]. Copyright 2017, Elsevier B.V. c c1 In-situ XRD patterns collected for NNCT electrode cycled in the voltage range of 2.0-4.0 V. The O3-type phase, biphase coexistence, and P3-type phase are represented by blue, black, and red colors, respectively. c2 STEM images of the pristine (bottom), fully charged (middle), and fully discharged (top) NNCT electrodes viewed along the [0 1 0] direction. c3 The corresponding line profiles of the STEM images. Reproduced with permission [59]. Copyright 2018, Elsevier B.V. d d1 and d2 The partial density of states (pDOS) of NaNiO2 and NaNi2/3Sb1/3O2. d3 and d4 The comparison of bond length of NaNiO2 and NaNi2/3Sb1/3O2 structure. d5 and d6 The spin difference charge density of NaNiO2 and NaNi2/3Sb1/3O2. Reproduced with permission [117]. Copyright 2019, Wiley-VCH. e Schematic diagram showing that the ordered arrangement of transition metal (TM) in layered oxide could provide a more stable structure for long-term (de)intercalations of Na + in comparison with that of the disordered arrangement. Reproduced with permission [61]. Copyright 2020, Wiley-VCH |
Recently, the new material families of Na3Ni2XO6 (X = Sb, Bi, Ru, etc.) are presented owing to the superior structure stability and long lifespan [61,62]. Unlike disordered Ni-based layer oxides, the Ni2+ and X5+ are preferably formed an ordered distribution within the transition metal layers due to the unique proportion (2:1) and notably different ionic radius, thus usually form honeycomb layered structure with ordered superlattice [114,115], where each XO6 octahedron is surrounded by six edge-sharing NiO6 octahedra in the “ab” plane. It is worth pointing out that there are some weak reflections around 2θ = 20° in the XRD pattern based on the C2/m model, which is different from the diffraction peaks resulting from O3-type structure [116]. Honeycomb-layered Na3Ni2SbO6 was first applied for an cathode in 2014 [62], it shows a capacity of about 120 mAh g−1 based on Ni2+/3+ redox couple along with an average high working voltage at 3.3 V. Meanwhile, the rate and cyclic performance are superior compared to the NaNiO2. However, the underlying mechanism is still not clear. Recently, Guo’s group [117] revisited the NaNi2/3Sb1/3O2 and presented that ordered Ni6-rings with super-exchange interaction form symmetric atomic configuration and degenerate electronic orbital in layered oxides (Fig. 4d), thus enhancing the structural stability in terms of air, thermal and phase stability, which is also supported by DFT calculations. In addition, the redox potential was increased and phase-transition process became simply compared with pristine NaNiO2. Zhou’s group developed the superlattice-stabilized layered oxide cathode (Na3Ni2RuO6) [61], which shows an ultralong voltage platform and a high discharge capacity of 130 mAh g−1 along with reversible O3 to P3 phase transition. Meanwhile, it also presents excellent capacity retention (81%) after 1000 cycles with cation-migration-free. So stable structure can be explained visually by a “puzzle model”. TM ions can generate an interactive force resulting from ordered honeycomb-type arrangement, thus modify the crystal strain and remain the structural integrity during the numerous desodiation and sodiation (Fig. 4e). However, due to the price of raw material (RuO2) is very expensive and abundance is low (only 0.001 ppm in the earth's crust), so it may be not suitable for large-scale commercial application.
1.1.4 O3-type NaxNiyMn1-yO2
NaNi0.5Mn0.5O2 is a typical O3-type layered cathode, which was first developed by Komaba [32] in 2009. It shows great potential to achieve commercial application relying on high discharge capacity resulting from Ni2+/3+/4+ redox couple, low cost for inactive Mn4+ and facile synthesis. It is worth pointing out that there is not almost cation mixing in NaNi0.5Mn0.5O2 due to the comparatively different ion sizes of Na+(1.02 Å) and Ni2+(0.69 Å), compared to the Li counterpart LiNi0.5Mn0.5O2 which containing Li+/Ni2+ disordering, thus making sure the better ion transfer [118]. In the voltage ranges of 2.2-3.8 V, it delivers a high reversible capacity of 125 mAh g−1 at the current density of 4.8 mA g−1. When the upper voltage is 4.5 V, a capacity delivery of 185 mAh g−1 is realized, but the capacity deteriorated only after 20 cycles. The charging and discharging curve contained several potential plateaus resulting from sliding of slabs and Na+/vacancy ordering [119]. A structure evolution of O3-O'3-P3-P'3-P''3 was determined by ex situ X-ray diffraction [31]. Komaba presented fluorinated ethylene carbonate [120] as an electrolyte additive can effectively improve coulomb efficiency and cycling stability owing to the passivation and suppression of side reactions. The full cell NaNi0.5Mn0.5O2 /hard carbon delivered a high capacity over 200 mAh g−1 (based on negative electrodes) along with operating voltage of about 3 V. Even though the current density is 300 mA g−1, it remains an almost similar capacity. Another full cell employed with Sn-C as anode [121] presented a high energy density of 300 Wh kg−1 with good retention, further confirms commercial potential of NaNi0.5Mn0.5O2.
Although NaNi0.5Mn0.5O2 cathode materials show excellent superiority, some shortages have to be overcame for commercialization progress. Multiple phase transformation not only induce stepwise plateaus leading an unstable power export, but also disturb diffusion of sodium owing to the TM ions in different sites, leading terrible rate and cyclic performance [21,94]. Thus, suppressing phase transition and extending solid solution zone by appropriate elements addition can effectively alleviate the above problems. In addition, the intrinsic hygroscopic is also a crucial factor to hinder their commercial application, which will increase production and storage costs along with performance degradation. The Na-deficient phase is formed due to the spontaneous Na+/H+ exchange in ambient air [122,123]. Meanwhile, some insulating alkaline species such Na2CO3 and NaHCO3 on the surface of bulk particle can decrease capacity delivery and trigger gelation of the slurry [124,125,126]. Proper elements substitution and surface modification can improve the problem.
Wang et al. [63] apply partial Ti to replace Mn in NaNi0.5Mn0.5O2. Due to the similar ionic radius and same valence, it still maintained O3-type structure along with homogeneous distribution after introduction of Ti. Series of sodium-sufficient O3-NaNi0.5Mn0.5-xTixO2 (0 ≤ x ≤ 0.5) materials was investigated and it can be concluded that NaNi0.5Mn0.2Ti0.3O2 cathode delivers the best electrochemical performance, which presents a high discharge capacity of 134 mA h g−1 at 0.05 C in 2.0-4.0 V along with 85% capacity retention at 1 C after 200 cycles based on Ni2+/Ni3+ active redox couple. Meanwhile, the charge/discharge profiles become smoother and plateau potential is increased. The desodiation and sodiation process is corresponding to O3 − P3 transition via gliding of the TMO2 layers (Fig. 5a). In other words, the Ti incorporation in O3-type NaNi0.5Mn0.5O2 suppress the multiple phase transformation and decrease of the energy barrier for the two-phase conversion, leading a highly reversible phase transition along with excellent rate and cyclic performance. Komaba et al. [127] presented Mg and Ti co-substituted cathode Na[Ni4/9Mn1/3Mg1/18Ti1/6]O2, which delivers a better capacity of 200 mAh g−1 without any capacity loss due to substitution and enhanced cyclic performance in the voltage range of 2.2-4.5 V. In contrast to the NaNi0.5Mn0.5O2, it demonstrates delayed O3-O'3 transition and decreased lattice parameter mismatch between O3 and P3 phases, resulting in gradual structural changes along with smoother curves. Furthermore, an OP2-like P-Oe-Of intergrowth phase as an intermediate buffer phase effectively suppress the dramatic shrinkage in interslab spacing, leading a high reversibility of structure (Fig. 5b). After cycling, the surface of Mg and Ti co-substituted cathode is as smooth as pristine, but the surface deterioration is significant for NaNi0.5Mn0.5O2. Hong and co-workers [128] demonstrated that Al-doped effectively facilitate Na+ mobility and improve structural stability due to increasement of the interslab distance resulting from stronger Al − O bond. O3-NaAl0.02Ni0.49Mn0.49O2 presented a high capacity retention of 63.2% after 200 cycles at 1 C along with coulombic efficiency of over 99% in the voltage range of 2.0-4.0 V. Recently, Zn2+ doping [64] is verified that can not only enhance electrochemical reversibility in the high voltage range of 4-4.2 V, but also improve air stability. The O3-NaNi0.47Zn0.03Mn0.5O2 cathode presents a reversible capacity of 113 mAh g−1 at 0.5 C and good capacity retention. It is worth mentioning that a small volume change of approximately 2.00% in the voltage range of 2-4 V was demonstrated. Meanwhile, the average sodium ion diffusion coefficients of Zn2+ doping cathode is 2.22 × 10⁻¹⁰ cm2 s−1, which far beyond the pristine sample (1.37 × 10⁻¹² cm2 s−1). Tarascon [65] replaced Mn4+ by a non-transition metal ion Sn4+, preparing a series of NaNi0.5Mn0.5−ySnyO2 (y = 0-0.5). It is believed that Sn4+ substitution could reduce orbital overlap, favor charge localization in the metallic layer and increase bond ionicity, resulting in higher redox potential. Moreover, destabilization of P3 phase could suppress the phase transition from O3 to P3 due to increasing the ionic nature of the crystal lattice. Thus, it is a promising strategy to simultaneously increase the redox voltage and delay the phase transition. The fully substituted NaNi0.5Sn0.5O2 phase shows a high redox potential of ≈3.2 V with a single-phase transition from O3 − P3. When y = 0.4, NaNi0.5Mn0.1Sn0.4O2 cathode delivers a capacity of 91 mAh g−1 and superior capacity retention (85% after 200 cycles). However, H2O insertion is present after Sn4+ substitution due to the increased interlayer distance, the application has been limited a certain extent.
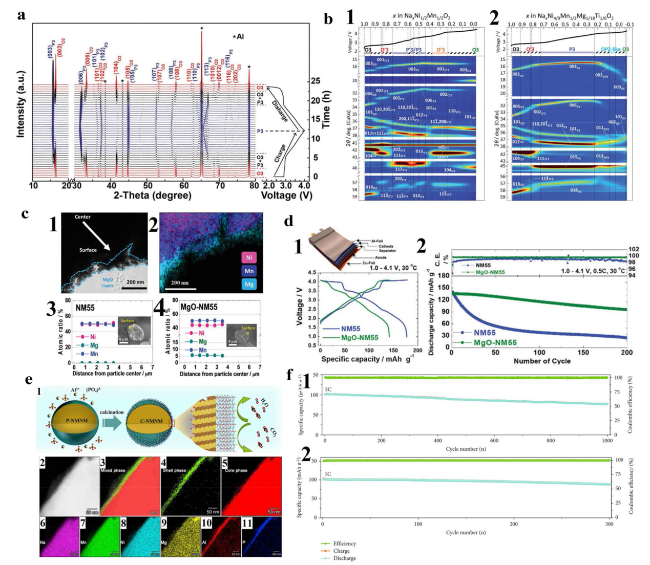
Fig. 5 a In situ XRD patterns collected during the first charge/discharge of the Na/NaNi0.5Mn0.2Ti0.3O2 cell under a current rate of 0.05 C at voltage range between 2 and 4 V. Black asterisks represent peaks from Al window. Reproduced with permission [63]. Copyright 2017, Wiley-VCH. b Contour plots of operando XRD patterns for b1 Non-sub and b2 Mg-Ti-sub electrodes during 1st charging to 4.5 V. Reproduced with permission [127]. Copyright 2021, Royal Society of Chemistry. c c1 Bright field TEM image and c2 corresponding EDS mapping of MgO-NM55. EPMA results of c3 NM55 and c4 MgO-NM55 cathodes. Inset images display the cross-sectional SEM images of NM55 and MgO-NM55 particles, respectively. d Electrochemical performances of pouch-type NM55/hard carbon and MgO-NM55/hard carbon full cells: d1 initial charge-discharge voltage profiles at 15 mA g−1 and d2 coulombic efficiency and long-term cycling stability test at 0.5 C-rate (75 mA g−1). Reproduced with permission [66]. Copyright 2018, Royal Society of Chemistry. e e1 Schematic illustration of the synthetic process for the AlPO4 coating on the surface of Na[Li0.05Mn0.50Ni0.30Cu0.10Mg0.05]O2. e2 High-angle annular dark field (HAADF)-STEM image. STEM-EDS mapping of crystalline phase: Mixed phase of C-NMNM e3, AlPO4 shell phase e4 and core phase of Na[Li0.05Mn0.50Ni0.30Cu0.10Mg0.05]O2 (e5). (e6-e11) Element Na (e6), Mn (e7), Ni (e8), Mg (e9), Al (e10) and P (e11) distributions from the edge to the bulk material of C-NMNM. Reproduced with permission [129]. Copyright 2019, Cell Press. f f1 Cycling performance during 1000 cycles at 5C after performance tests at various rates. f2 Electrochemical performance of full-cell system Cycling performance during 300 cycles at 1C. Reproduced with permission [134]. Copyright 2020, American Association for the Advancement of Science |
Surface coating is considered an effective way to suppress the unfavorable side reactions during cycling and remain structure stability. Hwang [66] prepared MgO coating NaNi0.5Mn0.5O2 with partial Mg doping. The coating layer of 70-100 nm formation on the particle surface effectively prevent the bulk particle HF erosion. Meanwhile, Mg2+ incorporation into the transition metal (TM) layers reduce the extent of the irreversible multiphase transformation (Fig. 5c). In the voltage range of 2.0-4.2 V, the MgO coating NaNi0.5Mn0.5O2 shows improved capacity retention of 75% after 100 cycles at 0.5 C, though the discharge capacity slightly decreases due to the inactive MgO. The pouch-type full cells were assembled with MgO coating NaNi0.5Mn0.5O2 and hard carbon, delivers excellent capacity retention of 70% after 200 cycles at 1.0-4.1 V (Fig. 5d). Zhang [129] performed a surface modification process by a rotary evaporator, which make AlPO4 protective layer uniformly deposit on the cathode material (Fig. 5e). It can protect bulk particle from corrosion of electrolyte, decrease transition metal dissolution, and remain crystal structure. Meanwhile, it can protect the anode from increased resistance by suppressing the dissolution-migration-deposition process. The half-cell and full-cells show excellent cycling lifespan (95% after 400 cycles at 1 C, 78% after 200 cycles at 1 C, respectively) (Fig. 5f). In addition, the protective layer can further improve its environmental stability. Atomic layer deposition (ALD) technology is an effective way to realize surface coating at atomic scale with a precise and uniform thickness control, have been widely applied in many energy storage systems [7,130,131,132]. Yang [133] prepared thin Al2O3 coating (about 3 nm) NaNi0.5Mn0.5O2 via ALD, which presents an excellent capacity retention of 68.0% after 300 cycles at 0.5 C, along with improved rate capability. In addition, the air sensitivity test was performed and showed more stable structure compared to the pristine sample. There is obvious impurity and hydrated compounds formation in the uncoated sample by XRD analysis. So, the Al2O3 layer effectively avoid the direct contact of ambient atmosphere, leading less degradation (Fig. 6a). Although the cyclic performance of layer cathode is obviously improved, it's essential to point out that most of coating layers are electrochemically insulated and discharge capacity is decreased, leading a lower energy density to a certain extent.
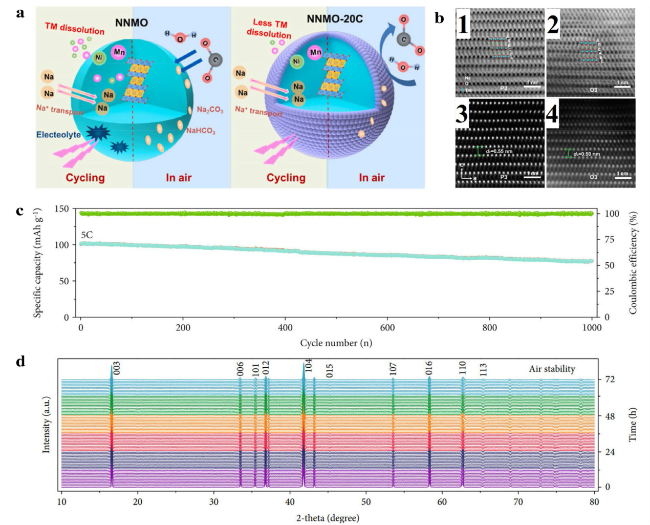
Fig. 6 a Schematic illustration of the advantages for the Al2O3-surface modification in stabilizing the surface and bulk structure of the NNMO cathode. Reproduced with permission [133]. Copyright 2019, Elsevier B.V. b ABF-STEM images of water-soaked (b1) NaNM and (b2) NaNCMT. HAADF-STEM images ofwater-soaked (b3) NaNM and (b4) NaNCMT. Reproduced with permission [11]. Copyright 2018, American Chemical Society. c Cycling performance during 1000 cycles at 5C after performance tests at various rates. d In situ XRD patterns of air-exposure stability test for three days (the different colour regions stand for the different air-exposure stages). Reproduced with permission [134]. Copyright 2020, AAAS |
Hygroscopic characteristic is a crucial factor to hinder their commercial application. The spontaneous Na+/H+ exchange is easily happened in the O3-type NaNi0.5Mn0.5O2 cathode in ambient air [122,123]. As the interlayer spacing become larger due to the increased repulsion between adjacent oxide layers, more Na+ are extracted, eventually resulting in a Na-deficient phase and deteriorative electrode performance[21]. Meanwhile, some insulating alkaline species on the surface of bulk particle are formed [124,125]. On the one hand, they decrease capacity delivery and deteriorate rate and cyclic performance. On the other hand, they will trigger defluorination of polyvinylidene fluoride (PVDF) binder, then cause the gelation of the slurry and rough surface, impeding their practical viability [135]. Surface coating strategy can avoid cathode exposing in ambient air containing H2O and CO2 to a certain extent. But it is usually accompanied by decreased energy density. Yao [11] designed an air-stable O3-type cathode NaNi0.45Cu0.05Mn0.4Ti0.1O2 by Cu/Ti co-substitution, in which Cu has comparable electronegativity and Ti has substantial difference in Fermi level compared to the Ni2+/Mn4+, resulting in contractions of Na layers and increasement of the valence state of Ni. After exposed to air for 2 days, the structure is not almost changed and even retains its structure after being soaked in water (Fig. 6b). In contrast, O’3 and P3-type Na1−yNi0.5Mn0.5O2 phase arose just after 2 h for NaNi0.5Mn0.5O2 cathode resulting from spontaneous Na+ extraction and insertion of H2O molecules. In addition, NaNi0.45Cu0.05Mn0.4Ti0.1O2 still shows high capacity retention after aging experiments. The Cu/Ti co-substitution cathode shows higher reversible capacity along with smoother discharge/charge curves and significantly enhanced cyclic performance (70.2% of capacity retention after 500 cycles). The phase transition was determined by in situ XRD, corresponding to highly reversible O3-P3 evolution, thus Cu/Ti co-substitution also effectively suppressed complex multistage evolution. Xiao [134] incorporate Mg2+ into the NaNi0.45Cu0.05Mn0.4Ti0.1O2 cathode. The NaNi0.40Cu0.05Mg0.05Mn0.4Ti0.1O2 cathode presents outstanding capacity retention of 76.4% after 1000 cycles at 5 C and a stable midpoint voltage (Fig. 6c). Meanwhile, the O3-type phase could be maintained after 3 days (Fig. 6d). Zheng [136] demonstrated that ethanol washing can remove most of the alkaline species such as Na2CO3 and NaHCO3 and remain original NaNi0.5Mn0.5O2 structure.
1.1.5 O3-type NaxNiyMnzFe1-y-zO2
Although O3-type Ni-Mn based oxides are superior to other oxides, but their practical application is limited by irreversible multiple phase transformation and hygroscopic characteristic. The frequent irreversible phase transitions are mainly due to the lack of shielding by the electrostatic repulsion of lattice oxygen and the gliding of transition metal layers. The hygroscopic characteristic is mainly related to the excess surface residual alkali and the large layer spacing, resulting in the insertion of water into the layered structure. In addition, the price of nickel is also rising year by year, which may trigger higher raw material costs, and it is necessary to properly reduce the Ni content and use low-cost element substitution. Among many elements, Fe has the advantage of low cost and the ionic radius is similar to Ni and Mn, which may be easily introduced into the NiMn-based material to reduce layers gliding. Yuan [67] prepared a serious of Fe-substituted NaNi0.5Mn0.5O2 cathode materials. It is confirmed that Fe substitution to Ni-Mn layered oxide not only could effectively suppress the suppression of MO2 gliding and Na/vacancy ordering resulting in reversible O3-P3 transformation, but also could expand the interslab distance which leads to fast ionic diffusion. The O3-type NaFe0.2Mn0.4Ni0.4O2 showed smoother the charge/discharge profiles compared with NaNi0.5Mn0.5O2 and remarkably improved cycle stability with a capacity retention of 96.4% after 30 cycles in a voltage range of 2.0-4.0 V. A superior reversible capacity of 133, 133, 131, 125, 120, 112, 100, and 86 mAh g−1 at current rates of 0.05, 0.1, 0.2, 0.5, 1, 2, 5 and 10 C (1 C = 240 mA g−1) were also delivered. Furthermore, in the high voltage range (> 4.0 V), the O3-type NaFe0.2Mn0.4Ni0.4O2 undergo a different OP2 phase transformation with smaller interslab distance (5.13 Å) than the P3'' phase in NaNi0.5Mn0.5O2 (5.72 Å), which effectively restrain co-insertion of the electrolyte solvent, leading improved cyclic performance. Sun et al. [137] proposed that with Fe contents increasement in the Ni-Fe-Mn based materials, the electrode exhibits more stable cyclic performance and perfect thermal stability although the reversible capacity slightly decreases. This further proves that addition of Fe has a positive effect on stabilization on crystal structure. Based on the DFT calculations, Guo et al. [68] proposed Fe3+ with slightly larger radius is introduced into NaNi0.5Mn0.5O2 could enlarge transition metal layers and facilitate electronic delocalization. The phase transformation process of the NaFe0.3Ni0.35Mn0.35O2 is single O3 − P3 without any monoclinic distortion (Fig. 7a). The capacity retention ratio of NaFe0.3Ni0.35Mn0.35O2 could reach 80% after 100 cycles at 1 C (1C = 240 mA g−1) within 2.0 − 4.0 V voltage range and the rate performance were also obviously enhanced. In addition, the air stability of Ni-Fe-Mn based materials was effectively improved and it remained the O3 crystal structure after exposed to air for 1 day which was verified by directly at atomic-scale by ABF-STEM. Due to the excellent performance and lower price of Ni-Fe-Mn based material, the commercialization process is also advancing, Ma's group [27] realized kilogram-scale production of NaFe1/3Ni1/3Mn1/3O2 material by co-precipitation method and following calcination, which widely used in the production of layered oxide cathode materials for lithium-ion batteries. Meanwhile, they successfully prepared 1 Ah soft-packed batteries using NaFe1/3Ni1/3Mn1/3O2 and hard carbon as cathode and anode, respectively. It remains outstanding long term cycling performance with capacity retention over 73% after 500 cycles between 1.5 V and 3.8 V at 1C rate (Fig. 7b). The corresponding XRD diffraction pattern is almost same as the initial sample, further demonstrating its excellent structural stability. Afterwards, they used optimized electrolyte [28] (1 M NaPF6 in 1:1 PC-EMC with 2wt% FEC, 1wt% PST, and 1wt% DTD) to enhance the long cycling life with 92.2% capacity retention after 1000 cycles at 1C. On the one hand, the PST and DTD additives can produce more organic molecular moieties, resulting in a burly SEI on the anode, thus irreversible reduction (decomposition) of the electrolyte solvents could be restrain. On the other hand, transition metal ions could combine with decomposition products such as RSO3−, ROSO3− and SO32− anions to form insoluble transition metal sulfates or sulfites, resulting in a dense and thick CEI, which will reduce dissolution of transition metal ions (Fig. 7c).
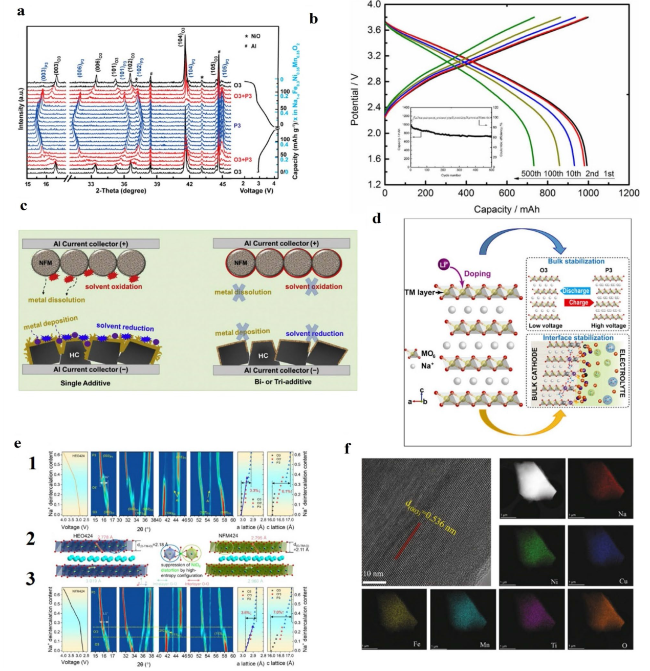
Fig. 7 a In situ XRD patterns of NaFe0.3Ni0.35Mn0.35O2 tested within 2.0 − 4.0 V, in which the black and blue scales (right) represent capacity and corresponding x value in Na1−xFe0.3Ni0.35Mn0.35O2, respectively. Reproduced with permission [68]. Copyright 2019, American Chemical Society. b The voltage profiles of a 1 Ah soft-packed sodium ion battery cycled between 1.5 V and 3.8 V at 1 C rate. Reproduced with permission [27]. Copyright 2019, Electrochemical Society, Inc. c Schematic summary on the role of PST and DTD additives in HC/NFM full cell. Reproduced with permission. [28] Copyright 2018, Elsevier B.V. d Dual-stabilization effect of the cation dopants on the evolution of bulk structure and electrode-electrolyte interphase of a Li-substituted O3-type cathode. Reproduced with permission [70]. Copyright 2018, Cell Press. e Structural evolution during the initial charge process. 2D contour plots of in situ XRD during the structural evolution of HEO424 e1 and NFM424 e3 cathodes. e2 Schematic illustrations showing the TMO2 slabs in both cathodes. The first charge curves as a function of Na+ deintercalation content are plotted on the right, and the a/c-axis lattice parameter changes in the as-prepared samples obtained by fitting the in situ XRD data are plotted on the left. Reproduced with permission [72]. Copyright 2022, American Chemical Society. f HRTEM image and EDS mapping of NNCFMTO sample. Reproduced with permission [73]. Copyright 2021, Elsevier B.V |
Generally, Ni-Fe-Mn-based materials exhibit good cycling performance, but significant performance deterioration along with structure monoclinic distortion often occur in the high voltage region (> 4.0 V), while the plateau voltage needs to be increased to obtain higher energy density for practical applications. In addition, dissolution of transition metal ions and side reactions between active materials and electrolytes occurs during cycles, leading to loss and fracture of active material. For the above problems, ion doping, surface modification and composite structure construction are effective strategies.
1.1.6 Ion doping
The ion doping can modulate the crystal structure and make the phase transition highly reversible, while the dopant ions can combine with oxygen ions to form stronger chemical bonds, increasing the solidity of the layered structure. The Ti instead of Mn not only increases the lattice spacing, but also can lift the working potentials [69], which delivered improved cyclic performance (capacity retention of 84% after 200 cycles at 0.1C) and higher energy density of about 460 Wh kg−1. Ding and co-workers [138] realized atomic-level mixing of Ti in Ni-Fe-Mn based materials by sol-gel method. The Na[Ni0.4Mn0.4Fe0.2]0.95Ti0.05O2 showed excellent rate capacities of 160.7, 132.1, 125.1, 120.9, 114.7 and 99.6 mAh g−1 at 0.1, 0.2, 0.5, 1.0, 2.0 and 5.0 C at 2.0-4.0 V, respectively (1C = 140 mA g−1) due to the larger parameter c from Ti introduction. The corresponding capacity retention also increased from 69.6% (NaNi0.4Mn0.4Fe0.2O2) to 83.8% after 200 cycles at 1 C. In addition, it is verified that the irreversible multiphase transformation of the P3 to O3 phase was effectively restrained. Recently, Park [139] confirmed the energy barrier of Na+ migration decreased after Ti substitution into O3-type NaFe0.25Ni0.25Mn0.5O2 based on DFT calculations.
The main factors limiting the performance of O3 Ni-Fe-Mn based layered oxide materials are migration of transition metal ions and irreversible phase change at high voltage. The transition metal ions in TM layer migrate to adjacent Na layer, hindering the transport of sodium ions. In a high cut-off voltage (> 4 V), with most Na+ extracting from the unit cell, the layer structure tends to glide and distort, leading irreversible phase transformation, which is accompanied by large variation of the lattice volume and a fast capacity attenuation. Sun [140] proposed Li introduction into the transition metal layer could remain structure stability due to stronger Li − O bond relative to Ni − O and Mn − O bonds and the migration of Fe3+ could be restrain. In addition, electronic conductivity, capacity, its retention, and rate capability were improved after Li incorporation. Guo [70] put forward the dual-stabilization effect of Li substitution in high-voltage in detail. One is unfavorable P3-P'3 phase transition at high voltages (> 4.2 V) was suppressed due to the weak Jahn-Teller distortion of Ni3+. The other is Li may bond with F− anion, leading a stable electrolyte-cathode interphase, which is useful for less transition metal ions dissolution (Fig. 7d). Thus, the Li doped sample Na0.85Li0.1Ni0.175Mn0.525Fe0.2O2 displayed a high discharge capacity of 160 mAh g−1 at 0.1 C at the voltage of 2.0-4.5 V and excellent capacity of 88% after 100 cycles at 1 C. It is well-established that Mn3+ ions are accompanied by strong Jahn-Teller effect, which seriously damage the structural stability and the cyclic performance. By suitable element doping, the content of Mn3+ can be reduced and thus the structural stability can be improved. Liu [141] prepared O3-NaMn0.48Ni0.2Fe0.3Mg0.02O2 materials, which showed lower Mn3+ and minimize Jahn − Teller effect, leading outstanding structure stability. The reversible capacity almost has no attenuation after 100 cycles at 0.1 C in the voltage range of 1.5-4.2 V (the capacity retention of NaMn0.5Ni0.2Fe0.3O2 is 81%). Huang [71] proposed that F-doped result in a lower Mn3+ content, which stabilize the O3-type layered structure. However, the discharge capacity has little decrease. So, it is crucial to have balance for cyclic performance and reversible capacity. In addition to the elements mentioned above, Ca [142], Al [143] and Zn [144] were proved to have remarkable enhancement on rate capability, cycling stability and reversible phase transformation.
Co-doping of multiple elements are an effective strategy to obtain a sample with excellent overall performance, such as high thermal stability and fracture toughness, splendid low temperature performance, high strength and air stability [145,146,147]. In the layered oxide cathode, Ni2+, Fe3+ and Cu2+ could provide charge compensation for high capacity delivery, Mg2+, Mn4+ and Ti4+ have positive effect on structure stability, Sn4+ and Sb5+ could raise the average voltages of the materials, which increase energy density. Co3+ has electrochemical activity and may counter the Jahn − Teller effect of Mn3+, leading to good structure stability. Hu’s and co-workers [72] employed high-entropy configuration strategy to design O3-type NaNi0.25Mg0.05Cu0.1Fe0.2Mn0.2Ti0.1Sn0.1O2 oxide. It was proposed that the multicomponent transition metal ions strengthen the whole skeleton structure of layered oxides by weaker Jahn − Teller distortion, Na+/vacancy ordering, and lattice parameter changes (Fig. 7e). Meanwhile, the TMO2 slabs were expanded to make sure faster ion transport, compared to the baseline sample (NaNi0.4Fe0.2Mn0.2O2). This material delivered a reversible capacity of about 130.8 mAh g−1 and energy density of 421 Wh Kg−1 in a voltage range of 2.0-4.0 V at 0.1 C (1 C = 140 mA g−1). It remained a capacity retention of 75% over 500 cycles at 1 C, which is much higher than the baseline sample (38%). It also showed outstanding full cell performance when coupled with hard carbon as anode. The discharge capacity and energy density reached 123.5 mAh g−1 (based on cathode mass) and 260 Wh kg−1 (based on the total mass of active materials) in the voltage range of 1.0-4.0 V at 0.1 C. The capacity retention is about 76.5% after 500 cycles at 0.5 C, which is pretty outstanding compared to the other layered oxide cathode. Chen and co-workers [73] designed a five-components O3-type layered oxide cathode (Na0.94Ni0.29Cu0.1Fe0.16Mn0.3Ti0.15O2) with uniform distribution of elements (Fig. 7f). The charge-discharge curve is consisted of voltage plateau around 3 V and a sloping voltage profile at 3.0-4.0 V, which is corresponding to a highly reversible O3-P3 phase transition (without any monoclinic phase). So, it delivered a reversible capacity of 122 mAh g−1 and high capacity retention of more than 79% after 300 cycles at 0.5 C in the voltage of 2.0-4.0 V. Recently, Lin et al. [148]. also reported a high-entropy O3-type cathode, containing similar chemical composition. The NaCu0.1Ni0.3Fe0.2Mn0.2Ti0.2O2 showed excellent long-term cycling stability (approximately 71% after 500 cycles at 0.5 C), which is attributed to the stabilization effect of entropy [149,150].
In short, ion doping is an effective strategy to suppress irreversible phase transitions, reduce transition metal ion dissolution and improve the structural stability of layered materials. However, the mechanism of ion doping for material property improvement still needs further exploration and in-depth study, especially multi-ion co-doping.
1.1.7 Surface modification
In addition to the ion doping, surface modification is also one of the effective strategies to enhance overall performance of cathode. Uniform coating layer can mitigate the corrosion of cathode from the electrolyte and maintain structural integrity, resulting an improved long cycle performance. In particular, the fast ion conductor such as NaTi2(PO4)3 [151,152], Na2SiO3 [74] and etc. as coating layer can accelerate Na+ diffusion at the interface, further increasing the rate performance. Xiao and co-workers [74] reported a O3 NaNi1/3Mn1/3Fe1/3O2 uniformly wrapped by Na-ion conductor Na2SiO3 via in situ coating (Fig. 8a). The Na2SiO3 coating layer can reduce polarization and suppress voltage drop during charge-discharge process. Meanwhile, Na+ diffusion was effectively improved due to the three-dimensional structure of Na2SiO3. Thus, 5 mol% Na2SiO3 coated NaNi1/3Mn1/3Fe1/3O2 cathode showed excellent cycling performance. The capacity retention could reach 88.3% after 200 cycles at 0.5 C in the voltage of 1.5-4.2 V. The rate capacity is 58 mAh g−1 at current density of 5 C, while the uncoated sample remain a capacity of only 12 mAh g−1. Yu et al. [36] reported a synergetic strategy to improve electrochemical performance of Ni-Fe-Mn based cathode by integration TiO2 coating and Ti4+ doping. On the one hand, the TiO2 coating on the surface of the particle inhibits the side reaction and reduces the dissolution of transition metal ions. On the other hand, Ti4+ is successfully doped into transition metal layer of bulk phase structure, while increases the sodium layer spacing and improves the diffusion of sodium ions. In addition, the content of Mn3+ is reduced and the Jahn − Teller effect is suppressed, leading entirely reversible phase transformation (Fig. 8b). This material yields fabulous rate capability of 197.2, 160.9, 140.7, 118.3, 103.6, 88.3, 62.6, 41.8, and 30.0 mAh g−1 at 0.05, 0.1, 0.2, 0.5, 1, 2, 5, 8, and 10 C (1 C = 200 mA g−1), respectively. It also delivered good cycling stability with about 56.2% and 71.0% at 0.1 and 1 C after 100 cycles in the voltage of 1.5-4.2 V. As we all know that oxygen ions may participate in redox to provide additional capacity, which is common in the cathode materials for Li-ion batteries. Liu and co-workers [75] adopt similar synergetic strategy to enhance the rate and cyclic performance by simultaneously coating and doping. In particular, Zr4+ doping adjusts the Na-O-TM structure and the electronic state of O-2p occupies a higher energy level which is supported by DFT calculations, resulting in the higher reversibility and cycle stability of oxygen redox (Fig. 8c). Thus, ZrO2 coated NaNi1/3Fe1/3Mn1/3O2 delivered high reversible specific capacity of 152.4 and 157.1 mAh g−1 at 0.05 C in the voltage of 1.5-4.3 and 1.5-4.6 V, respectively. It also remains a capacity retention of 81.9% at 100 cycles at 1 C.
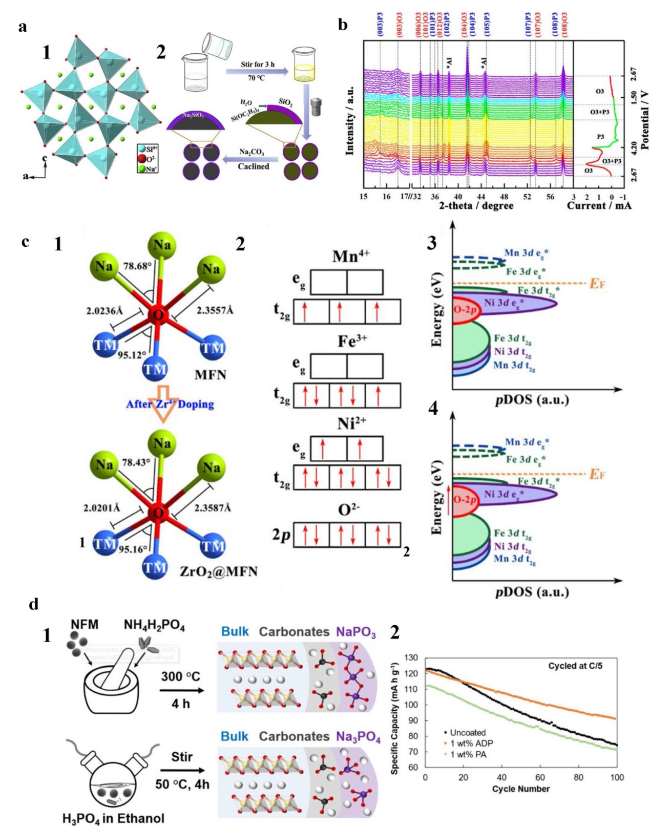
Fig. 8 a a1 The structure of Na2SiO3. a2 Schematic illustration of the synthesis process for Na2SiO3@NaNi1/3Mn1/3Fe1/3O2. Reproduced with permission [74]. Copyright 2019, Elsevier B.V. b In situ XRD patterns of TiO2@MFN during the charge − discharge process. Reproduced with permission [36]. Copyright 2020, American Chemical Society. c c1 Na-O-TM structure before and after Zr4+ doping. c2 Mn4+, Fe3+, Ni2+ and O2− electronic states of the outermost orbit. DOS schematic diagrams of c3 MFN and c4 ZrO2@MFN. Reproduced with permission [75]. Copyright 2021, Elsevier B.V. d d1 Illustrated diagram of the ammonium dihydrogen phosphate (top) and phosphoric acid (bottom) coating methods. d2 Cycling performance of uncoated and coated NFM at a C/5 rate. Reproduced with permission [100]. Copyright 2021, American Chemical Society |
Air stability has a huge impact on electrode assembly, production and transportation. Uniform and dense coating layer can solve this problem very well. Lamb et al. [100]. reported a phosphate-based coating on O3 Na(Ni0.3Fe0.4Mn0.3)O2. The capacity retention of 1% (NaPO3)n coating Na(Ni0.3Fe0.4Mn0.3)O2 increased 14.0% after 100 cycles at 0.25 C, compared to the pristine Na(Ni0.3Fe0.4Mn0.3)O2 (Fig. 8d). After exposed to the ambient air for 9 days, it only loss a capacity of 30 mAh g−1 (the capacity loss of pristine sample is 80 mAh g−1). The reasons for showing excellent cyclic performance and air stability could be attributed to the following points: firstly, the coating layer reduced corrosion of electrode materials by electrolyte. Secondly, when a large quantity of phosphate coating is applied, sodium is leached from the bulk to form sodium phosphate, leading to the formation of inert metal oxides on the surface. It is worth pointing out that over 1 wt% coating will cause lower initial capacity. In addition, some other materials such as Al2O3 [153] and AlF3 [45] were also employed as effective coating layer to improve structure stability and integrality. A portion of the coating material will cause a slight decrease in reversible capacity and energy density, so proper addition ratio is critical.
1.2 Composite structure construction
Many mixing P/O phases have been synthesized to improve cycling and rate performance depending on synergistic effects of multiple phases. As we all know, Although O3 materials have a high capacity, O3-type materials usually require more diffusion energy barrier through intermediate tetrahedral sites during sodium ion extraction/insertion, and thus are accompanied by unsatisfactory rate performance and cycling stability. Integrating P-type phase into O3-type materials at the microscale can adequately take advantage of the high stability of P-type materials and high capacity of O-type materials.
Passerini and co-workers [154] prepared a quaternary P3/P2/O3-type layered cathode (Na0.76Mn0.5Ni0.3Fe0.1Mg0.1O2) (Fig. 9a), which showed high reversible capacity, average coulombic efficiencies and excellent capacity retention. It is mainly due to the synergetic effect on the electrochemical performance from mixed phase. The O3 phase make sure a high reversible capacity as a result of higher sodium content; The P2 and P3 phases supply outstanding rate capacity and cyclic performance depending on the P-type structure (lower Na+ migration energy barrier via prismatic sites); Furthermore, the O-type and P-type phases may have inverse c-axis parameters changes, further decreasing strain inside the electrode. This material delivered a high initial reversible capacity of 155 mAh g−1 with average coulombic efficiencies of over 99% as well as a capacity retention of 90.2% after 601 cycles at 1 C in the voltage range of 2.5-4.3 V. Chen and co-workers [40] synthesized a O3/P2 mixed phases cathode via adjustment of sodium content (Fig. 9b). The Na0.78Ni0.2Fe0.38Mn0.42O2 cathode delivered a capacity of 86 mAh g−1 and capacity retention of 90% after 1500 cycles at 10 C in the voltage range of 2.5-4.0 V. On the first charge/discharge, the O3 phase undergone a highly reversible O3-P3-O''3-P3-O3 sequence phase transformation and the P2 phase almost have no change. However, when the upper voltage increases to 4.3 V, the P2 phase transform to Z phase along with the reduction of P2 (002) peak intensity, indicating the structure may be damaged. It is necessary to enhance structure stability in the high voltage region. Wang et al. [155] prepared a series of P/O intergrown biphasic Na0.8MnyNi0.8-yFe0.1Ti0.1O2 (y = 0.6, 0.55, 0.5, 0.45) layered cathode. Among them Na0.8Mn0.55Ni0.25Fe0.1Ti0.1O2 showed a superior reversible of 154.6 mAh g−1 with satisfying initial coulombic efficiency (~ 100%) as well as high capacity retention of 80.2% after 100 cycles at 0.1C in the voltage range of 1.5-4.3 V. The P/O phases intergrowth in a single particle with a semi-coherent interface along the c and a/b axes is observed directly by TEM characterization (Fig. 9c). Sun et al. [76] presented a novel P2/O3 biphasic Na7/9Ni2/9Mn4/9Fe1/9Mg1/9Li1/9O2 cathode. The topotactic intergrown structure suppressed deleterious phase transformations in the high-voltage region and alleviated internal stress (Fig. 9d). In addition, low oxidation state dopants suppress the dissolution of active materials owing to the charge-compensation mechanism. The materials showed an excellent electrochemical performance, thermal stability and air stability. It delivers a discharge capacity of 170.5 mAh g−1 at 0.1 C and outstanding capacity retention of 71.8% after 500 cycles at 5 C in voltage range of 2.0-4.4 V. The full cell of Na7/9Ni2/9Mn4/9Fe1/9Mg1/9Li1/9O2/hard carbon could deliver a high energy density of 282.6 W h kg−1 with an operating potential of ≈3.2 V, indicating its practical viability.
Fig. 9 a X-ray diffraction pattern and Rietveld refinement of P3/P2/O3-material (cubic Mg1-xNixO (x≈0.3) phase is marked with squares). Reproduced with permission [154]. Copyright 2016, Wiley-VCH. b b1 X-ray diffraction patterns of NaxNi0.2Fex-0.4Mn1.2-xO2 with different Na contents (0.7 − 1.0) and the phase evolution derived from XRD patterns is shown in the right. b2 Schematic illustration of O3 (left) and P2 (right) structures. b3 Observed and calculated XRD profiles for NNFM-0.78 with b4 TEM image of this material. Reproduced with permission [40]. Copyright 2017, American Chemical Society. c c1 STEM-EDX HAADF image and elemental distribution maps; c2 line profile representing the elemental intensities averaged over 360 nm parallel to the interface. Reproduced with permission [155]. Copyright 2021, Royal Society of Chemistry. d d1-d3 HRTEM images of the biphasic domain of NMFML. Reproduced with permission [76]. Copyright 2022, Wiley-VCH |
Mixed-phase materials exhibit excellent electrochemical properties, but their synthesis conditions are complex and require precise tuning of elemental composition, which is very challenging. In addition, the interface of the two phases and the elemental composition through the interface are unclear, and the phase transition mechanism of the multiphase still needs further investigation.
2 Conclusion and perspectives
In summary, we have comprehensively reviewed the recent progress, key challenges and solutions of O3-type NaxNiyFezMn1-y-zO2 layered oxide cathodes. The key challenges mainly contained irreversible phase transitions, highly hygroscopic and insufficient cell performance.
(i) Irreversible phase transition: Usually, O3-type materials are accompanied by multi-level irreversible phase changes during the desodiation process, and the large volume changes will trigger the nonuniform accumulation of stress, which eventually lead to microcracks or even fragmentation of the material particles, resulting in more electrolyte attack and a significant decrease in cycling performance. Since irreversible phase transitions easily lead to structural collapse and a rapid capacity degradation, suppressing or reducing these irreversible phase transitions is key to improving the electrochemical performance of layered oxides.
(ii) Highly hygroscopic: Another challenge is the inherent hygroscopic properties of the O3-type material when exposed to ambient air. On the one hand, H2O embedded in the material forms a hydrated phase, which may prevent the transfer of Na+; on the other hand, it has been shown that the material undergoes spontaneous exchange of Na+ and H+, leading to the loss of bulk Na+ and the aggregation of surface Na (electrochemically inactive NaOH or Na2CO3), which increases the alkalinity of the material and the impedance during cycle. In addition, it may trigger the gelation of the slurry, increasing production difficulties and storage costs. Therefore, it is crucial to improve the air stability in order to further scale up the material.
(iii) Insufficient cell performance: Considering the cost advantage of sodium ion batteries, Fe and Mn elements are crucial; however, Fe elements may migrate to the tetrahedral sites of the alkali metal layer during charge and discharge process, hindering Na+ transport and causing performance degradation. Meanwhile, the Jahn-Teller effect of Mn3+ will cause lattice distortion and increase the irreversibility of the phase transition, therefore, the valence state of Mn needs to be increased. Thus, migration of transition metal ions and Jahn-Teller effect need to be improved by proper structure design due to the decisive influence for cyclic stability.
Possible solutions are suggested as follows:
(i) The ion doping can mitigate irreversible phase transitions and have a “pinning” effect on structure stability, such as Ti,Mg. Ti doping can significantly smooth voltage curves and increases energy density, effectively suppressing irreversible phase transitions. Mg doping suppress slippage of the transition metal layer, leading enhanced cycling stability in the high voltage region.
(ii) The improvement of hygroscopicity can be achieved in two ways, one is doping with elements that can improve water-resistant property, such as Cu, Mg and so on. On the other hand, the surface coating layer can reduce the contact between the bulk phase and the air, therefore leading to the enhanced air stability. In addition, surface coating layer also decrease electrolyte attack and reduce the dissolution of transition metal ions.
(iii) The migration of transition metal ions can be improved by doping with elements that can act as pillar ions (such as Zn, Zr), while reducing the content of elements is also an effective way. the Jahn-Teller effect of Mn can be reduced by reducing the content of Mn3+.
In order to achieve the commercialization process of sodium ion batteries, the air stability and cyclic performance of the O3-type cathode material is crucial, elemental doping followed by surface coating is recommended. High entropy materials with the advantage of multiple elements synergistic effect brings excellent properties, such as high fracture toughness, high strength and good long cyclic properties. However, they are generally synthesized by the one step high temperature solid-state method (direct mixing of oxides), resulting in slightly lower tap density and energy density compared with secondary spherical particles of Li-NiCoMn materials system. Therefore, the synthesis of high-entropy cathode materials with secondary spherical morphology will be very promising.
Most studies focus on half-cell based on sodium as the anode. However, it is known that full cell usually chooses disordered carbons, mainly hard carbons (HCs) as the anode due to the potential safety risks of sodium. It will have different performance delivery compared with half cells. Continuous work on electrolyte additives, separators and proper anode materials is also needed to further promote the practical application of Na full cell. Several companies and teams have already performed the preparation of full cells, soft packs and cylindrical cells, and gradually brought them to the market. Sodium ion batteries based on O3-type cathode materials show great market prospects for applications in electric bicycle, low-speed electric vehicles and large-scale energy storage applications. It can be anticipated that advanced electrode material with outstanding electrochemical performance, cost efficiency, and environmental friendliness are emerging, and will eventually contribute to the practical energy storage market in the near future.
Abbreviations
EV $\ \ \ \ \ \ \ \ $Electric vehicles
HEV $\ \ \ \ \ \ \ \ $Hybrid electric vehicles
NIBs $\ \ \ \ \ \ \ \ $Sodium-ion batteries
ICEL $\ \ \ \ \ \ \ \ $initial coulombic efficiency
DFT $\ \ \ \ \ \ \ \ $Density functional theory
ALD $\ \ \ \ \ \ \ \ $Atomic layer deposition
PVDF $\ \ \ \ \ \ \ \ $Polyvinylidene fluoride
HCs $\ \ \ \ \ \ \ \ $Hard carbons
Acknowledgements
Not applicable.
Authors’ contributions
SZ: organized the framework of the manuscript, drafted, and revised the manuscript. QS, WF, YL, XY, XZ, XL: gave some comments and suggestion. YZ: modified the manuscript. All authors have read and agreed to this version of manuscript.
Funding
Open access funding provided by Shanghai Jiao Tong University. This work is supported by the National Natural Science Foundation of China (22179077, 51774251, 21908142), Shanghai Science and Technology Commission's “2020 Science and Technology In-novation Action Plan” (20511104003), Natural Science Foundation in Shanghai (21ZR1424200).
Availability of data and materials
The data involved in the manuscript can be found in the references which are listed at the end of the paper.
Declarations
Ethics approval and consent to participate
All authors have seen the manuscript and approved to submit to the journal.
Consent for publication
This manuscript has not been published in whole or in part nor is it being considered for publication elsewhere.
Competing interests
There are no financial interests that are directly or indirectly related to the work submitted for publication.
Publisher’s Note
Springer Nature remains neutral with regard to jurisdictional claims in published maps and institutional affiliations.
