
1 Introduction
Carbon neutrality refers to the state of having net-zero CO2 emissions [1]. Since the beginning of the industrial revolution, greenhouse gas emissions have grown rapidly, resulting in the global warming effects considered as serious threats to the environment [2,3,4,5]. One solution to this problem is to upgrade traditional high-carbon emission industries to become carbon-free [6,7,8]. Ammonia, as an essential chemical for the fertilizer industry, is considered as an important strategic resource [9]. Additionally, ammonia serves as a potential hydrogen carrier that can be decomposed into H2 and N2, providing hydrogen on demand [10,11,12,13]. Unlike liquid hydrogen, which requires harsh conditions for storage, ammonia can be readily liquefied by increasing the pressure to approximately 10 bar at room temperature or cooling it to -33 °C at atmospheric pressure [12,14,15]. However, industrial-scale ammonia production, known as the Haber-Bosch process, is an energy-intensive chemical process that accounts for approximately 2% of the world’s energy consumption and emits over 450 million tons of carbon dioxide annually [16]. As traditional ammonia production methods no longer align with the goals of achieving carbon neutrality, it is critically urgent to explore carbon-free ammonia synthesis methods.
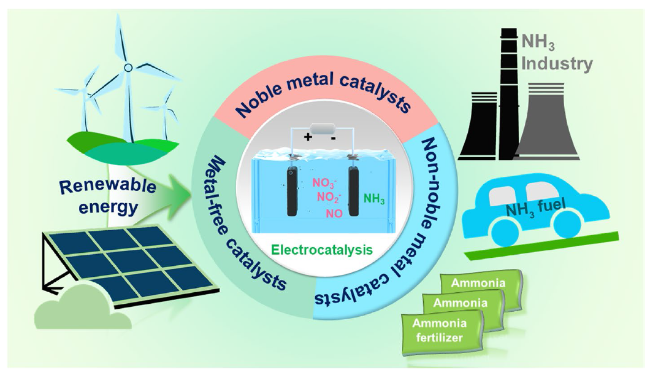
Fig. 1 The schematic illustration of ammonia production from nitrogenous waste through electrocatalytic reduction driven by renewable energy |
Electrochemical processes offer a clean pathway for synthesizing green NH3 at room temperature [16,17,18]. As illustrated in Fig. 1, it has emerged as a promising energy-efficient route for decentralized ammonia production, potentially driven by generated renewable energy [19]. Inspired by the traditional Haber-Bosch process, which converts nitrogen to ammonia, the electrochemical N2 reduction reaction (NRR) for ammonia synthesis has received extensive attention over the past decade [20,21]. However, NRR poses several challenges, including low solubility of N2 in aqueous electrolytes, competition from the more facile hydrogen evolution reaction (HER), and large thermodynamic activation barriers [19,22]. Consequently, the Faradaic efficiency (FE) and yield rate (YR) of NH3 in aqueous systems remain low, making NRR difficult for further reliable application. To overcome these challenges, oxidized nitrogen species can serve as feedstock for efficient electrocatalytic NH3 production. Nitrogen oxides, including NO3-, NO2-, NO and et al., with lower dissociation energies of the N=O bond (204 kJ mol- 1) and/or N-O bond (176 kJ mol- 1) than that of the N≡N bond (941 kJ mol- 1), exhibit markedly higher overall kinetic rates [23,24]. Furthermore, nitrogen oxides are common environmental pollutants found in groundwater, industrial wastewater, and industrial exhaust [25]. Upcycling nitrogenous waste in the production of electrochemical green ammonia offers a promising option for treating nitrogenous waste in the environment and provides an alternative to carbon-free and decentralized ammonia production.
Hence, we provide an update on the production of green ammonia from nitrogenous waste. Firstly, we mainly summarize the reports of major environmental nitrogenous wastes in electrocatalytic ammonia production, focusing more on the conversion of common nitrogen pollutants into value-added ammonia. We highlight three kinds of nitrogenous wastes (NO3-, NO2- and NO) commonly found in nature, and discuss the reaction paths of electrochemical reduction of these three nitrogenous wastes to NH3, as well as the influence and inhibition methods of competitive reactions. Furthermore, the reported electrocatalysts can be classified based on their active sites, including noble metals, non-noble metals, and metal-free catalysts. Finally, we discuss the current challenges and prospects of nitrogenous waste for ammonia synthesis, emphasizing the significance of this industry for achieving global carbon neutrality.
2 Reaction mechanism
2.1 Reaction pathways
Electroreduction of nitrogenous wastes with various oxidation states, such as NO3- (+5), NO2- (+3), and NO (+2), to NH3 (-3) will represent NO3RR, NO2RR, and NORR, respectively. Although there are three different reaction paths for electrochemical ammonia synthesis, after free NO2- and NO are adsorbed to form *NO2 and *NO, their subsequent intermediate evolution paths coincide with NO3RR. Therefore, three specific reaction paths for the electrosynthesis of ammonia from NO3-, NO2-, and NO in aqueous solution are integrated into Fig. 2. Electrocatalytic NO3- reduction of ammonia synthesis is a process that requires multi-electron transfer and multi-proton coupling [26]. As the number of transferred electrons increases, plenty of complex intermediates and by-products are produced [19,27]. Understanding the detailed steps of the NO3- reduction reaction path is conducive to studying the main competing products and limiting steps in the ammonia synthesis process. According to the Frost-Ebsworth diagram for nitrogen species, N2 and NH3 (alkaline, the acidic condition is NH4+) are the most thermodynamically stable products, which are obtained from Reactions (1) and (2), respectively [26,28].
$\mathrm{NO}_3^-\;+\;9\mathrm H^+\;+\;8\mathrm e^-\;\rightarrow\;{\mathrm{NH}}_3\:+\:3{\mathrm H}_2\mathrm O$
$2{\mathrm{NO}}_3^-\;+\;12\mathrm H^+\;+\;10\mathrm e^-\;\rightarrow\;{\mathrm N}_2\:+\:6{\mathrm H}_2\mathrm O$
As illustrated in Fig. 2, the initial step is the adsorption of free NO3- from the electrolyte to the electrode surface. The adsorption energy of different catalysts for NO3- determines whether the reaction can start spontaneously [24]. Additionally, the concentration of NO3-, the mass transfer rate of reactants, and the number of active sites on the catalyst surface are all factors affecting the reaction rate [29,30]. Therefore, whether NO3RR can occur on different electrode surfaces is affected by many factors, and some literature considers that the NO3- adsorption step is the rate-determining step of the whole reaction [31,32,33]. After NO3- is adsorbed, the NO2- was obtained through a proton coupling, a double electron transfer, and another proton coupling successively, namely the electrochemical-chemical-electrochemical (ECE) three-step reaction mechanism. Meanwhile, the ECE reaction is considered to be the limiting step for the electro-reduction of NO3- to NH3 because the estimated Tafel slope of the first electron transfer reaction (*NO3- to *NO32-) is 120 mV dec- 1 [34]. Except for the initial ECE three-step reactions, the subsequent pathways of NO3- reduction will be consistent with that of NO2-. The reduction from NO2- to ammonia requires the six-electron transfer following the pathways in Reaction (3) [35]. However, *NO2, as the main quasi-stable intermediate, is easy to desorption from the catalyst surface to form dissociative NO2-, so the direction of protonation and further deoxidation of *NO2 is more conducive to yielding desired ammonia [26].
${\mathrm{NO}}_2^-\;+\;7\mathrm H^+\;+\;6\mathrm e^-\;\rightarrow\;{\mathrm{NH}}_3\:+\:2{\mathrm H}_2\mathrm O$
$\mathrm{NO}\:+\:5\mathrm H^+\;+\;5\mathrm e^-\;\rightarrow\;{\mathrm{NH}}_3\:+\:{\mathrm H}_2\mathrm O$
The next step is the reduction of *NO2 to adsorbed nitric oxide (*NO) by direct electron transfer and a deoxidation process [32]. The subsequent pathway of *NO is considerable because it determines whether the final product is NH3, N2, or N2O [36]. The hydrogenation of NO produces HNO. N2O is obtained through the dimerization of NO and HNO and the further dehydration of HN2O2 and H2N2O2, respectively [37]. For the formation of NH3, the reaction involves five proton-coupled and five electron-transfer steps, as shown in Reaction (4) [38]. *NO generates NH2OH through three continued protonation processes, and NH2OH is subsequently deoxidized, resulting in ammonia. Many simulations support that there is a large energy barrier in the first protonation, so the reaction of *NO to *NHO is often considered to be the rate-determining step [39]. Besides, another way to produce NH3 from *HNO is realized through exchanging the order of protonation and deoxidation, that is, forming isolated *N first, and then hydrogenating three times to generate NH3 [40].
As mentioned above, during the NO3RR process, *NO2 and *NO serve as intermediate species in the reaction pathway, indicating that these three reactants are not completely independent of each other. In the electrochemical ammonia production process, the solubility of the three nitrogen-containing waste species in water differs. Notably, NO has the lowest solubility, while NO2- exhibits the highest solubility. This difference in solubility among the reactants plays a crucial role in determining the selectivity of the reaction that is influenced by the competitive hydrogen evolution reaction [41].
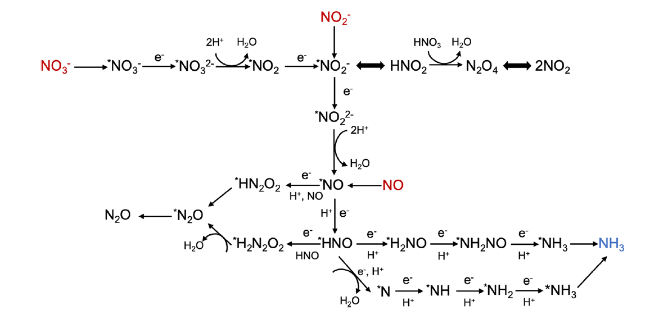
Fig. 2 Reaction pathways diagram of several nitrogenous species (NO3-, NO2-, and NO) in the aqueous solution |
2.2 Competition with hydrogen evolution reaction
The electrochemical synthesis of ammonia is carried out in an aqueous solution, in which water provides abundant protons and hydroxide ions (Reaction (5)) [42]. The intense competition of water or proton to occupy the active site in the HER leads to dissatisfactory Faradaic efficiency [43,44]. The thermodynamic potential of NO3RR is very close to that of HER [45]. Figure 3a depicts the thermodynamic standard potentials (vs. standard hydrogen electrode) for the electroreduction of nitrogenous wastes such as nitrogen oxides (N2O, NO, NO2) and nitrogenous anions (NO2-, NO3-) [13]. Moreover, the electrosynthesis of NH3 involves multiple electron transfer and protonation behaviors with a slow kinetics rate, while the formation of H2 requires only a simple proton coupling (Reaction (6)) [46]. Therefore, HER presents great challenges to the FE and YR of ammonia during the electrocatalysis of nitrogenous compounds [37].
${\mathrm H}_2\mathrm O\:+\:\mathrm e^-{\rightarrow^\ast}\mathrm H+\mathrm{OH}^-$
$^\ast\mathrm H\;+\;^\ast\mathrm H\;\rightarrow\;{\mathrm H}_2$
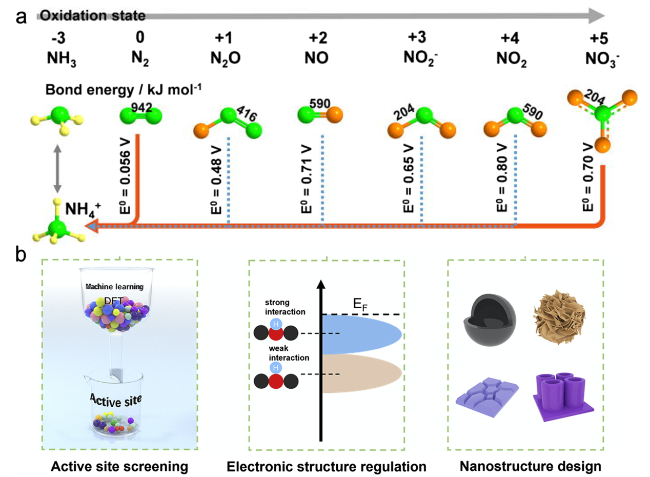
Currently, tremendous catalysts are designed to inhibit HER. Wang et al. [45] proposed the design principles of an HER-suppressing catalyst combined with the advantages of single-atom catalysts and based on active-site screening, electronic-structure regulation, and nanostructure design (Fig. 3b). The electronegativity and ionic radius of the metal center have extreme effects on the adsorption behavior of the active substances. Therefore, the catalytic strength of HER should also be considered when selecting the metal center with excellent catalytic activity for NO3RR [47]. In addition, optimization strategies for regulating the electronic structure, such as the second element doping, and single atomic site, have been widely applied [40,48,49,50]. The change in the electronic structure of the active atoms is contributed to adjusting the interaction between metal sites and active substances. Besides, the geometric structure of the catalyst will greatly affect the mass transfer process of the reactants and intermediates, especially for the electrosynthesis of ammonia involving plentiful intermediates and protons. Thus, the design of the nanoscale can effectively suppress the HER. Except for modifying the internal structure of the catalyst, the HER can also be effectively inhibited by adjusting the surface chemical environment of the catalyst. For instance, surface hydrophobic coatings can prevent active hydrogen evolution sites, anticatalytic interfaces can effectively regulate the adsorption of hydrogen evolution intermediates, and reduce the activity of water molecules by changing electrolyte composition and local pH value [51,52,53].
3 Electrocatalysts for the NO3RR
3.1 Noble metal-based electrocatalysts
The transition metal catalysts exhibit excellent performance in the electrocatalytic reduction of NO3- to ammonia. Some previous reports have proven that d-orbital electrons play a significant role in enhancing the charge injection of the lowest vacancy molecular orbital of NO3-. Therefore, metals with highly occupied d-orbital shells and unclosed d-orbital shells are selected to catalyze NO3RR. Zhang et al. [40] investigated the feasibility of different transition metals for electrocatalytic NO3- reduction to ammonia using graphite carbon nitride (g-CN) loaded with a single transition metal (TM, ranging from Ti to Au) as a model. Figure 4a displays the adsorption capacity of NO3- on TM/g-CN, and the adsorption energies of NO3- (∆G*NO3) are distributed periodically from Ti to Au. Notably, noble metals such as Rh, Ru, Pd, Ag, Pt, and Au and several non-noble metals such as Fe, Co, Ni, and Cu both exhibit high activity for adsorbing NO3- due to their highly occupied d-orbitals and unclosed d-orbitals shells. In addition, ∆G*NO3 values on TM/g-CN are more negative than the adsorption energies of H proton (∆G*H) values except for Pt and Au, indicating that NO3RR is more competitive than HER during the electrocatalytic process.
The excellent performance of noble metal Ru in NO3- reduction has recently attracted wide attention. Li et al. [54] reported a strained Ru core/shell nanocluster (Ru-ST-12) with a yield rate for NH3 (5.56 mol gcat-1 h- 1). Oxygen dopants deform the Ru lattice to trigger tensile strains, and the strain value of Ru varies with the change in oxygen concentration. As shown in Fig. 4b, the triggered tensile strain can reach a maximum of 12% with 6.3 at% subsurface oxygen. The strain of Ru nanoclusters promoting some protons evolves into hydrogen radicals (·H) and participates in the hydrogenation of intermediates to form NH3. As shown in Fig. 4c, the current density of HER for Ru-ST-12 is the lowest, indicating the strongest inhibition on HER. Furthermore, Ru-ST-12 exhibits nearly 100% selectivity at > 120 mA cm-2 current density. The discussion of strain-oriented radical evolution in this work demonstrates the great potential of this concept for NO3RR. Yao et al. [18] fabricated the Ru single-atom electrode (Ru-TiOx/Ti) by taking advantage of the metal-support interaction effect. The highest mass activity of 889.7 mA mgRu-1 for Ru-TiOx/Ti at -1.38 V is three orders of magnitude higher than the industrial electrode. Meanwhile, Ru-TiOx/Ti exhibits impressively superior ammonia yields of 22.2 mol g-1 h-1. Additionally, the synthetic strategy demonstrates great potential for large-scale industrial applications due to the programmable synthesis strategy, the selectivity of the loaded metal, and the magnification of the electrode area.
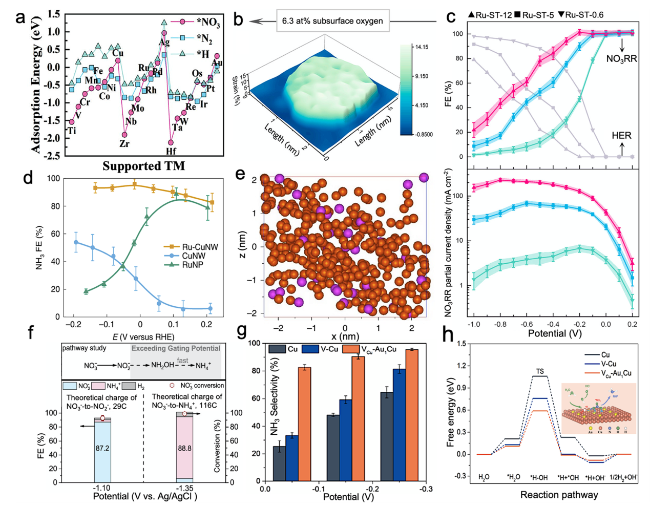
Fig. 4 a Comparison of NO3-, N2 molecule, and H proton adsorption energies, on TM/g-CN [40]. b Three-dimensional (3D) topographic strain distribution image of Ru-ST-12. c FENH3 and NO3RR partial current densities (JNH3) of the strained nanoclusters for electrocatalytic NO3- to NH3 [54]. d FENH3 of Ru-CuNW, CuNW and RuNP. e Atom probe tomography analysis of Ru-CuNW [23]. f FE and NO3- conversion on OD-Ag [55]. g Selectivity of NH3 on Cu NSs, V-Cu NSs, and VCu-Au1Cu SAAs. h Free energy diagrams of H2O dissociation (inset: schematic illustration of the reaction mechanism for NO3RR on the VCu-Au1Cu SAAs surface) [56] |
Doping noble metal elements into non-metallic support is a promising design strategy to reduce cost and optimize catalytic performance. Chen et al. [23] dispersed Ru atoms on copper nanowires (Ru-CuNW) by ion exchange method. The Ru-CuNW generated 1 A cm-2 current at the NO3- concentration of industrial wastewater (2000 ppm) and reaches a Faradaic efficiency of 96%, realizing the conversion of highly polluting industrial wastewater to drinking water level. As depicted in Fig. 4d, the Ru nanoparticle (RuNP) and CuNW show completely different catalytic behaviors. Ru-CuNW organically combines the catalytic advantages of Ru and Cu. In addition, Ru was confirmed to be distributed as a single atom on copper nanowires (Fig. 4e). Density functional theory (DFT) theoretical calculation reveals that Ru active site activates the NO3- to NH3 reduction path, while adjacent Cu is conducive to inhibiting HER. Moreover, this work proposes a production model combining sewage treatment with an air stripping process to realize the upcycling conversion of nitrogenous wastes to more valuable NH4Cl fertilizer and pure NH3 aqueous products.
Similarly, Liu et al. [57] constructed Rh species onto the copper nanowires (Rh@Cu) with different Rh loadings. The NO3RR activity of the catalyst was significantly affected by Rh loading, which was closely related to the present form of Rh. The atomic percentages of Rh clusters and Rh single atoms in different Rh@Cu samples depend on the practical Rh loading. Samples with 0.6% Rh loading (Rh@Cu-0.6%) reached a YR of 1.27 mmol h-1 cm-2 and a FE of 93% higher than those of the samples with a higher (12.5%) or a lower (0.3%) Rh loading. According to experimental and theoretical evidence, the excellent NO3RR catalytic behavior of Rh@Cu-0.6% can be attributed to the transfer of adsorbed *H from the Rh site to the adsorbed *NO intermediate species at the Cu site, thus promoting the hydrogenation step of ammonia synthesis.
Except for the catalytic centers in the metallic state, the catalysts in the oxidized state also exhibit high activity for NO3RR. The oxide-derived silver reported by Liu et al. [55] has high selectivity (98%) and high Faradaic efficiency (95%) for NO3- to NO2-. As shown in Fig. 4f, the subsequent conversion of NO2- to NH4+ can be achieved by adjusting the cathode potential. When a theoretical charge of 29 C is applied at -1.10 V vs. Ag/AgCl, the conversion of NO3- reaches 92.8% and the FE of NO2- is 87.2%. Similarly, by applying a more negative cathode potential (-1.35 V vs. Ag/AgCl), 99.0% of NO3- will be converted to NH4+ through the theoretical charge of 116 C with a FE of 88.8%. Therefore, there is a gating potential in the reduction path of NO2- to NH4+. As the applied potential exceeds the gating potential, NO2- will transform to NH3 (at the top of Fig. 4f). The excellent NO3- to NO2- conversion reflected in this work provides a promising method of using the combined catalysts in series to reduce NO3-.
It is well known that precious metals limit industrial application and research because of their high cost. Single-atom catalysts possess the advantages of high efficiency and high activity. Therefore, designing noble metal single-atom materials is an effective way to obtain low-cost and high-activity catalysts. For example, an Au1Cu (111) single-atom alloy with surface Cu vacancies was synthesized by Zhang et al., [56] which showed an ideal selectivity of NH3 (98.7%) and a yield rate of 555 µg h-1 cm-2 (Fig. 4g). Notably, electron transfer between Cu and Au atoms results in electron-deficient Cu active sites, promoting the generation of active hydrogen species (*H). Additionally, the presence of Au atoms and vacancies significantly reduces the energy barrier for the formation of the *H, which easily hydrogenates the intermediates to form NH3 (Fig. 4h). This work takes advantage of the synergistic effect between Au atoms and surface vacancies and provides a reference for the design of precious metal monatomic catalysts.
In addition to the metals mentioned above, there are many reports on Pt, Pd, and Ir precious metal catalysts [48,58,59,60,61,62,63]. Although some new synthetic methods have been applied to the design of noble metal catalysts, the catalytic performance of these catalysts is not desired. In short, research on noble metal catalysts still needs further exploration and development.
4 Non-noble metal-based electrocatalysts
Compared with precious metals, non-noble metal catalysts have the advantages of low cost, rich resources, high activity, and large-scale application [64]. As shown in Fig. 4a, Cu, Fe, Co, and Ni show high activity for the adsorption of NO3-. Most non-precious metal catalysts are designed around these metals with different structures [65]. This section summarizes some outstanding and representative non-noble metal catalysts to demonstrate the great progress in the electrosynthesis of ammonia with nitrates.
Ye et al. [66] first prepared cobalt phosphide nanosheet arrays grown on carbon fiber cloth (CoP NAs/CFC) for the NO3RR and the catalyst achieved a Faradaic efficiency near 100% and an ammonia-evolving rate of 9.56 mol h-1 m-2. Figure 5a shows the cumulative amount of ammonia generated by CoP NAs/CFC and the contrast material Co NAs/ CFC over time, indicating that CoP NAs/ CFCS has a higher ammonia-evolving rate. In addition, Fig. 5b illustrates the Operando X-ray absorption near-edge structure (XANES) of the Co K-edge of CoP NAs/CFC. The three peaks A, B, and C at the white line represent the transition of electrons from the 1s orbital to the unoccupied 3d orbital, the ligand, and the 4p orbital, respectively. As the applied potential increases, peak A enhanced while peak B weakened simultaneously, suggesting that electron holes are formed in the 3d orbital and partially occupied in the 4p orbital. Therefore, the catalytic mechanism of Co 4p orbital involvement in NO3RR was deduced in Fig. 5c. Due to the electric field, electron transition from Co 3d to 4p orbital first occurred. Next, the excited electrons were transferred to the O 2p orbital of NO3- through the Co-O-N covalent bond, and finally injected into the p* orbitals of NO3- to reduce the adsorbed NO3-.
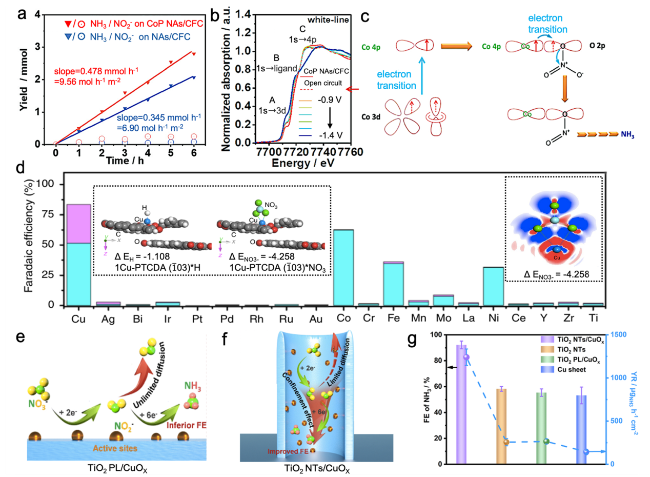
Fig. 5 a Fitting curves of ammonia yield against the electrolysis time. b Operando XANES of CoP NAs/CFC. c NO3RR mechanism on CoP NAs/CFC [66]. d FENH3 (blue) and FENO2- (mauve) of various elements incorporated in PTCDA at -0.4 V vs. RHE. Inset on the left: the adsorption energies of H and NO3- on O-Cu-PTCDA ($\stackrel{-}{1}$03). Inset on the right: the charge density difference of NO3- on 1Cu-PTCDA ($\stackrel{-}{1}$03) [24]. e, f Schematic illustration of NO3RR on (e) TiO2 PL/CuOX and (f) TiO2 NT/CuOX. g FENH3 of TiO2 NT/CuOX, TiO2 NTs, TiO2 PL/CuOX, and Cu sheet at -0.75 V vs. RHE [70] |
Cu-based materials are generally reported to exhibit the highest catalytic activity for NO3- reduction to NH3 [49,64,67,68,69]. The pioneering work reported by Chen et al. [24] about copper-molecular solid catalysts provided a reference for subsequent work in the NO3RR field. Figure 5d shows the Faradaic efficiency of reducing NO3- into NH3 (blue) and NO2- (lavender) after doping various elements into the organic molecular solid 3,4,9, 10-tetracarboxylic acid (PTCDA). Among all samples, Cu-doped PTCDA catalyst (O-Cu-PTCDA) exhibits the highest total Faradaic efficiency of 83.5% due to the unique electron configuration of Cu element. On the surface of O-Cu-PTCDA, NO3- could combine with Cu (3d10) and provide electrons from the highest occupied molecular orbital of NO3- to the empty energy level of Cu atoms. Meanwhile, abundant electrons feedback from the fully occupied Cu 3d orbital to the lowest unoccupied molecular orbital of NO3-. As depicted in the right illustration of Fig. 5d, the charge density difference of NO3- on O-Cu-PTCDA ($\stackrel{-}{1}$03) has a larger electron cloud and a more negative adsorption energy difference (∆E = - 4.258 eV), indicating the strong interaction between NO3- and Cu. Furthermore, the adsorption energy of O-Cu-PTCDA for *H is much smaller than that of *NO3 (in the left illustration of Fig. 5d), indicating a better adsorption effect on NO3- and an inhibitory effect on HER. This work deeply unveiled the catalytic mechanism of efficient NO3- reduction through electron/proton transfer of O-Cu-PTCDA, which promoted the development of ammonia electrosynthesis from NO3RR.
Although copper-based catalysts exhibit a high NO3- to NO2- conversion rate, *NO2, as the most stable intermediate of NO3RR, is often desorbed from the electrode surface to reduce the NO3- to NH3 conversion rate. Qiu et al. [70] reported a catalyst that incorporates CuOx active species within a TiO2 nanoreactor (TiO2 NTs/CuOx). Due to the limited space of the nanotube, this catalyst confines the NO2- intermediate to facilitate NO3RR. Compared with planar electrodes, nanotubular electrodes with encapsulating CuOx can effectively hinder the diffusion behavior of NO2-, significantly promoting the conversion of NO2- to NH3 (Fig. 5e and f). Therefore, TiO2 NTs/CuOx increases FE by more than 20% and YR by more than 4 times (Fig. 5g). This work makes rational use of the confinement effect toward active substance given by the catalyst geometry, which can be expected for the multi-scale design of electrode structures in highly selective electrochemical ammonia synthesis.
The introduction of the second element is a common method to design electrocatalysts. The unique characteristics of the second element can endow original catalysts with new properties, such as structural strain, synergistic effect, series reaction, etc. These strategies can significantly adjust the electronic structure of the materials and thus improve the catalytic activity. Wang et al. [71] synthesized a series of alloy catalysts with different Cu/Ni component ratios. In Fig. 6a, the d-band center of CuNi alloys shifts 0.14, 0.28, and 0.32 eV towards the Fermi level with the increase of Ni composition ratio, enhancing the adsorption energy of intermediates. As shown in Fig. 6b, with the increase of Ni concentration in the alloy, the adsorption energy of NO3- increases. However, a high proportion of Ni will cause the adsorption value of intermediate *NH2 to exceed the ideal value and reduce the selectivity of the final product NH3. In addition, the NO3RR activity of the Cu50Ni50 is 6 times higher than that of the pure copper electrode, and the half-wave potential increases by 0.12 V (Fig. 6b).
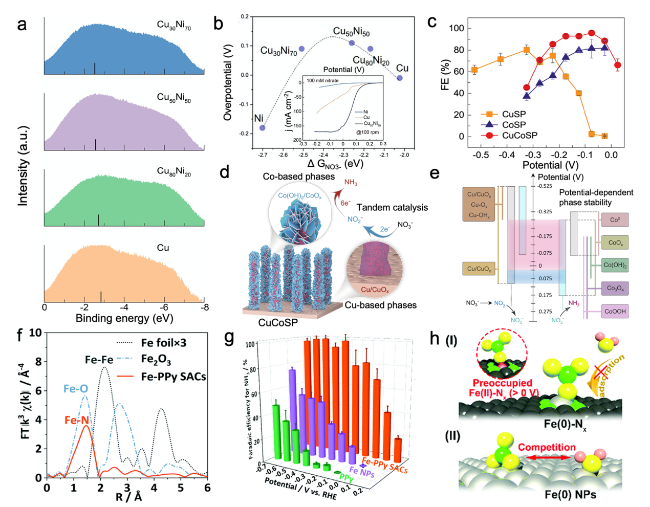
Fig. 6 a UPS spectra of various CuNi alloys and pure Cu catalysts. b The volcano-type relationship between ∆G*NO3 and experimental overpotentials on all CuNi alloys. Inset: current densities of Cu50Ni50 in different concentrations of NO3- [71]. c FENH3 on CuSP, CoSP, and CuCoSP. d Schematic illustration of tandem catalysis of NO3RR on CuCoSP. e The proposed reaction mechanism of tandem catalysis of NO3RR on CuCoSP at low overpotentials [11]. f Fourier transform of extended X-ray absorption fine structure of Fe foil, Fe2O3, and Fe-PPy SACs. g FENH3 on Fe-PPy SACs, Fe NPs, and PPy catalysts. h The proposed mechanism of NO3RR on the single-site center and bulk surface [22] |
Given the slow kinetic rate of NO3RR, He et al. [11] proposed the concept of an efficient tandem catalyst to achieve high-speed ammonia production at low potential by coupling different transition metal interphases as synergic active sites. Through an electrochemical redox activation process, the Cu/Co disulfide is induced to reconstitute the core-shell Cu/CuOx and Co/CoO phases (CuCoSP, Fig. 6c) with adjustable potential. In Fig. 6d, CuCoSP reaches the maximum Faradaic efficiency of 95.9%, 14.5% higher than that of CoSP, while almost no ammonia is produced on the CuSP at -0.075 V vs. RHE. In situ Raman spectroscopy reveals the specific tandem catalytic behavior on CuCoSP as follows: the inner Cu/CuOx phase preferentially catalyzes NO3- reduction to NO2-, while the NO2- intermediates are transferred and selectively converted to NH3 on the Co/CoO phase. The sequential NO3- and NO2- reduction enables a tandem system for quickly cascading NO3- to NH3 at low overpotential (Fig. 6e).
As the most abundant transition metal in the world, Fe is active for NO3RR [72,73]. Inspired by the unique tunable local electronic structure, Li et al. [22] reported a densely populated Fe single-atom catalyst (Fe-PPy SACs) obtained from double pyrolysis of ferric acetylacetone/polypyrrole hydrogels. As shown in Fig. 6f, Fe atoms are isolated from each other and combined with nitrogen species to form Fe-N bonds in Fe-PPy SACs. Additionally, Fe-PPy SACs exhibit the highest ammonia YR of 2.75 mgNH3 h- 1 cm- 2 and FE of nearly 100% (Fig. 6g), which are superior to Fe nanoparticles (Fe NP) and PPy. The excellent catalytic performance means that the Fe sites isolated on Fe-PPy SACs make a significant contribution to the electrocatalytic reduction of NO3- to ammonia. As shown in Fig. 6h, NO3- preoccupies most Fe sites in the Fe-PPy SACs before the transition state Fe(II) is reduced to HER active site Fe(0), resulting in no or barely available adsorption sites for water molecules in the subsequent reduction process and thus the HER will be completely suppressed. Similarly, Wu et al. [74] synthesized Fe single-atom catalysts by using SiO2 as hard templates, and the catalyst showed the highest Faradaic efficiency of 75% and yield rate of nearly 20,000 µg h- 1 mgcat.-1.
5 Metal-free electrocatalysts
Although metal catalysts have been widely applied in electrocatalytic NO3- reduction due to the high activity, they generally suffer from a series of inevitable challenges such as high cost, poor adaptability, and environmental pollution caused by metal ions leaching [75]. Metal-free catalysts have been widely used in ORR, OER, and CO2RR because of their low cost, high mechanical strength, and large surface area. Some metal-free materials for NO3RR have been reported, including carbon nanotubes, graphene, carbon paper, graphite felt, and boron-doped diamond. However, the activity of most metal-free catalysts is still inferior due to complex reaction paths and fierce competitive reactions. To date, heteroatom doping, defect effect, and amorphous regulation are the main strategies for optimizing the activity of metal-free catalysts for ammonia synthesis. In this section, recent representative reports will be summarized, which provide new possibilities for the development of metal-free materials in NO3RR.
Li et al. [76] reported a series of N-doped carbon aerogel catalysts N-C-T (T = 600,800,1000, and 1200°C) by changing the calcination temperatures. As depicted in Fig. 7a, N-C-1000 shows the highest FE of 95% and a maximum YR of 1.3 mg h-1 cm-2, which are both remarkably higher than that of the other materials. In addition, X-ray photoelectron spectroscopy (XPS) analysis revealed that different calcination temperatures would lead to changes in the types of doped nitrogen atoms. According to Fig. 7b, the absolute content of N3 in N-C-1000 is 1.55 at%, much higher than that of N-C-600 (0.47 at%), N-C-800 (1.12 at%) and N-C-1200 (0.51 at%). Notably, with the increase of N3 absolute content, the YRNH3 increases. Theoretical evidence demonstrates that the N3 structure exhibits higher adsorption energy of NO3- (Fig. 7c), lower energy barrier from *NO to *NHO, and exothermic desorption process. This work explores the relationship between the structure type of doping atoms and the NO3RR activity, which contributes to the fundamental understanding of the structural design of highly efficient metal-free carbon-based catalysts for NO3RR.
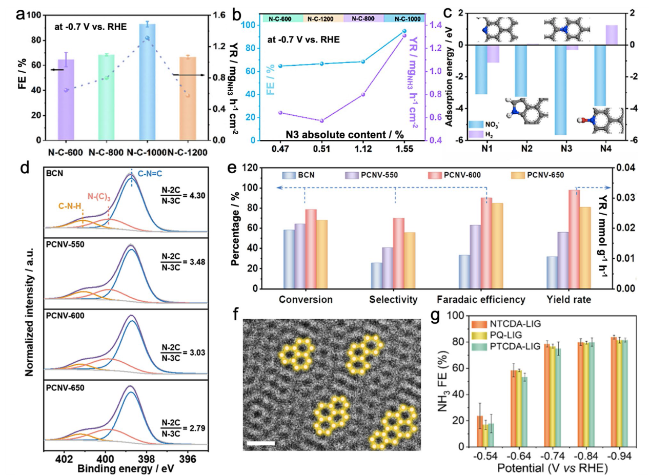
Fig. 7 a FENH3 and YRNH3 of N-C-T at -0.7 V vs. RHE. b The relationship of FENH3, YRNH3, and N3 absolute content. c The adsorption energies of NO3- and H2 [76]. d N 1s XPS spectra of BCN and all PCNV catalysts. e The comparisons of conversion rate, selectivity, FE, and YR of ammonia at -1.6 V vs. RHE over all samples [77]. f Enlargement of High-Resolution TEM images of NTCDA-LIG. g FENH3 of sm-LIGs [78] |
Defect engineering is a common method to improve the performance of electrocatalysts by adjusting the electronic structure of catalysts. For metal catalysts, abundant defects in the base material are conducive to anchoring metal atoms to improve catalyst performance. For non-metallic catalysts, defects can capture and catalyze reactive substances. Huang et al. [77] found that the polymerized g-C3N4 with a controllable number of nitrogen vacancies showed good catalytic activity for NO3RR. The porous C3N4 with enriched nitrogen vacancies (PCNV-T) was controlled by calcining Bulk C3N4 (BCN) at different temperatures (550, 600, and 650°C). The N1 XPS spectra in Fig. 7d demonstrate that with the increase in calcination temperature, the integral area ratio between N-2 C and N-3 C decreases from 4.30 to 2.79, indicating the information of nitrogen vacancy. Moreover, PCNV-600 exhibits the highest FE of 89.96% and the highest YR of 0.03262 mmol-1 g-1 h-1 (Fig. 7e). This work proves that nitrogen vacancies could promote NO3- adsorption, activation, and deionization, which provides new possibilities for the design of non-metallic catalysts.
Amorphization has become another strategy to adjust the structure and optimize the physical and chemical properties of nanomaterials [79]. Cheng et al. [78] first reported a synthetic method for converting small molecules into graphene with an amorphous/heterogeneous structure (sm-LIG). In this work, a series of SM-LiGs was prepared by using different small molecules as precursors, Including 1,4,5,8-naphthalene tetracarboxylic dianhydride (NTCDA), 9,10-phenanthrenequinone (PQ), and 3,4,9,10-perylene-tetracarboxylic dianhydride (PTCDA). As shown in Fig. 7f, the carbon six-membered rings in NTCDA-LIG material are surrounded by amorphous non-six-membered rings, featuring an intermediate structure between crystalline and amorphous. PTCDA-LIG and PQ-LIG also exhibit similar disordered structural characteristics, suggesting that sm-LIG can be randomly embedded into honeycomb nanocrystals of carbon polygons to form amorphous graphene structures. In addition, these sm-LIG materials all show relatively high NO3RR activity with FE of 80% and YR of 2200 µg h-1 cm-2 at -0.94 V vs. RHE (Fig. 7g). Thereinto, PTCDA-LIG reaches a maximum FE of 83.7% and YR of 2456.8 µg h-1 cm-2, attributing to the few structural defects in PTCDA-LIG. This work provides insight into the design of amorphous and metal-free catalysts for the efficient NO3RR.
6 Electrocatalysts for the NO2RR
NO2-, like NO3-, is a harmful substance that is widely present in the surface and groundwater [80]. NO2- can lead to methemoglobinemia and is classified by the World Health Organization as a Group 2A carcinogen [81,82]. Therefore, it is crucial to reduce NO2- in the environment and treat it to value-added species. The electrochemical reduction of NO2- to produce ammonia is a newly emerging technology that transforms harmful NO2- into high-value ammonia [83]. Notably, the solubility of NO2- in water is the highest among the nitrogen-containing species [41]. Therefore, the electrochemical reduction of NO2- to ammonia not only offers a green and low-energy alternative solution for the global ammonia industry, but also contributes to the restoration of the disrupted global nitrogen cycle. Meanwhile, the NO2RR process converts harmful pollutants into high-value ammonia, driving the development of the global nitrogen economy [84].
Currently, catalysts for ammonia production from NO2- are mainly focused on transition metals, such as Ag, Pd, Cu, Ni, Co, et al. [82,83,85]. With their distinctive 3d orbital electron configuration, transition metals can hybridize with the p orbitals of NO2-, resulting in enhanced adsorption and catalytic performance. For example, the Ag nanoarray using NiO nanosheets array on carbon cloth (Ag@NiO/CC) catalyst synthesized by Sun et al. [86] exhibited the highest FE of 97.7%, and the maximum YR of 5.751 mg h- 1 cm- 2 for converting NO2- to NH3. Based on DFT calculations, the high activity of Ag@NiO/CC is mainly due to the strong activity of Ag (100) face for NO2RR, which reduces the reaction energy barriers of *NO2 to *NO2H and *NO to *NOH, thus facilitating the NO2RR process. Meanwhile, Pd has also been extensively studied as a high-performance metal catalyst in the NO2RR. Wang et al. [87] developed Pd nanoparticles deposited on CuO nanowires (Pd/CuO NOs) as a highly active catalyst for NO2RR (the inset of Fig. 8a). Pd/CuO NOs forms a heterogeneous interface between Pd and CuO, resulting in the formation of a built-in electric field. As shown in Fig. 8b, a FE of over 90% was achieved at -1.50 V vs. RHE. XPS results indicated that the binding energy of Pd 3d and Cu 2p shifted to higher energy, whereas O 2p shifted towards lower energy, demonstrating a spontaneous electron transfer from Pd to CuO at the Pd-CuO heterogeneous interface. Furthermore, the analysis of the PDOS for the Cu d-band demonstrated that the d-band center of Pd/CuO NOs was shifted upwards by 0.16 eV compared to that of CuO NOs. This result suggests that the formation of Pd/CuO heterointerfaces could improve the electronic structure of Cu, thereby enhancing the adsorption of NO2- and reaction intermediates.
As previously mentioned, introducing a second metal can significantly enhance the catalytic activity. However, cleverly designing the interaction between the catalyst and substrate can also improve the catalytic activity of the catalyst. Li et al. developed a high metal loading (35 wt%) binary catalyst (Ni35/NC-sd) for NO2RR via utilizing sulfur diffusion to load nickel onto a N-rich carbon support [82]. The HR-TEM image (inset in Fig. 8c) clearly shows the highly coupled interface between the nickel metal and carbon layer. The XPS spectra of Ni 2p indicate that Ni35/NC-sd has a deficit electron state due to the movement towards higher binding energies. The rectifying contact with electron-rich carbon forms a Schottky barrier that increases the electric field density of the catalyst surface. Kelvin probe force microscopy (KPFM) measurements demonstrate the strength of the surface electric field related to the Ni/NC Schottky barrier (Fig. 8d and e). The enhanced electric field on the surface of the Ni35/NC-sd catalyst leads to a high FE of 99% and a YR of 25.1 mg h- 1 cm- 2 at -0.5 V vs. RHE (Fig. 8e). The intrinsic electric field effect, as one of the important means to improve catalytic activity in catalyst design. It can be achieved not only by constructing a Schottky barrier, but also by introducing dopants. Zhi et al. reported C-doped Co3O4 mesoporous nanotubes (C-Co3O4). This catalyst achieved nearly 100% FE during NO2RR within the potential window of -0.1 V to -0.6 V vs. RHE and a yield rate of 4.10 mg h- 1 cm- 2 at -0.6 V vs. RHE (Fig. 8f) [41]. DFT calculations were conducted to investigate the effect of C doping on electronic tuning, which revealed an upshift of the d-band center of C/Co3O4 compared to Co3O4. According to KPFM results, a stronger electric field on the surface of C/Co3O4 can promote the adsorption of reactants, thus enhancing the catalytic activity of NO2RR. These findings suggest that C-doped Co3O4 holds great potential as an efficient NO2RR electrocatalyst.
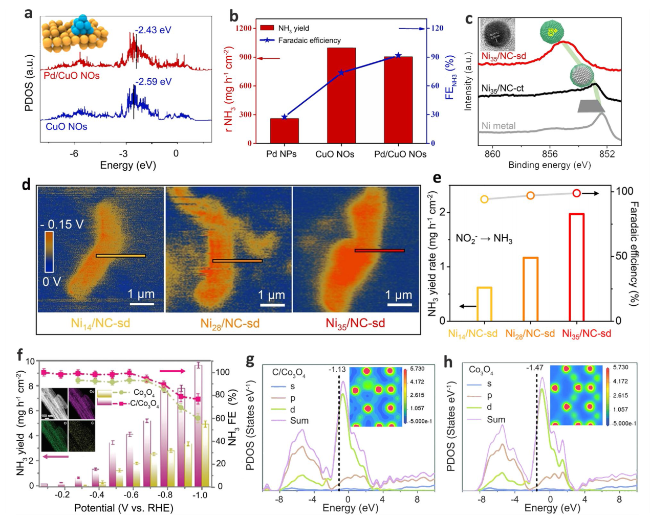
Fig. 8 a The PDOS of Pd/CuO NOs and CuO NOs. b The YR and corresponding FE of Pd/CuO NOs at different potentials [87]. c Ni 2p XPS spectra of Ni35/NC-sd, Ni35/NC-ct and Ni metal plate. d Surface Electric field distribution of Nix/NC-sd samples. e NH3 yield rates and Faradaic efficiency for NO2RR on Nix/NC-sd [82]. f The NO2RR performance of C-Co3O4 at different potentials and the corresponding EDS mapping. g, h PDOS results of C-Co3O and Co3O4 and electron contour maps obtained by KPFM (inset) [41] |
7 Electrocatalysts for the NORR
NO is a significant factor in air pollution, causing a variety of environmental problems such as acid rain, photochemical smog, and ozone depletion [88,89,90]. NO emissions primarily originate from the combustion of fossil fuels in power plants, vehicles, and factories [91]. Currently, the most commonly used method for removing NO is selective catalytic reduction (SCR) technology, which converts NO to harmless nitrogen for release [92]. However, this method is not ideal because it requires valuable ammonia or hydrogen as a reductant [93]. Recently, the electrochemical conversion of NO to NH3 has garnered extensive attention [94]. This process allows for the conversion of harmful NO into high-value NH3 through electrochemical synthesis, providing a sustainable and alternative pathway for ammonia synthesis while simultaneously restoring the disrupted global N cycle [95,96,97]. Furthermore, the exploration of the electrochemical reduction of NO to NH3 is crucial in understanding the fundamentals of electrocatalytic NO3-/NO2- reduction. Additionally, it is necessary for developing improved electrochemical denitrification and NH3 production technologies [38]. In summary, the investigation of NO electrochemistry holds fundamental scientific significance, as the developed methods can be easily extended to other environmentally friendly electrocatalytic reduction chemistries. This research serves as a valuable foundation for the development of efficient and sustainable electrochemical processes with minimal environmental impact.
DFT has played a crucial role in evaluating the activity of different metals towards NORR. As shown in Fig. 9a, Wan et al. [92] employed DFT simulations to calculate the activity and selectivity of different metals towards NORR. The red line represents the strong binding side of the volcano where the hydrogenation of *NH to *NHH is the limiting step. The blue line shows metals with weak binding of *N. Specifically, when ΔG*N is less than - 1.5 eV, ΔG*H becomes negative and H2 becomes the main product. Metals with ΔG*N greater than - 0.83 eV are not favorable for NO adsorption, resulting in lower NORR activity. When ΔG*N is between - 0.83 eV and 1.5 eV, there is a large N adsorption energy and the limiting potential is also close to or greater than 0 V vs. RHE. Theoretically, the thermodynamics of HER is unfavorable under these conditions, leading to high activity for NO reduction to NH3. Prior research has demonstrated that altering the shape, coordination number, and electronic structure of metal catalysts can modify their capacity to adsorb NO and compete with HER.
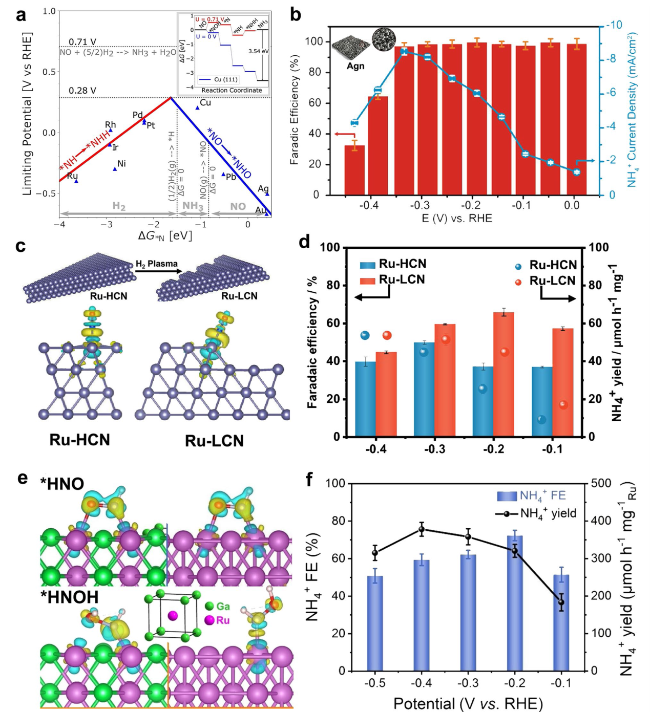
Fig. 9 a The limiting potential volcano for NO reduction to NH3 on different metals [92]. b Effect of applied potentials on FENH4+ and NH4+ partial current density for the Agn electrode in PBS-MC200-NOs electrolytes [98]. c Difference charge density of NO adsorbed by Ru-HCN and Ru-LCN. d FENH4+ and YR NH4+ of 1% NO over Ru-HCN and Ru-LCN at applied potentials [99]. e, f The charge density difference plots of *HNO (e) and *HNOH (f) intermediates adsorbed on bcc RuGa and hcp Ru [100] |
For instance, Kim et al. [98] reported a nanostructured Ag with close to 100% FE for NORR at -0.165 V vs. RHE (Fig. 9b). The nanostructured catalysts provide more active sites for NORR due to the increased surface area. Additionally, due to the size effect, nanostructured metal catalysts often exhibit improved intrinsic catalytic activity. Li et al. [99] demonstrated a low-coordinated Ru nanoarray (Ru-LCN). Differential charge density analysis (Fig. 9c) reveals that reducing the coordination number is more conducive to the adsorption and activation of the N=O bond compared to high-coordinated Ru sites. Therefore, in the NORR process, Ru-LCN exhibits significantly higher catalytic performance than high-coordinate Ru nanoarray (Ru-HCN) at low NO concentrations (Fig. 9d). Under 1% NO concentration, Ru-LCN achieved a FE of 65.96% and a YR of 45.02 µmol h- 1 mgcat-1 for NH3 at -0.2 V vs. RHE. Similarly, Zhang et al. [100] synthesized body-centered cubic intermetallic compounds of Ru and Ga (bcc RuGa) to manipulate the electron density of Ru. Surface analysis by differential charge density, as depicted in Fig. 9e, revealed that HNO adsorption is particularly favorable at the RuGa, thereby facilitating the protonation of the rate-limiting step *HNO to *HNOH. In the second protonation step, the *HNOH intermediate adsorbs on Ru in a top adsorption form, resulting in the breaking of the Ru—O bond. At this point, the Ru(O) atom no longer donates electrons, and all necessary electrons for the *HNOH intermediate are provided by the Ru(N) atom. In contrast, when the *HNOH intermediate adsorbs on RuGa, electron transfer still occurs from Ru(O) to the O atom and Ru(N) to the N atom simultaneously. The above computational results demonstrate that RuGa has a lower energy barrier in the critical hydrogenation step, facilitating the five-electron transfer involved in NORR to form NH3. As shown in Fig. 9f, the electrocatalyst demonstrates a remarkable NH3 production rate of 320.6 µmol h- 1 mgRu-1 with a corresponding FE of 72.3% at a very low potential of -0.2 V vs. RHE in neutral media.
As the most ideal catalyst for NORR, copper-based catalysts have shown outstanding performance in both DFT theoretical calculations and experimental tests (Figs. 9a and 10a). Long et al. [38] tested the performance of Cu foam for NORR through a combination of theoretical calculations and experiments. The results showed (Fig. 10b) that the copper-based catalyst exhibited excellent activity and selectivity for NORR, achieving over 90% FE at -0.9 V vs. RHE. Single-atom catalysts are highly efficient catalysts that have been developed in recent years, with a theoretical atomic utilization efficiency of 100%. As the active sites are single metal atoms, SACs possess the advantages of both homogeneous and heterogeneous catalysts. Therefore, these catalysts have inherent advantages in catalytic processes, and many previous studies have reported highly efficient SACs in electrocatalytic NORR. Chen et al. [101] synthesized a Sb1/a-MoO3 single-atom catalyst for regulating the adsorption energy between MoO3 and NO via Sb single atoms. Figure 10c reveals that the Sb site has fewer electronic states crossing the Fermi level compared to the Mo site upon the NO adsorption. This reduced interaction between Sb1-*NO electrons indicates the weak binding of *NO on the Sb1 site. Additionally, the PDOS analysis of *NO/*NHO on both catalysts demonstrated that the highest peak below the Fermi level (Ep) position of *NO on the Sb1 site was significantly lower than that on the Mo site, while the Ep positions of *NHO on both Sb1 and Mo sites were similar. The findings suggest that the Sb1 site stabilized the crucial *NHO intermediate, despite exhibiting reduced *NO adsorption. Besides, the Sb1 site maintained an optimal balance of the binding free energies of *NO and *NHO, thereby minimizing the reaction energy barrier. Consequently, this led to an acceleration of the reaction energetics for the conversion of NO to NH3 on the Sb1/a-MoO3 catalyst. Remarkably, Sb1/a-MoO3 exhibits a FE of 91.7% and the highest NH3 YR of 273.5 µmol h- 1 cm- 2 at - 0.6 V vs. RHE (Fig. 10d). By introducing heteroatoms such as B, N, P, etc., the electronic structure of metal sites in SACs can be directly tuned, thereby improving the catalytic activity. Nb-SA/BNC catalyst reported by Peng et al. [102] for NORR exhibited an ammonia YR of 8.2 × 10- 8 mol cm- 2 s- 1 at -0.6 V vs. RHE in Fig. 10e. Theoretical calculations demonstrated that the single-atomic Nb sites played a dual role in enhancing the NORR activity by promoting NO adsorption and reducing the energy barrier of the potential determining step (Fig. 10f).
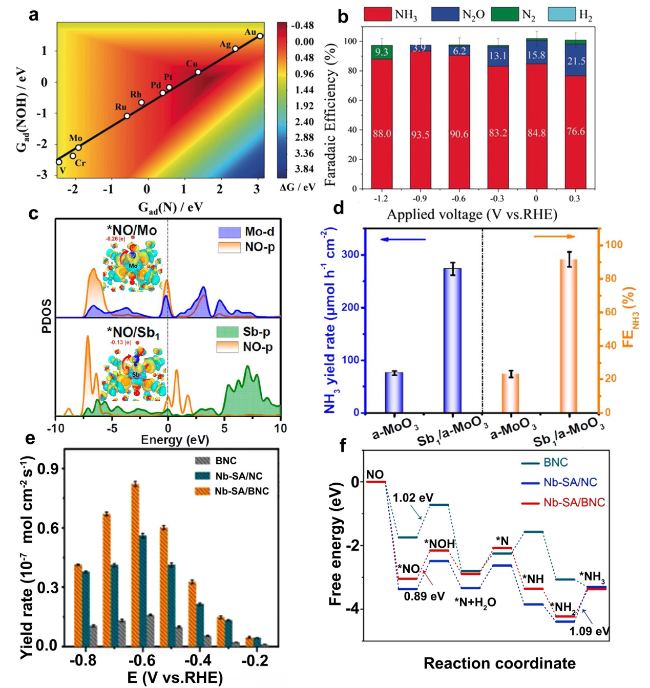
Fig. 10 a A two-dimensional activity map for ammonia production. b FENH3 of NORR on Cu foam at varying potentials [38]. c PDOS profiles and charge density differences (inset) of NO adsorption on a-MoO3 and Sb1/a-MoO3. d FENH3 and YRNH3 of a-MoO3 and Sb1/a-MoO3 at - 0.6 V vs. RHE [101]. e YRNH3 for Nb-SA/BNC at various applied potentials. f Free energy diagrams of adsorbed intermediates for electrochemical NO to NH3. [102] |
8 Conclusion and outlook
As a renewable energy source, ammonia is considered to have great potential and will be the research focus in the future energy field. The electrocatalytic process, which can be conducted under ambient conditions without carbon emissions, offers a promising strategy for environmentally friendly ammonia production. Therefore, it is promising to realize the green cycle of nitrogen species via the electrochemical process. The upcycling of nitrogenous wastes into green ammonia by a carbon-free process using electrochemical technology at room temperature is very attractive. In this review, we summarized the electroreduction pathways of various nitrogenous wastes (NO3-, NO2-, NO) to green ammonia and the current research progress. Although some promising catalysts have been reported for these three catalytic reactions (NO3RR, NO2RR, NORR) as shown in Table 1, there are still several significant challenges in the future development of this field.
Table 1 The performance of different catalysts for NO3RR, NO2RR and NORR |
| Catalyst | Electrolyte | Faradaic efficiency | Ammonia yield rate | Ref. | |
|---|---|---|---|---|---|
| Noble metals for NO3RR | Ru-ST-12 | 1.0 M KOH + 1.0 M KNO3 | > 96% at 0.2 V vs. RHE | 5.56 mol gcat-1 h-1 at -0.8 V vs. RHE | [54] |
| Ru-TiOx/Ti | 1.0 M KOH + 0.5 M NaNO3 | 87.6% at -0.3 V vs. RHE | 2.2 mol g-1 h-1 at -0.3 V vs. RHE | [18] | |
| Ru-CuNW | 1.0 M KOH + 2,000 ppm NO3- | 96.0% at -0.04 V vs. RHE | 76.5 mg h- 1 cm- 2 at -0.135 V vs. RHE | [23] | |
| Rh@Cu-0.6% | 0.1 M Na2SO4 + 0.1 M KNO3 | 93.0% at -0.20 V vs. RHE | 1.27 mmol h- 1 cm- 2 at -0.4 V vs. RHE | [57] | |
| OD-Ag | 0.1 M KCl + 0.1 M NO3- | 88.8% at -1.35 V vs. Ag/AgCl | N.A. | [55] | |
| VCu-Au1Cu SAAs | 1.0 M KOH + 0.1 M KNO3 | 98.7% at -0.2 V vs. RHE | 0.55 mg h- 1 cm- 2 at -0.2 V vs. RHE | [56] | |
| Non-noble metals for NO3RR | CoP NAs/CFC | 1.0 M NaOH + 1.0 M NaNO3 | ∼100% at -0.3 V vs. RHE | 9.56 mol h- 1 m- 2 at -0.3 V vs. RHE | [66] |
| O-Cu-PTCDA | 0.1 M PBS + 500 ppm NO3- | 85.9% at -0.4 V vs. RHE | 4.5 mgNH3 cm- 2 h- 1 at -0.4 V vs. RHE | [24] | |
| CuCoSP | 0.1 M KOH + 0.1 M KNO3 | 93.3% at -0.175 V vs. RHE | 19.89 mgNH3 cm- 2 h- 1 at -0.175 V vs. RHE | [11] | |
| TiO2 NTs/CuOx | 0.5 M Na2SO4 + 100 ppm KNO3-N | 92.23% at -0.75 V vs. RHE | 1.24 mgNH3 cm- 2 h- 1 at -0.75 V vs. RHE | [70] | |
| CuNi alloys | 1.0 M KOH + 0.1 M KNO3 | 99.0 ± 1% at -0.15 V vs. RHE | N.A. | [71] | |
| Fe-PPy SACs | 0.1 M KOH + 0.1 M KNO3 | ~ 100.0% at -0.30 V vs. RHE | 2.75 mgNH3 h- 1 cm- 2 at -0.7 V vs. RHE | [22] | |
| Fe single-atom catalysts | 0.25 M K2SO4 + 0.50 M KNO3 | 75% at -0.66 V vs. RHE | 2.00 mgNH3 h- 1 cm- 2 at -0.85 V vs. RHE | [74] | |
| Metal-free catalysts for NO3RR | N-C-1000 | 0.1 M KOH + 0.1 M KNO3 | 95% at -0.7 V vs. RHE | 1.30 mg h- 1 cm- 2 at -0.7 V vs. RHE | [76] |
| PCNV-600 | 0.5 M Na2SO4 + 100 ppm NO3--N | 89.96% at -1.6 V vs. RHE | 0.03 mmol- 1 g- 1 h- 1 at -1.6 V vs. RHE | [77] | |
| PTCDA-LIG | 1.0 M NaNO3 | 83.7% at -0.94 V vs. RHE | 2.46 mg h- 1 cm- 2 at -0.94 V vs. RHE | [78] | |
| Noble metals for NO2RR | Ag@NiO/CC | 0.1 M NaOH + 0.1 M NO2- | 97.7% at -0.4 V vs. RHE | 5,751 mg h- 1 cm- 2 at -0.4 V vs. RHE | [86] |
| Pd/CuO NOs | 0.1 M 2SO4 + 0.01 M KNO2 | 91.8% at -0.5 V vs. RHE | 0.91 mg h-1$ \mathrm{cm}_{\mathrm{cat}}^{-1} $ at -0.5 V vs. RHE | [103] | |
| Non-noble metals for NO2RR | C/Co3O4 | 0.5 M K2SO4 + 50 mM KNO2 | ~ 100% at -0.6 V vs. RHE | 4.100 mg h- 1 cm- 2 at -0.6 V vs. RHE | [41] |
| Ni35/NC-sd | 0.5 M Na2SO4 + 0.3 M NaNO2 | 99% at -0.5 V vs. RHE | 25.10 mg h- 1 cm- 2 at -0.5 V vs. RHE | [82] | |
| Cu NWs | 0.02 M NaNO2 + 0.1 M KHCO3 | ~ 100% at -1.3 V vs. RHE | 0.60 mg h- 1$ \mathrm{cm}_{\mathrm{cat}}^{-1} $ at -1.3 V vs. RHE | [104] | |
| Cu@TiO2/TP | 0.1 M Na2SO4 + 0.1 M NO2- | 95.3% at -0.6 V vs. RHE | 760.5 µmol h- 1 cm- 2 at -0.6 V vs. RHE | [105] | |
| Noble metals for NORR | Ag | 0.1 M PBS | ~100% | 0.28 mol m- 2 h- 1 | [98] |
| Ru-LCN | 0.5 M Na2SO4 | 65.96% at -0.2 V vs. RHE | 45 µmol h- 1 $ \mathrm{cm}_{\mathrm{cat}}^{-1} $ at -0.2 V vs. RHE | [99] | |
| bcc RuGa | 0.1 M K2SO4 | 72.3% at -0.2 V vs. RHE | 320.6 µmol h- 1$ \mathrm{mg}_{\mathrm{Ru}}^{-1} $ at -0.2 V vs. RHE | [100] | |
| Non-noble metals for NORR | Cu foam | 0.25 M Li2SO4 | 93.5% at -0.9 V vs. RHE | 517.1 mmol h- 1 cm- 2 at -0.9 V vs. RHE | [38] |
| Sb1/a-MoO3 | 0.5 M Na2SO4 | 91.7% at - 0.6 V vs. RHE | 273.5 µmol h- 1 cm- 2 at - 0.6 V vs. RHE | [101] | |
| Nb-SA/BNC | 0.1 M HCl | 95.3% at -0.6 V vs. RHE | 8.2 × 10- 8 mol cm- 2 s- 1 at -0.6 V vs. RHE | [106] |
(1) The ideal electrode material should have high stability for long-period cycle electrolysis. However, the stabilities of the reported catalysts are unable to meet the durability standard of industrial applications. After long-time catalytic reactions, generally, electrode materials will face problems such as electrode corrosion, structure collapse, active site inactivation, and others. Therefore, one could focus on the design of catalysts with higher stability, which would facilitate the early industrialization of the field. Effective solutions could be developed from constructing corrosion-resistant electrodes, designing tandem catalysts to avoid the aggregation of intermediates on the catalyst surface, and improving the chelation strength between the active center and ligand.
(2) The catalysts reported so far are specific to a single nitrogenous waste. These nitrogenous wastes are mostly found in industrial and agricultural effluent/gas emissions, which often contain multiple nitrogenous wastes (NO3-, NO2-, NOx). Considering that the conversion of all nitrogenous wastes to ammonia in wastewater requires complicated processes for different catalysts, designing universal catalysts for all nitrogenous wastes is promising to reduce process steps, energy consumption, and cost. At present, some existing catalysts have shown high catalytic activity for both NO3- and NO2-, but there is still no relevant research on the simultaneous catalysis of liquid and gas phase substances. The main reason is that the catalysis of gaseous nitrogenous waste requires the formation of a gas-liquid-solid three-phase steady state on the catalyst surface, which puts forward high requirements on the selectivity of the catalyst active site. It is possible to apply the design strategy of tandem catalysts, photocatalysts, and synergistic catalysts to the reduction of nitrogenous waste to ammonia.
(3) The reported experimental results of highly efficient catalysts are obtained under specific laboratory conditions, neglecting the variations in catalytic environments encountered in practical applications. These variations include factors such as electrolyte composition and concentration, supported electrolyte types, pH value, electrode potential, mass transport, gas atmosphere, and interference from other ions, among others. These factors would significantly affect the Faradaic efficiency and yield rate when dealing with nitrogenous wastes in the real environment. Therefore, researchers are suggested to simulate a more realistic catalytic environment, such as textile and nuclear wastewaters [19]. which would provide useful experimental data for large-scale treatment of nitrogen pollution.
(4) In the real environment, the concentration of nitrogenous compounds is generally lower than that reported in most articles. For example, in the case of nitrate, its content in industrial wastewater, textile wastewater, and contaminated groundwater is only 41.6 mM, 7.4 mM, and 0.9 ~ 1.2 mM, respectively. Consequently, achieving the efficient reduction of diluted nitrogenous compounds for ammonia production poses a significant challenge. Nevertheless, potential solutions include concentrating the diluted nitrogenous reagents into high nitrogenous reagents and designing highly selective catalysts tailored for treating low-concentration wastewater. These strategies hold promise for addressing the aforementioned challenge effectively [19,107].
(5) The upcycling of nitrogenous wastes into green ammonia is a very attractive catalytic field. In addition to evaluating the selectivity and yield rate of NH3, how to extract and collect the converted ammonia is the key factor to realizing the green production of ammonia energy. Meanwhile, researchers should try to adopt methods with low energy consumption and low carbon when designing feasible solutions for ammonia extraction, collection, and transportation, which does not contradict the original intention of environmental protection. Furthermore, ammonia is also a pollutant present in environment. Therefore, efficient separation of ammonia from water is equally important and must be considered in the electrochemical ammonia production process. Under alkaline conditions, the potential approaches of steam stripping and solar-driven ammonia distillation offer promising pathways for the separation of ammonia. Additionally, emerging ammonia-ion batteries present a prospective solution for ammonia separation.
(6) Metal catalysts are currently the mainstream materials for electrocatalytic NO3RR, NO2RR, and NORR, and only a few publications on metal-free materials have been reported in NO3RR. However, metal-based catalysts are confronted with some challenges such as high cost, easy poisoning of metal sites, and secondary pollution caused by metal ion leaching. The development of more low-cost and environmentally friendly non-metallic catalysts holds greater promise as well as lays the foundation for future industrialization. To solve the above problems, both single-atom catalysts and nonmetallic catalysts show great potential. However, the synthesis methods of single-atom catalysts are still very complicated at present. The development of simplified synthesis strategies for the preparation of atomically dispersed catalysts is more conducive to the wide application of metal catalysts with low loading capacity. In addition, the substrate with strong anchoring ability could be selected to prevent the accumulation or overflow of metal atoms to cause pollution.
In conclusion, electrocatalytic upcycling of nitrogenous wastes into more valuable ammonia is a fascinating and promising field with advantages in both nitrogen pollution reduction and green ammonia production. The promising field has attracted a steady stream of researchers to invest considerable efforts. In this review, the progress of NO3RR, NO2RR, and NORR catalysts is reviewed from the perspective of noble metal-based catalysts, non-noble metal-based catalysts, and metal-free catalysts (only NO3RR). In addition, researchers are encouraged to refer to the above six suggestions and it is hoped that this paper could provide more enlightenment for the future development of electrocatalytic nitrogenous wastes into green ammonia.
Abbreviations
NO3RR$\ \ \ \ \ \ \ \ $ Nitrate Reduction Reaction
NO2RR$\ \ \ \ \ \ \ \ $ Nitrite Reduction Reaction
NORR$\ \ \ \ \ \ \ \ $ Nitric Oxide Reduction Reaction
NRR$\ \ \ \ \ \ \ \ $ N2 Reduction Reaction
HER$\ \ \ \ \ \ \ \ $ Hydrogen Evolution Reaction
FE $\ \ \ \ \ \ \ \ $ Faradaic Efficiency
YR$\ \ \ \ \ \ \ \ $ Yield Rate
ECE$\ \ \ \ \ \ \ \ $ Electrochemical-Chemical-Electrochemical
g-CN$\ \ \ \ \ \ \ \ $ Graphite Carbon Nitride
TM$\ \ \ \ \ \ \ \ $ Transition Metal
ΔG$\ \ \ \ \ \ \ \ $ Adsorption Energy
DFT$\ \ \ \ \ \ \ \ $ Density Functional Theory
PDOS$\ \ \ \ \ \ \ \ $ Partial Density of States
XANES$\ \ \ \ \ \ \ \ $ X-Ray Absorption Near-Edge Structure
XPS$\ \ \ \ \ \ \ \ $ X-Ray Photoelectron Spectroscopy
KPFM$\ \ \ \ \ \ \ \ $ Kelvin Probe Force Microscopy
Acknowledgements
The authors acknowledge the financial support by the National Nature Science Foundation of China (52202372), the Sichuan Science and Technology Program (2023NSFSC0436, 2023NSFSC0089), the National Key Research and Development Project (2022YFA1505300), and the Fundamental Research Funds for the Central Universities (YJ2021151).
Authors’ contributions
P.L. and Z.J. conceived this review. Y.L. and K.L. were major contributors to writing the manuscript. P.W. participated in the discussion of this work. Z.J. and P.L. reviewed and edited the manuscript. All authors read and approved the final manuscript.
Funding
Open access funding provided by Shanghai Jiao Tong University. This work was supported by the National Nature Science Foundation of China (52202372), the Sichuan Science and Technology Program (2023NSFSC0436, 2023NSFSC0089), the National Key Research and Development Project (2022YFA1505300), and the Fundamental Research Funds for the Central Universities (YJ2021151).
Availability of data and materials
Not applicable.
Declarations
Ethics approval and consent to participate
Not applicable.
Consent for publication
Not applicable.
Competing interests
All authors declare that there are no competing interests.
Publisher’s Note
Springer Nature remains neutral with regard to jurisdictional claims in published maps and institutional affiliations.
