
1 Introduction
How to manage waste effectively is a global challenge. The United Nations Environment Programme [80] and Wu et al. [84] estimated that as many as 10 billion tonnes of waste is being generated globally every year, with over 40% being disposed into landfill. Disposal practices were analysed by Papastamoulis et al. [54] and Magrini et al. [41], who noted that sending waste to landfill produces negative externalities such as air and water pollution, particulate emissions and leachate, odours and health and safety hazards like fire. Bian et al. [8], Struthers et al. [76] and Yang et al. [86] also noted that disposal can generate greenhouse gas emissions and contribute to human-induced climate change. Disposal of organic waste leads to anaerobic decomposition and generates methane gas, recognised as a potent greenhouse gas [79]. Accordingly, countries have prioritised utilisation of methane or waste avoidance strategies within national climate change mitigation plans under the Paris Agreement [25,28].
Scholars have sought to focus on how to incentivise improvements in the sustainability of waste management practice on an economic or financial basis. While laws and regulations that either prohibit a certain practice or mandate another can be common, three general approaches or mechanisms have been identified to provide economic and financial incentives.
The first is where the positive social and environmental externalities associated with improved waste management practice are rewarded with new income. These can be described as revenue support mechanisms. Plöchl et al. [56] and Lo and Cong [38] identified systems that allow waste project proponents to increase the revenues based on monetisation of positive externalities they create by linking those impacts to the creation of renewable energy certificates or carbon credits.
The second grouping of instruments are cost of capital support mechanisms. Rossetto [63], Kapoor and Medha [33], Calvet et al. [11] and Rasheed et al. [61] broadly categorised these instruments as climate finance. This is because such instruments lead to a reduction in the cost of financing for projects that deliver positive environmental or climate-related externalities. Examples of the instruments include grants that subsidise capital cost, interest rate subsidies, investment guarantees, liquidity for financing that is not otherwise available in the market either by the tenor or volume of the financial commitment, or subordinated equity investment schemes - in which one investor, such as a climate finance fund, agrees to wait until another investor has been paid before it is compensated.
The final set of mechanisms can be described as negative externality levies. Mazzanti et al. [46] and Matheson [45] noted that various fiscal incentives from landfill charges to consumption taxes are commonly applied to waste management practices. These charges act as an incentive to find an alternative to the prevailing waste management practice.
The availability of choice in mechanisms prompts an important question, which is the focus of this paper: How important are revenue generation mechanisms relative to the others to incentivise improvements in sustainable waste management? This question shall be explored looking at applications in Australia, which provides an interesting context as it has and continues to deploy variations of all three mechanisms - revenue support, cost of capital support and negative externality levies - to encourage better waste management practice. There have been notable criticisms and rebuttals about the additionality - a term that will be explained further in Section 3.3 - of waste to energy projects in Australia [22,40]. The issues that have arisen in Australia - such as the multiple sources of revenue and questions about additionality in this context - are relevant to most countries. This is of particular importance given countries are seeking to design a new project-based mechanism under Article 6.4 of the Paris Agreement on climate change have emphasised the need to reform understanding and assessment of additionality [48,68]. Very little work has been done to analyse the impact of parallel participation in one or more forms of the support mechanisms on project additionality, be that in Australia or globally.
1.1 Research framework and chapter structure
This paper presents new and original research analysing the relative importance of carbon markets to the abatement of emissions in the waste management sector. It is structured to describe the support mechanisms available (Section 2) and then present the findings of a literature review that examined waste management and climate policy, market-based incentive mechanism applications in the context of international mechanisms under the United Nations Framework Convention on Climate Change (UNFCCC), the concept of additionality and then national level application with the example of Australia (Section 3). It then provides details of the empirical research undertaken (Section 4) and the results (Section 5), followed by the discussion and conclusion (Sections 6 and 7).
2 Theoretical description of the mechanisms
According to the Concise Oxford Dictionary of Current English [23], an incentive is “a thing that motivates or encourages someone to do something” (Page 176). This definition can be extended to methods that promote more sustainable waste management practice. As suggested in the introduction (Section 1), there are three main ways to motivate or encourage voluntary changes in practice in ways that go beyond regulatory actions to remove choice for private actors either by prohibiting certain activities or mandating others. These incentives are revenue support mechanisms, cost of capital support mechanisms and negative externality levies, which are elaborated in Sections 2.1, 2.2 and 2.3 respectively.
2.1 Revenue support mechanisms
Revenue support mechanisms allow project proponents to monetise positive impact, which can in turn boost returns above investment hurdle rates [38,56]. Such incentives often take the form of certificates or property rights issued to projects in exchange for a positive externality, which can, in turn, be sold to firms that seek to reduce their own liabilities for negative externality generation. This allows a form of market-based negotiation to take place between parties as is described within Coase’s theory [18,20,30]. The result is a new revenue stream for qualifying activities and projects.
In order to qualify for such mechanisms, projects generally need to prove they are additional to business as usual. The implication of a project not being additional is that it is business-as-usual, so its performance is the same as the baseline and its impact, by definition, is zero. Scholars have found varying levels of success of revenue support mechanisms in supporting improvements in waste management practice. Agamuthu et al. [1] found that economic incentives were among four main drivers of improved practice in Asia, along with human, institutional and environmental factors. Rasheed et al. [61] made a similar conclusion, though called for scaling-up of incentives. Asare et al. [4] found evidence that these programs work more effectively than levies and charges. Peng et al. [55] highlighted the potential for market-based systems to be expanded beyond greenhouse gas emissions and to the recovered materials themselves.
2.2 Cost of capital support mechanisms
Cost of capital is an important expense for businesses and is used in investment decision-making. Businesses use the weighted average cost of capital (WACC) as a metric that looks at the relative costs of its equity and debt financing - and the ratio at which both are used - though often defer to return on equity as the basis for investment decisions [24,74]. Economic incentives can be offered to improvements in waste management practice in the form of cost of capital support mechanisms. O’Dwyer and Unerman [53], Calvet et al. [11] and Caldecott [10] noted the impact at the macro-level on cost of capital arising from central bank practices that allocate more risk to polluting activities. These kinds of macro-level activities can have a corresponding impact on capital allocation and investment decision-making.
At the project level, scholars such as Tao et al. [78] and Amighini et al. [3] identified the broader movements in green and climate-themed finance. A number of instruments were identified that can be used to provide financial incentives for waste management projects. These include grants that subsidise the capital cost, interest rate subsidies, investment guarantees, liquidity for financing that is not otherwise available in the market either by the tenor or volume of the financial commitment, or subordinated equity investment schemes. While cost of capital support mechanisms are similar to revenue support, the positive externalities are less likely to result in creation of a property right [63].
2.3 Negative externality levies
As set out in the introduction, other instruments broadly termed negative externality levies can provide incentives for improved waste management practice and resource recovery. These arise because polluting activities attract a charge, which can be sufficient for actors to look for least costly alternatives. From a theoretical perspective, this aligns such mechanisms with the Porter’s Hypothesis, which states that higher environmental standards drive innovation and enhanced competitiveness [57,58].
Jiménez-Rivero and García-Navarro [32], Shooshtarian et al. [72] and Matheson [45] are among a number of scholars that have validated landfill charges - as an example of this kind of instrument - as a driver of resource recovery. Wu et al. [83] found that there is a tendency for waste disposal activities to seek out the lowest cost alternative, where there are differences in charges between jurisdictions, implying that higher landfill charges do not necessarily guarantee more resource recovery.
3 Literature review
This section contains details of a literature review. Its four sub-sections are broken up into waste management and climate policy, market-based incentive applications in the context of international mechanisms under the UNFCCC, the concept of additionality and then project-based mechanisms in the context of Australia. These sub-sections were selected to provide an overview of previous writings and practice background of essential need to addressing the research questions. Relevant literature was identified on recognised academic search platforms such as Google Scholar and Mendeley, as well as other relevant practice literature, using key words such as incentives, carbon markets, climate finance, waste management, additionality and market-based mechanisms.
3.1 Waste management and climate policy
There is an emerging understanding about the link between waste to landfill and its contribution to greenhouse gas emissions. Recent literature indicates several relevant areas.
The first area is the extent to which landfilling contributes to climate externalities. Nisbet et al. [51] found that atmospheric methane emissions, which arise from landfills that are not capped, were a substantial problem. Magrini et al. [41] looked at landfilling practices in the Italian region of Emilia-Romagna and found the largest climate externalities were connected to emissions from transport, though resource recovery can compensate. Liang et al. [36] used life-cycle assessment used to analyse environmental impacts of steelmaking techniques including the use of scrap steel, concluding that savings in greenhouse gas emissions were the major benefit associated with resource recovery. Rossetto [65] showed that steelmaking using recycled scrap steel can reduce greenhouse gas emissions and incentives may arise from removal of free allocation policies in the EU’s emissions trading system.
The second area is where problems should be solved. Are they a matter for sub-national entities or countries, or do they require international cooperation? Kellenberg [34] analysed trade data that indicated a high degree of waste trade between counties, especially those in regional proximity. Martínez et al. [44] tracked over 100 categories of waste over the 2001-19 revealed traded waste moves mainly from developed to developing countries.
Rossi and Morone [66] noted a recent tendency for some countries to prohibit international trade in waste trade, both imports and exports, which can cause unintended consequences. Along these lines and as an example, the Council of Australian Governments [19] outlined the national plan to limit or prohibit exports of plastics, paper, tyre and glass waste. The literature suggests that regional waste ecosystems exist, though some governments can and do intervene, limiting imports and exports of waste.
The third and final area is what the barriers are to better practice and, by extension, what are the most effective solutions are to encourage reductions in landfilling. Papastamoulis et al. [54] carried out a literature review-based study to identify the recoverable value in waste sent to landfill to move away from the zero-value mentality. Allwood [2] had previously promoted a waste hierarchy that recognises the recoverable value in waste materials, in an attempt to move away from the zero-value mindset. Mahpour [42] identified that there were many barriers to resource recovery and they needed to be prioritised. Mhatre et al. [47] found that meeting or complying with environmental standards is, itself, a barrier to resource recovery. Xie et al. [85] noted the most efficient solution would come from maximising the emission reduction potential of landfill avoidance.
Benachio et al. [7] recognised that cost effectiveness of investments is an important barrier limiting further resource recovery in construction and demolition waste. Su et al. [77] undertook research to design policy mechanisms and simulate efficiency, which concluded subsidy policies were inferior to market-based approaches. Maqsood et al. [43] carried out a review of waste end-use markets in Australia indicated they are underdeveloped and recommended removal of information barriers.
Söderholm and Ekvall [73] carried out a review-based study looking at impacts of tradable recycling credits, virgin material taxes and recycling subsidies. Shah et al. [70] recommended using waste as a fuel source for power generation based on a study in India. Purchase et al. [60] called for a global framework including incentive mechanisms and further trade, contrasting with the kind of waste trade prohibition policies. Schwarz et al. [69] carried out life cycle assessment to show that valuing greenhouse gas emission reduction potential is the best way to reduce plastic waste to landfill. Ginga et al. [27] carried out a study in China suggesting that adopting circular business models will lead to less waste going to landfill.
Shooshtarian et al. [71] suggested policy responses including subsidies and taxes. Asare et al. [4] examined waste management practice in Ghana revealed that incentives are needed to motivate private actors. Peng et al. [55] sought to ask why a cap-and-trade program cannot be designed for waste trading like those used for greenhouse gas emissions. Hua et al. [31] found that incentive policies will provide a clearer driver for waste recovery than subsidies based on investigations in China.
3.2 Market mechanisms in the context of international climate change cooperation
The following section recounts literature on international climate change cooperation under the UNFCCC, deployment of market-based mechanisms and issues associated with transition from the Kyoto Protocol architecture to the Paris Agreement. It also covers the development of the so-called Nationally Determined Contributions (NDC) under the Paris Agreement, the extent to which emissions from landfilling of waste represent a focus within these plans and the intention among countries to use market mechanisms to achieve these goals.
On the deployment of market mechanisms, significant experience has been gained through the Clean Development Mechanism (CDM) a project-based mechanism under the UNFCCC’s Kyoto Protocol. The CDM’s twin purpose was to assist developing countries achieve sustainable development and countries with targets under the Kyoto Protocol to achieve them at lowest cost. The mechanism has seen over 8,000 projects and programs registered worldwide, leading to reduction just above 2.4 billion emission reductions since its inception in 2005 [81]. Credits issued under the CDM could be sold to companies needing to comply with compliance requirements under the various emissions trading programs, as well as by countries seeking to meet targets under the first and second commitment periods of the Kyoto Protocol. The revenue transformed marginal projects, which were not otherwise viable, into profitable investments.
Several scholars have considered the effectiveness of the CDM. Lo and Cong [38] conducted analysis of over 3,000 CDM projects and found that four countries - China, South Korea, Brazil and India - dominated the supply side of the market. Butu et al. [9] acknowledged the CDM’s major criticism is that it failed to achieve even geographical distribution, particularly in the least developed countries, though it did succeed in delivering sustainable development benefits. Rossetto [64] found that the CDM’s failure to achieve a more balanced geographical distribution was partly connected to the decay in demand for its credits caused by the transition from the Kyoto Protocol to the Paris Agreement.
The transition from the 1997 Kyoto Protocol (Kyoto) to Paris Agreement (Paris) was triggered by an understanding among countries that the Kyoto represented an imperfect approach to tackling climate change at the international level. Kuyper et al. [35] undertook a stocktake of UNFCCC climate negotiations and found one of the major limitations of Kyoto was that it featured emission reduction targets only for developed countries. The study noted that concerns had also arisen over environmental integrity of CDM projects, with some believing it had allowed some projects to be registered and produce credits that were not truly additional to business-as-usual practice. In other words, the additionality - a concept that will be explored in more detail in Section 3.3 of - was brought into question. Michaelowa et al. [49] noted that environmental integrity concerns associated with additionality were an important factor behind the definition of a new project-based incentive mechanism - known as the Article 6.4 mechanism (of the Paris Agreement) to eventually replace the CDM. Another feature of the Paris Agreement is that each country now has its own emission reduction targets, known as its Nationally Determined Contribution (NDC).
Reductions in emissions from waste are a common measure under the Paris Agreement within NDCs. Powell et al. [59] noted countries representing up to 85% of emissions from global waste generation plan to reduce greenhouse gases from the sector.
Table 1 provides an overview of the NDCs put forward by a selection of countries in Asia and the Pacific. It shows each country’s 2030 emission reduction target, its base year emissions and the relative contribution that the waste sector makes to its overall emissions. All data in the table was taken from the documents prepared by each country and published on the NDC registry (https://unfccc.int/NDCREG). The column farthest to the right of the table illustrates whether those countries intend to use the market-based (revenue support) mechanisms of the Paris Agreement (such as the Article 6.4 mechanism) to assist in achievement of either the conditional or unconditional components of the NDC. Only Malaysia explicitly excluded the use of markets and Australia has not yet decided.
Table 1 Summary of nationally determined contributions of selected countries in Asia & the Pacific and contribution of waste |
| Country | 2030 Target | Base year | Base year emissions | Intention to use markets | ||
|---|---|---|---|---|---|---|
| Total (tCO2e) | Waste (tCO2e) | Waste (%) | ||||
| Australia | 43% reduction in total absolute emissions by 2030 | 2005 | 608,650,000 | 14,280,000 | 2.35% | Maybe |
| China | 60-65% reduction in emissions intensity per unit GDP by 2030 | 2005 | 7,250,000,000 | 127,000,000 | 1.75% | Yes |
| India | 45% reduction in emissions intensity per unit GDP by 2030 | 2005 | 1,820,000,000 | 67,800,000 | 3.73% | Yes |
| Indonesia | 29% (unconditional) and 41% (conditional) reduction on business as usual | 2005 | 628,000,000 | 93,800,000 | 14.94% | Yes |
| Japan | 46% reduction in total absolute emissions by 2030 | 2013 | 1,340,000,000 | 22,530,000 | 1.68% | Yes |
| Malaysia | 45% reduction in 2005 absolute emissions by 2030. | 2005 | 252,000,000 | 21,900,000 | 8.69% | No |
| New Zealand | 50% reduction in 2005 absolute emissions by 2030. | 2005 | 57,240,000 | 4,380,000 | 7.65% | Yes |
| Philippines | Peak in absolute emissions by 2030. 75% reduction, 2.5% of which is unconditional. | 2005 | 159,000,000 | 16,400,000 | 10.31% | Yes |
| Singapore | Reach an absolute target of 60mt of emissions by 2030. | 2005 | 36,300,000 | 338,000 | 0.93% | Yes |
| South Korea | 40% reduction on absolute emissions by 2030 from 2018 base year. | 2018 | 739,000,000 | 19,200,000 | 2.60% | Yes |
| Thailand | Unconditional 30% reduction against business as usual and conditional 40%. | 2005 | 350,000,000 | 19,400,000 | 5.54% | Yes |
| Vietnam | Unconditional 16% reduction on business as usual and unconditional 44%. | 2005 | 217,000,000 | 12,400,000 | 5.71% | Yes |
Source: NDC Registry (https://unfccc.int/NDCREG accessed on 13 June 2023) |
Countries included in Table 1 can be viewed as part of a regional ecosystem in which waste is imported and exported. Waste generated in one nation within the region may find its way into the emissions inventory of another. As previously covered in Section 3.1, Australia is now taking action to limit exports of plastic, rubber tyre, glass and paper waste, creating some friction within this ecosystem. It was selected as the focus of this study because export constraints will lead to increasing domestic waste management requirements, the unintended consequence of which may be increased risk of landfilling.
3.3 Exploring additionality
As can be seen from the previous section, much of the criticism of the CDM originated from concerns about the additionality of project activity. Additionality is relevant not just to the CDM but is also an important concept in determining which activities are eligible for financial incentive programs. Luukkonen [39], for example, indicated that additionality has been used in assessment of eligibility for grant programs in the European Union that have sought to incentivise research and development by private sector entities. Carter et al. [13] also found it was relevant to allocating capital under Official Development Assistance (ODA) programs. The authors found, however, that it was often a subjective process and that systemic biases among development finance institutions that lead to projects receiving ODA funding, rather than objective evaluation of the business as usual scenario.
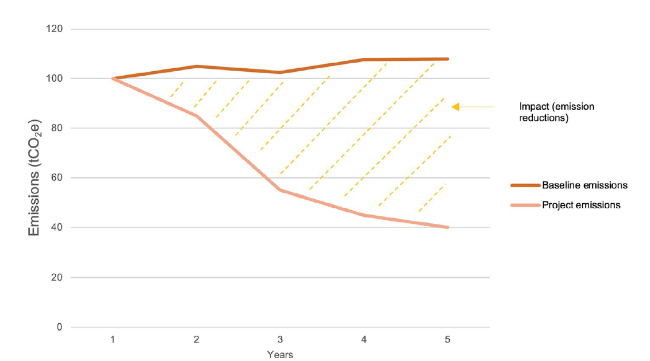
Applying and assessing additionality has been studied closely over the past two decades. Figure 1 below, adapted from Rossetto [62] and Baxter and Gilligan [6], illustrates the impact of additionality in the context of a greenhouse gas emission reduction project, where the emissions of the project scenario are below the baseline. In such cases, provide the project is proven to be a genuine departure from business as usual, impact is the difference between the baseline and project emissions.
A common form of additionality demonstration used under the CDM was barrier analysis, whereby proponents could seek to demonstrate that another barrier, such as unfamiliarity of new technology, prevented its deployment.
Another form was financial additionality, which asserts that project proponents make investment decisions for lower emissions alternatives based on the price signal of the revenue - or carbon finance - available through the CDM. While laudable, financial additionality became a highly scrutinised and criticised practice. Schneider [67] evaluated 93 registered CDM projects suggests that not all claims are substantiated with credible evidence of financial additionality. Streck [75] acknowledged that testing for financial additionality will always be controversial, though steps can be taken to reduce controversy by maintaining detailed records of investment decision-making.
The aim of financial additionality is to demonstrate that a project fails to meet an investment hurdle rate without inclusion revenues from carbon finance; and thereby the default scenario is that the status quo prevails with a higher emissions baseline. Figure 2, adapted from Rossetto [62], illustrates how carbon finance allows an energy generation project’s modelled return on equity to be increased above a hurdle rate of return. In other words, before carbon finance revenues are considered, the project return is insufficient to meet the hurdle rate and therefore, assuming rational investment decision-making, would not proceed. A project is considered financially additional if new revenues support its return to the extent it can achieve a nominal investment hurdle rate. Figure 2 illustrates the message that the records identified by Streck [75] would need to convey.
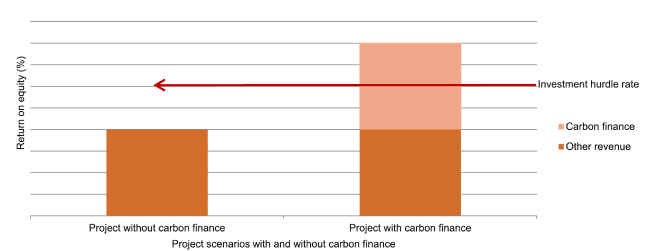
Fig. 2 Illustration of how carbon finance impacts project financial performance by raising returns above hurdle rates. Source: Rossetto, D. (2014). Case studies of climate resilience in urban areas and their funding UNFCCC Standing Committee on Finance Annual Forum - Montego Bay, Jamaica, 21 & 22 June 2014. Montego Bay, UNFCCC, Page 14 |
Carmichael et al. [12] highlighted how critical internal rate of return benchmark analysis is to determining financial additionality based on a windfarm project case study. Project-level investment decision-making integrates different sensitivities, where the revenues that projects are able to generate are assigned probabilities. In this respect, carbon finance can become important at the margin of meeting a project’s investment hurdle rate. A decision to not register a project to generate carbon finance revenues is, in effect, assignment of 100% probability that it will generate zero revenues from this item over its lifespan. However, under certain scenarios of probability, the revenues are enough to move the project’s return above a nominal hurdle rate.
Dutschke and Michaelowa [21] drew attention to the potential for CDM projects to receive funding through other concessional sources such as ODA. This raised a concern that the CDM incentive, which was a revenue support mechanism, may lead to diversions of ODA, a cost of capital support mechanism. The CDM Executive Board [14] eventually made it a condition of participation in the CDM that projects must not result in diversions of ODA. Rossetto [62] and then again [63] pointed out that a project’s participation in multiple support mechanisms - revenue support, cost of capital support and negative externality levies - may not be mutually exclusive. Notwithstanding, Michaelowa et al. [48] suggested that project level additionality assessment under Article 6.4 continue to use financial additionality.
3.4 Project-based mechanisms in the context of Australia
The final section of the literature review considers the application of project-based mechanisms in Australia. The primary revenue support mechanism for which waste management projects are eligible is the Carbon Credit (Carbon Farming) Act 2011 (carbon market), which produced a carbon credit known as an Australian Carbon Credit Unit (ACCU). Under the carbon market, the following kinds of projects are eligible to generate carbon credits known as Australian Carbon Credit Units (ACCU): (1) Capture and destruction through combustion of fugitive methane emissions occurring at coal mines, (2) Reductions in the emission-intensity of various forms of transport, (3) Energy efficiency projects and programs implemented either as single projects or aggregated programs at commercial and industrial facilities, (4) Capture and combustion of landfill gas and agricultural waste, (5) Alternative treatment of organic waste, (6) Capture and combustion of biogas from wastewater, (7) Methods for the land sector, including increasing soil carbon, reducing livestock emissions, expanded opportunities for environmental and carbon sink plantings and reforestation and (8) Other methods that result in emissions reductions that take place in facilities that are required to report under the National Greenhouse and Energy Reporting Act. Of the above, methods (4) and (5) are the primary opportunities connected to waste.
For much of its history, demand for ACCUs in the domestic carbon market has relied on a government procurement program known as the Emission Reduction Fund (ERF). Clarke et al. [16] illustrated the budget allocated for the ERF provides about 50 per cent of that required to meet Australia’s greenhouse gas abatement commitments. Nong and Siriwardana [52] highlighted the limitations of public procurement to achieve Australia’s emission reduction goals and the need to find market-based means of stimulating demand.
White [82] illustrated the emergence of private demand for ACCUs to replace the ERF approach in Australia, beginning with voluntary market demand. The Australian Government [5] subsequently acknowledged the need for private compliance demand and published Safeguard Mechanism policy reforms. Figure 3 provides voluntary private and state and territory government demand for ACCUs during the period 01/01/2019 to 31/03/2022 along with the reason for cancellation.
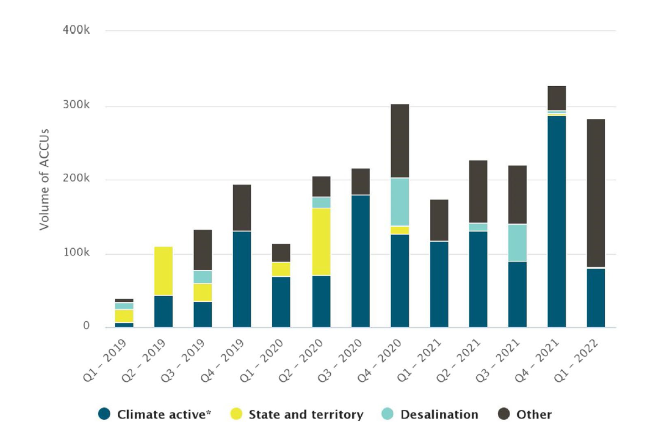
Fig. 3 Voluntary private and state and territory demand for ACCUs and reason for cancellation. Source: Clean Energy Regulator |
Notwithstanding, the environmental integrity of Australian carbon market has been the focus of scrutiny, in particular waste to energy projects. Baxter and Gilligan [6] drew attention to the fact that waste to electricity generation projects also have the opportunity to generate electricity, which in turn has the potential to generate tradable certificates under the Renewable Energy (Electricity) Act 2001 (renewable energy certificate market). In effect, this provides waste to electricity project operators with an opportunity to produce three different forms of revenue - electricity, renewable energy certificates and carbon credits - which led to questions about additionality for the purposes of the carbon market.
MacIntosh [40] criticised the additionality of ACCUs issued to waste to energy projects on the basis of marginal costs and operational decisions, rather than consideration of investment decisions. The Emissions Reduction Assurance Committee [22] responded to criticisms raised by MacIntosh stating that ACCU revenues were needed but stopped short of providing a detailed explanation why. This was a similar the conclusion of Chubb et al. [15] who undertook a review into the environmental integrity of the Australian carbon market.
Australian carbon market projects also have access to other support mechanisms including cost of capital support. The primary support comes through the Clean Energy Finance Corporation (CEFC), which is a financial institution established under federal legislation that provides loans and investments to improved waste management and resource recovery projects. Geddes et al. [26] noted that one of the main roles of the CEFC, similar to state-sponsored green banks in other countries, is to “de-risk projects” and “crowd-in additional finance” (Page 168) - including through the provision of cost of capital support. The CEFC and Arup [17] revealed that there was a healthy future pipeline of energy from waste projects in Australia that would involve diversion of waste from landfill.
Australia also has a number of negative externality levies that influence the waste sector and act as incentives for resource recovery. Landfill charges are established by each state on an individual basis, though there are variations as can be seen in Table 2 below.
Table 2 Summary of landfill charges across Australian states |
| State | Metropolitan | Regional |
|---|---|---|
| New South Wales | \$146/tonne | \$84/tonne |
| Queensland | \$80/tonne | \$80/tonne |
| South Australia | \$143/tonne | \$71/tonne |
| Tasmania | \$20/tonne | \$20/tonne |
| Victoria | \$125/tonne | \$110/tonne |
| Western Australia | \$70/tonne | \$70/tonne |
Source: Clean Energy Finance Corporation and Arup [17], Page 19 |
In principle, these charges provide an incentive to recover resources, though the Clean Energy Finance Corporation and Arup [17] highlight that recovery businesses must still set tipping fees competitively with respect to these levies. Wu et al. [83] noted that firms may arbitrage the different landfill charges leading to mobility of waste in Australia.
Finally, Australia has introduced from 2020 prohibitions on the export of paper, plastics, glass and tyres [19]. While this is a regulatory solution, it can also provide an incentive for resource recovery that, in turn, may lead to higher levels of retention of social and economic benefits within Australia [84].
3.5 Summary of the literature review
The preceding literature covered topics from waste management and climate policy, market-based incentive applications in the context of international mechanisms under the UNFCCC, the concept of additionality and then project-based mechanisms in the context of Australia, relevant to addressing the research questions. The review revealed that very little work has been done on analysing the impact of parallel participation in one or more forms of the support mechanisms on project additionality. This is a matter of importance not only to the Australian carbon market but also to other countries, who are seeking to utilise international and domestic incentive mechanisms to achieve emission reduction and waste management goals.
4 Methodology
The methodology was designed to explore answers to the research question posed in Section 1: How important are revenue generation mechanisms relative to the others to incentivise improvements in sustainable waste management? To respond to this research question, two sub-questions were formulated as follows: (1) How extensively are waste sector abatement opportunities represented so far within those that have generated ACCUs? (2) What is the capitalised contribution to equity returns of ACCU revenues over a project’s crediting period?
4.1 Design
Research design was established to respond to each of the sub-questions as outlined below:
Sub-question 1. How extensively are waste sector abatement opportunities represented so far within those that have generated ACCUs?
To answer this question, longitudinal analysis was used to examine projects registered under the Australian Carbon Credit (Carbon Farming) Act 2011 over the 10-year period covering the financial years 2012-13 to 2021-22 to determine the relative share of waste projects in generating ACCUs and the contributions made by projects using different waste methods. Waste methods used were then compared with the potential for resource recovery and other abatement projects at higher stages in the waste hierarchy to determine the extent to which project deployed to date are comprehensive.
Sub-question 2. What is the capitalised contribution to project equity returns of ACCU revenues generated over a project’s crediting period?
To answer this question, a financial model was used to examine the impact of ACCU revenues on project equity returns under different scenarios that tested sensitivities of two separate theoretical projects - Project one being a 2 MW biogas cogeneration plant and Project two being a 30 MW energy from waste project—under different ACCU price levels and in different states of Australia connected to the National Electricity Market (NEM) using average wholesale electricity prices across those states based on the outcomes in the 2020/21 and 2021/22 financial years, renewable energy certificate price levels, loan to value ratios and terms of debt financing. The projects were selected to represent the two main methods of producing energy from organic waste: anaerobic decomposition and incineration.
These projects were selected because they deploy electricity generation technologies, meaning they have several revenue streams (electricity and LGCs). They also both involve diversion of waste from landfill and are, by consequence, operating in resource recovery; at higher stages in the waste management hierarchy than landfilling. They represent the next generation of emissions reductions (moving beyond landfill gas to energy) achievable within the waste management sector. This will help to address the gap identified in the literature, by allowing a study into the impact of parallel participation in one or more support mechanisms on project additionality.
4.2 Data collection
Data was collected separately to respond to each of the approaches, as described below:
Sub-question 1. How extensively are waste sector abatement opportunities represented so far within those that have generated ACCUs?
For the longitudinal analysis, data was collected from the Australian Clean Energy Regulator and sorted by method used, which included issued ACCU volumes by vintage year for each project. During the period 31 December 2012 and 30 June 2022, there had been 124 million ACCUs issued from 1,244 active and registered projects with 256 others revoked. Table 3 below provides total ACCU issuance during the period 31/12/2012 to 30/06/2022 with an annual breakdown of issuance over this timeframe, which was the broader data pool on which the analysis is based.
Sub-question 2. What is the capitalised contribution to project returns of ACCU revenues generated over a project’s crediting period?
In order to carry out the analysis using the financial model, data was collected on the following parameters: (a) the capital costs and (b) operation and maintenance costs of the hypothetical project, as well as (c) the average wholesale electricity prices by state, (d) the average renewable energy certificate prices and (e) broad terms and conditions for the debt financing. Finally, as the sensitivities were tested based on ACCU prices, final data set (f) was used. Historical data, rather than forecasts whose accuracy is difficult to verify, were used as the basis for the data parameters (a) to (f).
Data parameter (c) was sourced from the Australian Energy Regulator and encompassed average annual wholesale electricity prices during the 2020/21 and 2021/22 financial years for states connected to the National Electricity Market (NEM), including New South Wales (NSW), South Australia, Victoria, Queensland and Tasmania, as presented in Table 5 below.
Data parameter (d) was obtained from the Clean Energy Regulator based on LGC spot prices over the same period as the wholesale electricity prices above, which is 01/07/2020 through to 30/06/2022. During this period, there was some volatility with prices going as low as AUD \$30 per certificate and reaching the AUD \$50 mark at times. As the LGC price is not a sensitivity parameter flexed for the results presented in Section 5, the average of these prices was used for the analysis, which was AUD \$41.25 per certificate.
For data parameter (e), the broad terms and conditions of debt financing were based on a classical non-recourse project finance structure in which the lender(s) secures the loan against the assets of the project and not the assets of the sponsor. The amortisation profile for the loan was selected as 20 years on a foncier repayment schedule, which means that the entire loan is discharged net of interest margin payments in 12 equal amounts each year.
While it is somewhat unusual for private sector project lenders to make debt available on a 20-year tenor, the equity contribution of the sponsor(s) was set at 50% rather than the more typical 30%. As analysis of project returns was forward-looking, the sensitivity of returns was modelled based on the most recent lending rates to medium and large businesses published by the Reserve Bank of Australia, the nation’s central bank, being 5.75% and 4.93%. These rates are for corporate lending not non-recourse finance, though the lower rate illustrates the concessional rate that would apply to a cost of capital support mechanism.
For data parameter (f), ACCU data was initially obtained from the Clean Energy Regulator that illustrated the ACCU prices and forward transaction volumes that emerged from the fourteen Emission Reduction Fund auctions held between April 2015 and April 2022. This data is presented in Table 6.
Separate data tracking the secondary market prices between the period 01/07/2021 and 31/01/2023 was also considered, which showed considerable volatility and variation in pricing from the auction results. In particular, there was a lowest price of approximately AUD \$20/t at the beginning of July 2021 and a high of just above AUD \$55/t in January 2022, all of which are above the highest price recorded at auction of AUD \$17.35/t. Given that secondary market prices are more volatile than the auctions, sensitivities of AUD \$0 as if there were no carbon price at all (Scenario one), \$17.35/t the highest and most recent auction price (Scenario two) and \$50/t (Scenario three) were considered. In addition to parameters (a) to (f), saved landfill charges – acting as a form of negative externality levies - were also included at the regional rates by state provided in Table 2. This assumes that proponents would have sought to find an alternative to metropolitan charges.
Table 3 Total ACCU issuance during the period 31/12/2012 to 30/06/2022 |
| Financial year | Total ACCUs issued |
|---|---|
| 2021-22 | 16,508,527 |
| 2020-21 | 16,466,275 |
| 2019-20 | 15,476,458 |
| 2018-19 | 13,663,409 |
| 2017-18 | 12,207,903 |
| 2016-17 | 13,151,991 |
| 2015-16 | 10,719,735 |
| 2014-15 | 9,318,106 |
| 2013-14 | 4,380,473 |
| 2012-13 | 1,750,179 |
| Total | 113,643,056 |
Source: Clean Energy Regulator, 12 April 2023 |
Table 4 Parameters of the two theoretical projects |
| Parameter | Project one (Biogas) | Project two (Energy from waste) |
|---|---|---|
| Technology | Complete system with feedstock logistics, pre-treatment, digesters, gas management, CHP units, heat recovery, electrical generation, equipment & balance of plant. | Incineration (mass burning) with reciprocating grate and mechanical draft cooling tower. |
| Installed capacity (MW) | 2 MW | 30 MW |
| Fuel | Agricultural residues, energy crops, food waste, manures, sewage, municipal solid waste | Solid waste |
| Capital cost | AUD \$28.6 million, including land. | AUD 594.94 million, including land. |
| Operation & maintenance cost | AUD \$ 1.85 million per year. | AUD 6.4 million per year |
| Annual electricity generation | 16,700 MWh per year. | 207,675 MWh per year |
| Economic life | 20-25 years | 30 years |
| Investment evaluation period | 20 years | 20 years |
Source: Australian Energy Market Operator 2022 Cost and Technical Parameter Review |
Table 5 Average annual wholesale electricity prices during the 2020/21 and 2021/22 financial years (AUD) |
| Financial year / state | NSW | Queensland | South Australia | Tasmania | Victoria |
|---|---|---|---|---|---|
| 2020-21 | 72 | 66 | 53 | 45 | 51 |
| 2021-22 | 144 | 178 | 125 | 90 | 104 |
Source: Australian Energy Regulator |
Table 6 ACCU auction results including contracted volumes and clearing prices |
| Auction | Date | Volume | Price (AUD) | Optiona |
|---|---|---|---|---|
| 1 | April 2015 | 47,333,140 | \$13.95 | No |
| 2 | November 2015 | 44,861,010 | \$12.55 | No |
| 3 | April 2016 | 45,949,842 | \$10.23 | No |
| 4 | November 2016 | 26,668,883 | \$10.69 | No |
| 5 | April 2017 | 8,805,722 | \$11.82 | No |
| 6 | December 2017 | 7,803,535 | \$13.08 | No |
| 7 | June 2018 | 6,323,594 | \$13.52 | No |
| 8 | December 2018 | 3,267,279 | \$13.87 | No |
| 9 | July 2019 | 59,000 | \$14.17 | No |
| 10 | March 2020 | 1,424,771 | \$16.14 | Yes |
| 11 | September 2020 | 6,284,717 | $15.74 | Yes |
| 12 | April 2021 | 6,623,286 | \$15.99 | Yes |
| 13 | October 2021 | 6,840,577 | \$16.94 | Yes |
| 14 | April 2022 | 7,593,036 | \$17.35 | Yes |
Source: Clean Energy Regulator, 16 June 2023 aThe fifth column with the heading option refers to the introduction of a right for successful proponents that would allow them to exit contracted arrangements with the ERF and sell ACCUs instead on the market. In effect, this is a put option underwritten by the ERF |
5 Results
The response to sub-question one (How extensively are waste sector abatement opportunities represented so far within those that have generated ACCUs?) revealed in the first instance that waste methods have so far generated almost a third (38.6 million, 31%) of the ACCUs issued between 01/07/2012 and 30/06/2022. The largest producers of ACCUs over the timeframe have been vegetation methods at just over 69.3 million. The full breakdown is shown in Fig. 4 below.
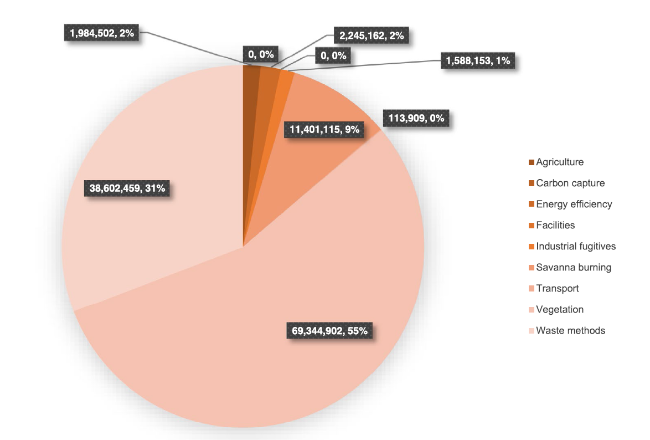
Fig. 4 Breakdown of ACCUs issued between 01/07/2012 and 30/06/2022 by method type. Source: Based on data from the Clean Energy Regulator |
Within the waste methods, the predominant source of ACCU generation were methods connected to the generation of electricity from landfill gas, which produced over 34.5 million of the credits issued during that timeframe. The remaining 4.1 million credits were generated through alternative waste treatment, commercial and industrial wastewater and separated organic waste methods, which amounts to just over 10% of the total. These figures are illustrated in Fig. 5. With nearly 90% of the total issued credits being from landfill gas to energy projects - which utilises anaerobic digestion to convert energy in the waste into methane which can then be used for power generation by combustion - it is difficult to conclude that the full array of resource recovery and abatement projects is making a substantial contribution as of 30/06/2022, even if landfill gas methods are making up almost one third of the supply side of the market.
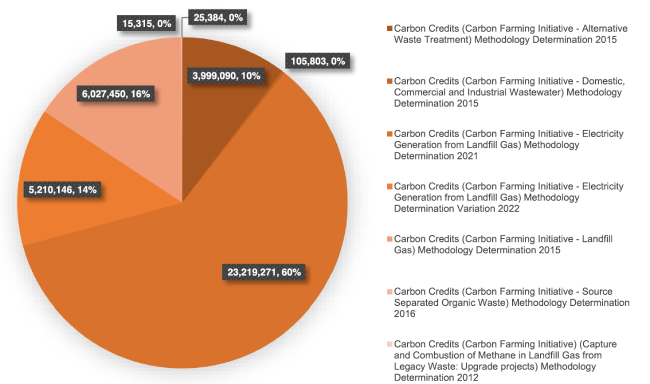
Fig. 5 Breakdown of ACCUs issued between 01/07/2012 and 30/06/2022 by waste method. Source: Based on data from the Clean Energy Regulator |
The response to sub-question one (What is the capitalised contribution to project equity returns of ACCU revenues generated over a project’s crediting period?), results of the equity return analysis are presented in Figs. 6 and 7 below. In the results, project one and two consistently return positive pre-tax equity return results in most states using average price data across 2020-21 and 2021-22. Where equity returns are negative, it means that the project’s cash flow has not been able to return the invested equity within the 20 year timeframe though it may be able to do so if one considers cash flows beyond 20 years. Where the returns are shown as 0.00%, these were cases where the project had no chance of delivering a positive equity return. Pre-tax equity returns are marginally superior when lower interest rates apply, which is logical given that less project revenue is needed for debt service and more can be dedicated to repaying shareholders. Projects one and two are generally more viable when 2021-22 average wholesale electricity prices are used, given that these were considerably higher across all states compared to 2020-21. The state where a project is based can affect pre-tax returns due to the variability in wholesale electricity prices. ACCU revenues, when not zero, contribute between 2-10% to pre-tax equity returns, depending on the project and scenario. Given the volatility in other values such as interest rates and wholesale electricity prices, this may be an important contribution. Having several sources of revenue - wholesale electricity, renewable energy certificates, avoided landfill charges and sales of ACCUs - may also assist in managing volatility across the various sources.
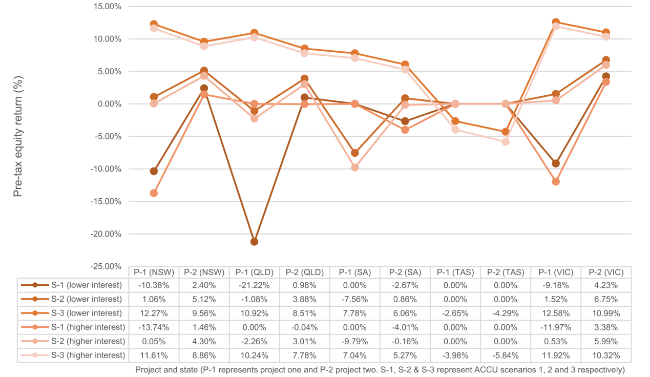
Fig. 6 Pre-tax equity returns based on forward electricity wholesale prices assumed to be equivalent to NEM average by state in 2020-21 |
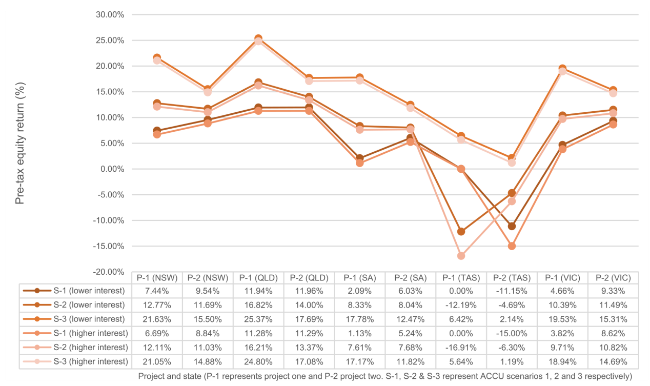
Fig. 7 Pre-tax equity returns based on forward electricity wholesale prices assumed to be equivalent to NEM average by state in 2021-22 |
6 Discussion
While waste-sector projects made up nearly one third of the entire supply side of the ACCU market from its inception until the middle of 2022, landfill gas to energy projects made up almost 90% of total supply of waste-based credits. Nearly a quarter of all the issued ACCUs to that point, relied upon the continuation of practice that sends waste to landfill. There is little evidence that the carbon market in Australia is encouraging practices that engage at stages higher up the waste hierarchy that reduce the amount of waste being produced or the degree of resource recovery. This supports the findings of Nisbet et al. [51] that the market finds the lowest hanging fruit,and revenue support incentives are not yet sufficient to encourage mitigation from higher stages of the waste mitigation hierarch.
This paper also addresses the identified need (Refer literature review, Section 3.5) for analysis of the impact of parallel participation in one or more forms of the support mechanisms on project additionality. It showed that, for the hypothetical biogas and energy from waste projects it analysed, both of which involve diversion of waste from landfill, ACCUs can form a significant part of capitalised returns; and therefore may be part of the underlying reason why a private operator would choose to commit to such a project. This is notwithstanding the existence of other revenue streams such as wholesale electricity, avoided landfill charges and renewable energy certificates, this shows that carbon finance is an enabler of more emission reduction potential within the waste management sector, as it can act as an incentive for investment by private actors leading to new and additional project activity. This addresses the issues raised by Baxter and Gilligan [6] and contradict the findings of MacIntosh [40] through illustrating the contribution ACCUs make to ex ante, pre-tax equity returns, rather than assuming that additionality is linked to daily operational decisions once the infrastructure is already in place.
The results, however, reflect outcomes of the sensitivities tested. While renewable energy certificate income is a valid revenue support mechanism, with LGC sales of the same magnitude as ACCU revenue, it was not flexed. The contribution to equity returns of the concessional interest rate of 0.82%, being the difference between 5.75% and 4.93%, was less significant. In most cases, the contribution of the cost of capital support mechanism, as shown in the results, was less than 1% of pre-tax equity returns. While not tested under sensitivities, the negative externality levy saving of the avoided landfill charges is also material.
The 2-10% range in the contribution of ACCUs often makes up a material component of the capitalised returns. What the paper does not do is comment on the hurdle rate; and whether the carbon contribution is enough to move the project’s return from below to above the hurdle rate, nor does it consider the probability assigned to the cash flows and the influence it may have over the investment decision. While Michaelowa et al. [48] advocated for the use of pre-determined values for use in financial additionality assessment - in the context of Article 6 projects under the Paris Agreement but applicable also in this case - this would suggest a return to some elements of the original practice of recording minutes of investment decisions in addition to other safeguards as part of the validation process. While neither the Emissions Reduction Assurance Committee [22] nor Chubb et al. [15] called for this level of assessment to be introduced, it may be a necessary step in future to address stakeholder interest in additionality.
The analysis undertaken finds evidence that, on occasions, multiple incentives as well as multiple revenues may be needed which builds upon the additionality orthodoxy [13,68]. For example, the financing terms and conditions used for projects one and two are reasonably ambitious and may be difficult to obtain from the commercial market - such as a 20-year loan tenor and an interest margin more closely related to corporate rather than project lending. This would suggest that some capital cost support would assist, such as that available through the CEFC. The existence of multiple revenue streams also provides opportunities for project’s to manage their exposure to the inevitable volatility cash flows.
Since the development of voluntary demand for ACCUs and reforms to the Safeguard Mechanism that encourage growth, there have been some signs of impact. In April 2023, Liberty Steel [37] announced development of an Electric Arc Furnace (EAF) for steelmaking in Whyalla, South Australia, which would utilise scrap steel sourced from the local waste market. The announcement made direct reference to the Safeguard Mechanism - which allows private companies to use ACCUs as an offset to emissions liabilities - as a driver, though it also noted that AUD \$50 m in grant funding to support the project investment was also being sought. While the Safeguard Mechanism as revenue support is a driver, cost of capital support in grant form is still needed.
This is similar to New Zealand Steel [50] in May, which also announced exploration of an investment into a scrap steel-utilising EAF where a government co-investment is also needed - notwithstanding the carbon price signal created through the New Zealand emissions trading system. This suggests that, for the more ambitious circular economic initiatives higher up the waste hierarchy, revenue support mechanisms are not sufficient to drive investment and need to be complimented by cost of capital mechanisms. It also indicates the ambition embedded within the carbon markets is not yet enough to become the sole driver of circular investment.
This is a significant finding for countries under the Paris Agreement, as it implies the need for complimentary measures at national level to support revenues obtainable from participation in the Article 6.4 mechanism. In addition to conditional and unconditional greenhouse reduction commitments, NDCs also set out the mixture of domestic complimentary policies that countries intend to implement to achieve those goals. This is an important insight for countries such as those previously shown in Table 1 of this study that intend to use international and domestic market mechanisms - and potentially combinations of both - to achieve their targets.
7 Conclusion
Creating sustainable and effective incentives to help businesses transition towards more circular, lower waste and less greenhouse gas intensive practices is a significant challenge for policy makers and managers. This research has identified that a large proportion of carbon credits issued in Australia have been generated by landfill to electricity projects, which effectively rely on the continuation of landfilling. More ambition is needed to realise the potential of circular solutions that reduce, recover and utilise waste before disposal.
While carbon markets have allowed many years of experience with these incentives to build, there has been a general understanding that projects accessing multiple revenue sources was an indicator of non-additionality. In the orthodoxy of international climate change cooperation, simultaneous access of climate finance (as a cost of capital support mechanism) and carbon markets (as a revenue support mechanism) by projects has been discouraged and even precluded over the last 20 years. Pressure has also grown on governments to create domestic revenue support mechanisms and reduce reliance on international carbon markets. This study provides quantitative illustration of the relative impact of revenue support programs - in cases where projects are able to access multiple streams and potentially also cost of capital support - on pre-tax equity returns. As more countries seek to leverage market-mechanisms for the transformation of waste management practices and the achievement of national climate targets and NDCs, this provides an important inflexion point. It illustrates how a project can be financially additional even if it accesses multiple support mechanisms or incentives, though it may necessitate a return to the practice of validating the investment decision-making process - as was once common in the CDM - on a case-by-case basis to underscore environmental integrity.
These findings are particularly significant for policy makers and business managers; as they show that simultaneous access to one or more support mechanism does not necessarily invalidate its additionality and, in some cases, can be desirable and essential. The potential policy and practice applications are wide in scope. These include the ongoing international efforts to define modalities for the new Article 6.4 mechanism under the Paris Agreement, reforms are considered for developing countries’ access to climate finance (including, but not limited to, the Bridgetown Initiative 2.0 (The Bridgetown Initiative 2.0: https://www.un.org/sustainabledevelopment/blog/2023/04/press-release-with-clock-ticking-for-the-sdgs-un-chief-and-barbados-prime-minister-call-for-urgent-action-to-transform-broken-global-financial-system/)); and individual countries seek to optimise domestic carbon market mechanisms so they are fit-for-purpose to support NDCs.
Abbreviations
ACCU $\ \ \ \ \ \ \ \ $Australian Carbon Credit Unit
AUD $\ \ \ \ \ \ \ \ $Australian Dollar
CDM $\ \ \ \ \ \ \ \ $Clean Development Mechanism
CEFC $\ \ \ \ \ \ \ \ $Clean Energy Finance Corporation
ERF $\ \ \ \ \ \ \ \ $Emission Reduction Fund
LGC $\ \ \ \ \ \ \ \ $Australian Large-scale Renewable Energy Certificate
NDC $\ \ \ \ \ \ \ \ $Nationally Determined Contribution
NEM $\ \ \ \ \ \ \ \ $National Electricity Market
NSW $\ \ \ \ \ \ \ \ $New South Wales
ODA $\ \ \ \ \ \ \ \ $Official Development Assistance
P-1 $\ \ \ \ \ \ \ \ $Project One
P-2 $\ \ \ \ \ \ \ \ $Project Two
QLD $\ \ \ \ \ \ \ \ $Queensland
SA $\ \ \ \ \ \ \ \ $South Australia
S-1 $\ \ \ \ \ \ \ \ $Scenario One
S-2 $\ \ \ \ \ \ \ \ $Scenario Two
S-3 $\ \ \ \ \ \ \ \ $Scenario Three
TAS $\ \ \ \ \ \ \ \ $Tasmania
TCFD $\ \ \ \ \ \ \ \ $Taskforce for Climate-related Financial Disclosure
tCO2e $\ \ \ \ \ \ \ \ $Tonnes of Carbon Dioxide-equivalent Greenhouse Gas
UNFCCC $\ \ \ \ \ \ \ \ $United Nations Framework Convention on Climate Change
VIC $\ \ \ \ \ \ \ \ $Victoria
WA $\ \ \ \ \ \ \ \ $Western Australia
WACC $\ \ \ \ \ \ \ \ $Weighted Average Cost of Capital
Acknowledgements
Not applicable.
10 Author’s contributions
Conception and design of study: DR. Acquisition of data: DR. Analysis and/or interpretation of data: DR. Drafting the manuscript: DR. Revising the manuscript critically for important intellectual content: DR. Approval of the version of the manuscript to be published: DR.
Funding
Open access funding provided by Shanghai Jiao Tong University.
Availability of data and materials
The corresponding author will act on reasonable requests to release some of the restricted data.
Declarations
Ethics approval and consent to participate
Not applicable.
Consent for publication
Daniel Rossetto.
Competing interests
The authors declare that they have no competing interests.
Publisher’s Note
Springer Nature remains neutral with regard to jurisdictional claims in published maps and institutional affiliations.
MW $\ \ \ \ \ \ \ \ $MegaWatt
