
1 Introduction
As the human population has grown, the global energy demand has also risen. The International Renewable Energy Agency (IRENA) predicted that the world’s total energy demand could reach 710 EJ by 2050 [1]. The reliance on fossil fuels to fulfil the global energy demand has led to climate change due to the increase in greenhouse gas (GHG) emissions. To avoid catastrophic climate change, countries around the world have pledged through the Paris Agreement to maintain the global average temperature rise below 2ºC above the pre-industrial level, while pursuing efforts to limit the temperature increase to 1.5ºC [2]. To meet those objectives, it is necessary to prevent GHGs from being released into the atmosphere and remove previously emitted GHGs. These goals could be achieved through the net-zero emissions (NZE) scenario, which aims to balance the release of GHG emissions and their removal from the atmosphere.
Several technologies have been proposed to support the NZE scenario, i.e. bioenergy with carbon capture and storage (BECCS), direct atmospheric carbon capture and storage (DACCS), afforestation and reforestation, and enhanced weathering [3]. The advantages of BECCS include its potential to produce multiple beneficial products, such as electricity, heat, fuels and/or chemicals. The Intergovernmental Panel on Climate Change (IPCC) reported that BECCS plays a pivotal role in supporting the Paris Agreement targets [2]. It has been reported that BECCS could potentially reduce GHG emissions by 2 − 10 Gt of carbon dioxide (CO2) per year from the atmosphere [4].
Bioenergy is a renewable energy source and is considered carbon neutral, with the carbon emitted from the bioenergy conversion being absorbed during the photosynthesis process in the biomass life cycle. In BECCS, the CO2 removed from the atmosphere can result in negative emissions. This is essential if the NZE target is to be achieved because CO2 emissions from other sources and activities are inevitable. However, the development of a global BECCS technology has been slow. There are currently only five facilities operating worldwide: Illinois Industrial, Arkalon Facility, Bonanza BECCS, Husky Energy CO2 Injection and Farnsworth, which together have a maximum carbon removal capacity of 1.5 MtCO2 per year [5]. The cost of technology, competition among different land-uses, the availability of biomass resources, CO2 storage issues, socio-economic barriers, the lack of policies and regulatory frameworks, and the sustainability of BECCS are the main concerns that have hindered the technology application [6,7,8].
Previous studies of BECCS have investigated its integration into power and biofuel or chemicals generation. A case study in Sweden by Beiron et al. [9] evaluated the potential of BECCS in biomass and waste-fire combined heat and power (CHP) plants. The authors found that the cost for carbon capture and transport by truck reached 45-125 €/ton CO2 with a total carbon capture of 19.3 MtCO2/year. García-Freites et al. [8] investigated the GHG removal potential of BECCS in three supply chain systems using different power generation technologies with different types of biomass. The results showed that all BECCS supply chains produced net-negative emissions, ranging from -1137 to -647 kg CO2-eq/MWh. Emenike et al. [10] assessed the techno-economic and environmental aspects of employing BECCS in three types of biofuel production: Fischer-Tropsch synthesis (FTS), bio-synthetic natural gas (bio SNG) and oxymethylene ether (OMEx) synthesis from woody biomass. In terms of production costs, these biofuels cannot commercially compete with conventional fossil fuels without receiving financial incentives. Bello et al. [11] performed process modelling and a cradle-to-wheel life cycle assessment (LCA) of the bioethanol production from lignocellulosic waste integrated with CCS. They discovered that blending gasoline with large volumes of bioethanol could result in negative emissions.
It is possible to integrate BECCS into a polygeneration system (BECCS-PS), which allows for the generation of multiple outputs from the overall process, such as electricity and chemicals. For example, methanol can be effectively synthesized in conjunction with electricity generation. The synthesis occurs through the direct hydrogenation of CO2 obtained from the power plant [12]. Methanol offers economic advantages because it can be used as a fuel and feedstock of many derivative products, such as dimethyl ether, formaldehyde, acetic acid and olefins [13]. Depending on the raw material sources, methanol can be classified into green, blue, grey or brown methanol [14]. Blue and green methanol are considered low-carbon as their production involves carbon capture and the use of renewable energy, such as solar photovoltaic (PV), wind, hydro, biomass and/or geothermal. However, it is worth noting that approximately 90% of global commercial methanol is presently produced from natural gas [15].
To expedite the implementation of low-carbon methanol process technology, many studies have been largely conducted for developing hydrogen production using sustainable resources and advancing carbon capture technologies. For example, Wang et al. [16] validated experimental data from the literature and compared the techno-economic aspects of biomass-to-hydrogen and coal-to-hydrogen processes. Li et al. [17] performed techno-economic analysis and evaluated the energy consumption and environmental performance of biomass-to-hydrogen process with and without methane tri-reforming from corn straw. Ma et al. [18] investigated the feasibility of biomass-to-hydrogen processes with and without carbon capture and storage, by considering different CO2 capture rates in the thermodynamic and life cycle assessment. Ma et al. [19] proposed an integrated carbon capture hydrogen production process from tires by applying plasma gasification technology.
The carbon capture technological advancements have been evaluated by many recent studies. For instance, Jones [20] presented recent updates on carbon capture and conversion, which highlighted that research into CO2 capture is a highly active area. Chao et al. [21] assessed opportunities and challenges in the application of various post-combustion CO2 capture techniques. Liu et al. [22] proposed a design of two-stage joint trading mechanism for electricity and carbon market and introduced a carbon capture system in virtual power plants. Fu et al. [23] assessed the thermodynamic performance of coal-fired power plants integrated with carbon capture systems under load-cycling operation conditions. Huang et al. [24] evaluated the development of carbon capture technology for vanadium tailings, in which they studied a potential method for the indirect carbonation of low calcium vanadium tailings under the atmospheric pressure. Zhang et al. [25] performed a techno-economic assessment of natural gas combined cycle power plants with carbon capture and utilization, and they suggested that the process is a viable option for reducing CO2 emission. The findings obtained from other studies are discussed elsewhere and they are available in the open literature [26,27,28,29].
Furthermore, considerable research efforts have been extensively devoted to low-carbon methanol production that involves the utilization of carbon capture and renewable energy. Battaglia et al. [30] developed a process model to simulate methanol synthesis using amine-based carbon capture from coal-fired power plants and hydrogen (H2) from water electrolysis powered by various renewable energy sources. They estimated the production cost of methanol to range from 2624 €/t for concentrated solar power to a minimum of 565 €/t for hydropower. Ning Asih et al. [31] performed a techno-economic and environmental assessment of integrated chemical looping in a coal-based power plant, with methanol synthesis conducted by varying the H2 generation processes, i.e. PV-electrolysis, steam methane reforming (SMR) and biomass gasification. Compared to other technologies, they found that methanol synthesis via PV-electrolysis had the highest efficiency and lowest emissions, while SMR had the lowest methanol production cost. Cordero-Lanzac et al. [32] analysed methanol production processes through a techno-economic evaluation and life-cycle assessment. The results indicated that CO2 taxation and a lower H2 price were required to achieve a profit and the potential CO2 abatement reached 1.75 tons/ton of methanol if the process was powered by a renewable energy source. Nizami et al. [33] conducted a techno-economic and environmental study of CO2 hydrogenation using renewable H2 and CO2 from natural gas processing. They discovered that the cost of methanol production with a PV-grid scenario was higher than that with a PV-battery scenario. However, they indicated that the methanol production cost with a PV-battery could potentially compete with that using a PV-grid by 2029 because of the fixed grid electricity price.
Based on the findings presented in the literature, and to the best of our knowledge, there has been no evaluation of the techno-economic and environmental aspects of BECCS-PS. This study conducted a techno-economic and LCA of the integration of BECCS-PS for the co-production of electricity and green methanol. Indonesia was selected as a case study because the country possesses a significant and diverse renewable energy resource potential, including biomass, geothermal and solar [34]. Indonesia currently relies on fossil fuels for electricity generation and the country fulfils part of its demand for methanol from overseas suppliers [35,36]. Therefore, an integrated BECCS-PS in a bioenergy power plant with green methanol production potentially provides an environmentally sustainable way to meet the national energy needs. Scenarios including variations of production capacity and different technologies for H2 production were considered in this study. A comparison of the proposed scenarios was conducted and potential applications were proposed following consideration of their techno-economic and environmental aspects.
2 Methodology
2.1 Process description and simulation
A schematic diagram of the integrated BECCS-PS proposed in this study is shown in Fig 1. As the design basis, the production of green methanol was set to 400 tons per day, which was considered feasible in a small scale plant and accounted for 20% of total imports in 2020 [36]. The BECCS-PS plant was assumed to be located in Muara Enim Regency, South Sumatra, Indonesia (latitude − 3.485337° and longitude 104.322605°). A biomass integrated gasification combined cycle (BIGCC) unit was selected for use in the power plant. This technology has proven to be highly efficient and economically feasible for the generation of green electricity [37]. Oil palm empty fruit bunches (OPEFB) were used as the feedstock for the BIGCC because of their availability in the region [38,39]. The electricity generated by the BIGCC met the requirements of the whole plant, with the excess exported to the grid. Carbon dioxide (off-gas) in the syngas was captured by amine-based absorption. Hydrogen for the methanol synthesis was obtained via proton exchange membrane (PEM) electrolysis that was powered by one of two renewable energy resources, i.e. a solar PV-battery system (PV-PEM) or a geothermal power plant (GEO-PEM).
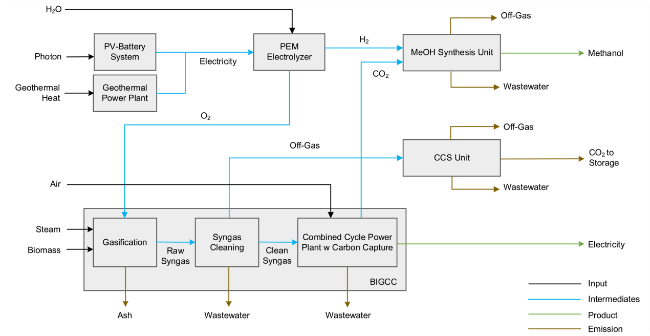
Fig. 1 Schematic diagram of the BECCS-PS for the co-production of green electricity and methanol |
The BECCS-PS plant was modelled using process simulators. The modelling of the PS was performed in Aspen Plus v.11, while the CCS unit was simulated in Aspen HYSYS v.11. The calculations of the PV-battery and geothermal power plant outputs were carried out in Microsoft Excel. Process simulators, such as Aspen Plus and Aspen HYSYS, are widely used by engineers and researchers for getting aided in major calculation activities in the process development. It is worth mentioning that process simulators can have overlapped functionalities, therefore, commonly users independently choose the software that is considered to be mostly suitable and user friendly. In principle, both Aspen Plus and Aspen HYSYS can be used for the aforementioned purpose, but they have distinctive features. While Aspen Plus is proven to be robust in handling solid modelling [40], Aspen HYSYS is well known for its specialisation in supporting petroleum and natural gas process modelling [41]. As the polygeneration system in this study involves solid biomass processing, the Aspen Plus software was specifically chosen for its modelling. While, Aspen HYSYS was used for simulating the carbon capture storage unit as it is equipped with amine and glycol packages, in which they are conventionally encountered in the upstream natural gas industries.
2.1.1 The BIGCC unit
The BIGCC unit was simulated in Aspen Plus v.11 using the Peng-Robinson property model with the Boston-Mathias alpha function (PR-BM). The process simulation for the BIGCC unit was adapted from Syauqi and Purwanto [42]. The hierarchy of the process flowsheet is presented in Fig. 2, with the complete flowsheet provided in the Supplementary Information. Oil palm empty fruit bunches were defined as a non-conventional component by inputting the proximate and ultimate analysis results presented in Table 1. Dry and crushed OPEFB was fed into a bubbling fluidized bed gasifier for conversion into syngas. The four gasification zones of the gasifier unit were modelled with different simulation blocks within Aspen, i.e. RSTOIC for the drying zone, RYIELD for the pyrolysis zone, RSTOIC for the oxidation zone and RCSTR for the reduction zone. The gasification reaction kinetic data used in the analysis is presented in the electronic Supplementary Information. The gasifier operating parameters were set at a steam-to-biomass ratio of 1.14, a temperature of 800ºC and atmospheric pressure, by referring to the optimum conditions of the OPEFB gasification based on experimental work performed by Halim et al. [43]. Oxygen from the electrolyser unit was fed into the gasification zone by considering an equivalence ratio of 0.25. The formation of tar, which consisted of C6H6, C6H6O, C7H8 and C10H8, was considered in the model.
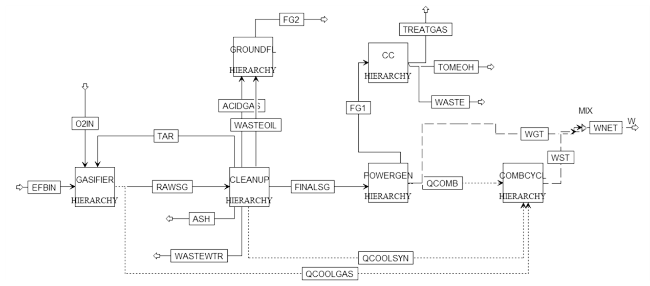
Fig. 2 Process flowsheet of the BIGCC |
Table 1 Proximate and ultimate analysis results of OPEFB [44] |
| Component | Value |
|---|---|
| Proximate Analysis (%wt) | |
| Moisture content | 5.18 |
| Volatile matter | 82.58 |
| Fixed carbon | 8.79 |
| Ash | 3.45 |
| Ultimate Analysis (%wt) | |
| C | 46.62 |
| H | 6.45 |
| N | 1.21 |
| S | 0.035 |
| O | 45.66 |
| Caloric Value (MJ/kg) | 17.02 |
Impurities contained in the raw syngas were removed in the clean-up unit before the syngas was introduced into the combustion chamber. The ash content was removed using a cyclone separator. The tar content was removed by absorption using oil, while the sulphur content was eliminated by the amine absorption process. The clean syngas was then fed with air into the combustion chamber to produce hot gas that could rotate the gas turbine and generate electrical power. The remaining heat from the gas turbine output was then transferred to the steam cycle reboiler to generate additional power from the steam turbine. Before entering the methanol synthesis unit, CO2 exiting the gas turbine was captured in a methyl diethanolamine-piperazine (MDEA-PZ) absorption column. The off-gas from the cleaning process was burned before being captured in the CCS unit.
The electricity production capacities were varied to evaluate the effect of the generated electrical power on the dependent variable. The variations consisted of two cases: (i) Case A, where all the gas turbine flue gas was fed into the methanol synthesiser; and (ii) Case B, where only 60% of the flue gas was directed into the methanol synthesiser. This approach allowed the assessment of the carbon footprint’s impact on the resulting cost shift. The methanol production capacity remained constant and served as the design basis. Because the proposed variations would impact the amount of biomass consumed by the BIGCC unit, the availability of biomass in the study region was carefully considered [38,39].
2.1.2 Hydrogen production
Hydrogen is considered renewable if its production uses low-carbon technology and renewable resources [45]. A PEM was selected to perform water electrolysis to produce renewable H2. The PEM was made of semipermeable polysulfonate to enable proton exchange and inhibit electron exchange between the electrodes [46]. Pt function as catalysts at the cathode for the hydrogen evolution reaction which facilitates the production of H2 and IrO2/RuO2 serve as catalysts at the anode for the oxygen evolution reaction which enables the generation of O2 [47]. These materials are shown to have remarkably electrocatalytic activity, stability and durability [48,49,50]. PEM electrolyser had a compact design, fast response, high efficiency and high current density [47,51]. It was also capable of producing high-purity H2 (99.99%) at relatively moderate operating temperature, typically ranging from 70 to 90 °C [52]. Operating the electrolyser within the optimal temperature range promotes proton exchange across the membrane and improves the electrical conductivity of the electrolyte, which enables more efficient conversion and electron flow. In addition, the use of renewable energy as the power source was suitable for the PEM electrolyser because of its insensitivity to the fluctuations and intermittency of the power supply [53].
In Aspen Plus v.11, PEM electrolysis was modelled by various simulation blocks to simulate the real-world electrolyser. Figure 3 shows the process flowsheet for the PEM electrolyser modelling. The modelling was divided into three zones, i.e. stack, cathode and anode. The separation of water molecules into H2 and oxygen (O2) occurred in the stack, where it was simulated in an RSTOICH reactor. The compressor (PM1) and the heater (HX) units shown in Fig. 3 serve the pre-conditioning requirement to achieve PEM operating conditions. While the other units in Fig. 3 represent a single PEM electrolyser unit consisting of cathode and anode sections. The production capacity of H2 was calculated based on the methanol synthesis requirements. The reactor was supplied with power until the temperature reached a maximum value of 90ºC [54]. Operating the electrolyser at higher temperatures can result in degradation of the polymer membrane, leading to decreased proton conductivity and compromised membrane integrity [54].
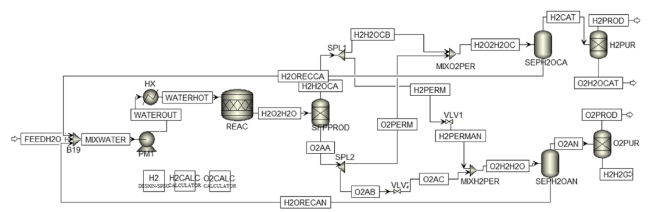
Fig. 3 Process flowsheet of the PEM electrolyser |
Oxidation occurred at the anode and yielded O2, while reduction occurred at the cathode and yielded H2, as shown in Eqs. (1, 2 and 3). The pressure at the cathode was set to 15 bar, while the pressure at the anode was 1.5 bar. The separation of H2 and O2 between the cathode and anode sections was performed through membrane permeation, which was modelled with several separator units and calculator blocks, with reference to the literature [55]. Hydrogen was then compressed to a storage pressure of 30 bar before being fed into the methanol synthesis unit.
$\text{Anode (oxidation)}\qquad : 2\text{H}_{2}\text{O}_{\text{(l)}} \longrightarrow \text{O}_{2\text{(g)}} + 4{\text{H}^{+}}_{\text{(aq)}} + 4\text{e}^{\text{-}}$
$\mathrm{Cathode}\;(\mathrm{reduction})\;:\;4{\mathrm H^+}_{(\mathrm{aq})}\;+\;4\mathrm e^-\;\rightarrow\;2{\mathrm H}_{2(\mathrm g)}$
$\text{Overall reaction}\quad : \text{H}_{2}\text{O}_{\text{(l)}} \longrightarrow \text{H}_{2(\text{g})} + \frac{1}{2} \text{O}_{2\text{(g)}}$
The amount of power required for the electrolyser was calculated using Eqs. (4, 5 and 6) [56]. The electric current ($I$) considers the current density ($j$) and the effective surface area of the polar plate (${A}_{p}$). The cell voltage (${V}_{cell}$) is the total of the reversible voltage (${V}_{0}$), the activation overpotential losses (${V}_{act}$), the ohmic potential losses (${V}_{ohm}$) and the concentration overpotential losses (${V}_{con}$).
$E=I\times {V}_{cell}$
$I=j\times {A}_{p}$
${V}_{cell}={V}_{0}+{V}_{act}+{V}_{ohm}+{V}_{con}$
The determination and calculation of Vo, Vact, Vohm, Vcon and j followed the formula and graph given in detail by Zhang et al. [56], where those values are 1.22 V, 0.82 V, 1205.34 V, 8353.84 V and 16,000 A/m2, respectively. Ap was obtained from an iterative procedure so that the required energy per kg of H2, the H2O/H2 ratio and the process efficiency are similar to those suggested by Zaccara et al. [55].
2.1.2.1 Solar photovoltaics
A solar PV array was assumed to be installed near the BECCS-PS plant to meet the electricity demand for water electrolysis. The installation consisted of a set of solar panels, an inverter and a battery. Monocrystalline silicon (Mono-cSi) was selected in this study because it has a high efficiency and is the most mature type of commercial solar PV [57]. A Li-ion battery was used to store the excess energy from the PV array because of its high energy density and efficiency compared to other battery types [58]. The size of the PV array complied with the amount of power required to perform PEM electrolysis, as determined using Eqs. (7, 8 and 9),
${E}_{PV}=CF\times {P}_{max}$
${E}_{battery}={E}_{PEM}-{E}_{PV}$
$A=\frac{{E}_{PV} }{GHI \times {\eta }_{PV}}$
where EPV and Ebattery are the capacities of photovoltaics and batteries (MW) and EPEM is the amount of power required (MW) to perform electrolysis for the desired amount of hydrogen. CF, ƞ, Pmax and GHI are the PV capacity factor (%), the photovoltaic efficiency (%), the nominal maximum power (kWp) and the global horizontal irradiation (kWh/m2/day), respectively. While A is the total area required for the photovoltaic installation (m2). The value of Pmax was calculated iteratively using the Solver tool in Microsoft Excel to comply with Eqs. (7 and 8).
Technically, 20-30% additional area of PV array was required for installation and maintenance purposes considering the distance between the solar modules [38]. The capacity factor of the PV array in the area of the BECCS-PS plant was retrieved from the renewables.ninja simulator [39]. The PV and battery system specifications used in this study are summarised in Table 2. Some parameters given in Table 2, which are used in Eqs. (7, 8 and 9), are the PV efficiency, PV capacity factor and global horizontal irradiation.
Table 2 PV-battery system specifications |
| Parameter | Value | Reference |
|---|---|---|
| PV efficiency (%) | 19.38 | [59] |
| PV dimension (mm) | 2008 × 1002 × 40 | [59] |
| PV capacity factor (%) | 12.7 | [60] |
| Global horizontal irradiation (kWh/m2/day) | 4.96 | [61] |
| Battery voltage | 380-505 | [62] |
| Round-trip efficiency (%) | 90 | [62] |
| Depth of discharge (%) | 100 | [62] |
| Battery dimension (mm) | 7168 × 1659 × 2522 | [62] |
2.1.2.2 Geothermal power plant
Similar to the PV power plant, it was assumed that a geothermal power plant would be built near the BECCS-PS plant to provide electricity for the PEM electrolyser. The operating parameters for the geothermal power plant are presented in Table 3. Geothermal heat was constantly supplied from the South Sumatera basin geothermal field. The South Sumatra Basin has the potential for geothermal wells with temperatures above 210ºC (in the medium enthalpy category); hence, double-flash technology was used to generate electricity with an efficiency of 11% [63,64]. Double-flash technology requires two separators for generating steam. One produces steam by operating at a high pressure and the other works at a low pressure, with both driving a steam turbine. Double-flash power plant is deemed advantageous over a single-flash power plant due to its capability of generating approximately 25% higher output power when subjected to equivalent geothermal fluid conditions [65].
2.1.3 Methanol synthesis
Because the methanol synthesis occurred at high pressure (> 10 bar), the Redlich-Kwong-Soave modified Huron-Vidal mixing rules (RKSMHV2) property package was used to calculate the thermodynamic characteristics [67]. The study simulated an isothermal fixed bed reactor (RPlug) packed with a Cu/Zn/Al/Zr catalyst. The design and configuration of the reactor were adapted from Nyári et al. [68]. A set of reactions and kinetic equations, which are summarized in Table 2 in the electronic Supplementary Information, were input to the simulation. During methanol dehydration, dimethyl ether is usually generated as a side product [69]. This side reaction was considered in the simulation. The kinetic data and driving force parameters are presented in Table 2 in the Supplementary Information.
A process flowsheet of the methanol synthesis is shown in Fig. 4. Captured CO2 and pure H2 were compressed to 50 bar using multiple-stage compressors with intercooling systems. These two gases and the recycled gas were mixed and heated to 230ºC before entering the RPlug packed with the Cu/Zn/Al/Zr catalyst. The gases exiting from the reactor were cooled to 30ºC and underwent separation. The unreacted gas was recycled to the reactor and the rest was purged. Crude methanol entered the second separator for the further removal of unreacted gases. Then, crude methanol was heated to 87ºC and entered the first distillation column, where methanol and water were separated. The methanol exiting from the top column of the first distillation was then fed into the second column to retrieve methanol with a purity of 99.9%. The top product containing methanol exited at 60ºC, while the bottom product from the second column was then fed back to the first column. The details of the two-step distillation design are shown in Table 4. For storage, methanol was cooled to 30ºC.
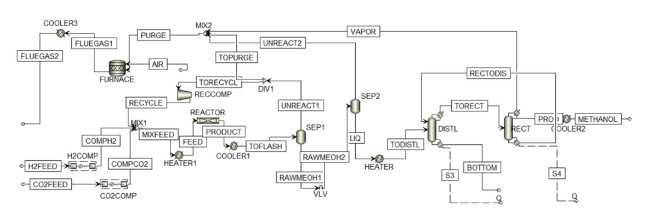
Fig. 4 Process flowsheet of methanol synthesis |
Table 4 Design parameters of the two-step methanol distillation process |
| Parameter | Distillation I | Distillation II |
|---|---|---|
| Number of stages | 30 | 30 |
| Feed stage | 15 | 15 |
| Recycle stage | 1 | - |
| Condenser type | Partial-vapor | Partial-vapor-liquid |
| Reboiler type | Kettle | Kettle |
| Reflux ratio (mole) | 1.1 | 6.8 |
| Boil-up ratio (mole) | 2 | 5 |
| Pressure (bar) | 1 | 1 |
| Distillate vapor fraction (mass) | - | 0.01 |
2.1.4 Carbon capture and storage
The simulation of the CCS unit was carried out using Aspen HYSYS, which is equipped with amine and glycol packages. A complete flowsheet of the CCS unit is presented in Fig. 5. The proposed CCS unit comprised three stages, i.e. (i) absorption, (ii) dehydration, and (iii) compression and transport of CO2. The objective of absorption and dehydration is to achieve the targeted CO2 specifications as reported by Brownsort [70], prior to its transportation via a pipeline network for storage.
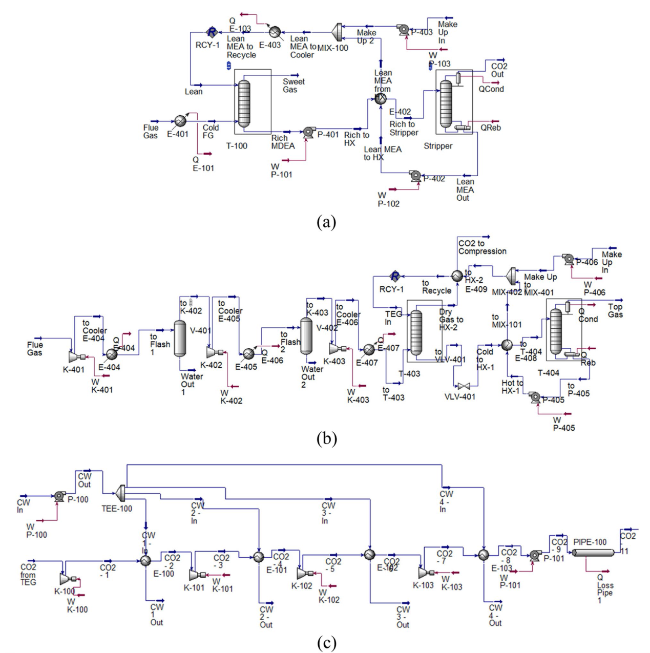
Fig. 5 Flowsheet of the CCS unit: a absorption, b dehydration, and c compression and transport |
Flue gas containing CO2 entered an absorption column fitted with Mellapak 250Y structured packing material that was operated under atmospheric pressure. The liquid-to-gas mass ratio was set to 2:1. While, the MDEA and PZ mass fractions in the water/MDEA/PZ mixture assumed in this work were 0.1827 and 0.2123%, respectively, which follow the values suggested by Hosseini-Ardali et al. [71]. The process equipment in this system consisted of a cooler, CO2 absorber, heat exchanger network and CO2 stripper. The input operating parameters for the columns are shown in Table 5. These parameters are within the practical ranges that were discussed in the literature [71,72,73,74]. The CO2 was absorbed by the MDEA-PZ solvent and released at the bottom of the column. The CO2-rich solvent then entered the stripper column, where separation occurred between CO2 and the lean solvent. The wet CO2 from the stripper entered a dehydration column containing triethylene glycol (TEG) as a solvent.
Table 5 The input operating parameters for CO2 capture |
| Operating parameters | Value |
|---|---|
| Absorber | |
| Column diameter (m) | 2.5 |
| Height of packing (m) | 18 |
| Structured packing | Mellapak 250Y |
| Operating pressure (atm) | 1 |
| Number of stages | 15 |
| Stripper | |
| Column diameter (m) | 4.3 |
| Height of packing (m) | 20 |
| Structured packing | Mellapak 250Y |
| Operating pressure (atm) | 2 |
| Number of stages | 10 |
The TEG dehydration process was similar to the absorption process, with the TEG solution and gas fed into an absorber. Dry gas exited through the top of the column, while TEG was regenerated in the stripper before being recycled into the dehydration column. The dry gas was compressed to the dense phase and transported by pipeline to the injection site, i.e. Sink E1 (shown in Fig. 6). The sink was a depleted oil reservoir in the South Sumatra Basin, which was dominated by sandstone and limestone, and had a capacity of 2.39 Mt [75]. The average pressure in the South Sumatra Basin is 1,200-1,700 psig [76]. The sink was located 12.04 km from the BECCS-PS plant. The shaded area in Fig. 6 indicates the required land for the solar PV array, which is currently an unoccupied and unpopulated area.
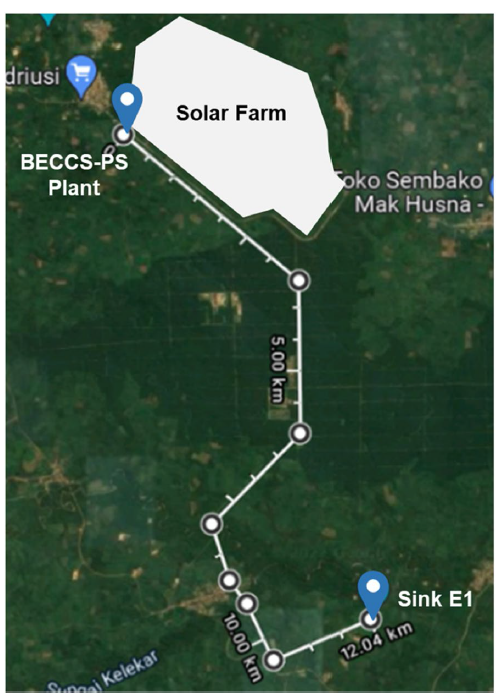
Fig. 6 BECCS-PS plant area |
2.2 System evaluation
2.2.1 Technical assessment
The technical analysis was evaluated by quantifying the overall efficiency of the BECCS-PS plant in regard to the principle of the first law of thermodynamics, in which it simultaneously involved the integration of thermal and electrical energy. This study considered the whole energy conversion that occurred only in the main process, as shown in Fig. 1. The technical evaluation was conducted using Eqs. (10, 11 and 12), which were adopted from the literature [77].
${\eta }_{total}=\frac{{\dot{E}}_{MeOH}+{W}_{BIGCC}}{{\dot{E}}_{biomass}+{W}_{elc}}$
${\dot{E}}_{MeOH}={\dot{m}}_{MeOH}\cdot LH{V}_{MeOH}$
${{\dot{E}}_{biomass}=\dot{m}}_{biomass}\cdot LH{V}_{biomass}$
where the overall system efficiency (ƞtotal) is the summation of the caloric value of methanol (${\dot{E}}_{MeOH}$) and the total electrical energy generated in the BIGCC unit (${W}_{BIGCC}$) and dividing it by the caloric value of the biomass fed to the BIGCC unit (${\dot{E}}_{biomass}$) and the total electrical energy consumed by the electrolyser (${W}_{elc}$). The caloric value of the biomass was retrieved from Table 1, whereas the value for methanol was acquired as 19.9 MJ/kg [14].
2.2.2 Life cycle assessment
The environmental impact was evaluated by a cradle-to-gate LCA based on ISO 14,041, which consisted of four steps: goal and scope definition, inventory analysis, impact assessment and interpretation [78], in which all the direct emissions from the integrated BECCS-PS plant were retrieved from the simulations and the greenhouse gas inventories were directly obtained from the secondary data in literature. The inventory analysis considered the indirect emission of each unit. The boundary of the evaluation was the use of OPEFB was considered to be carbon neutral. The overall GHG emissions from OPEFB production in the oil palm production industry were considered, including the plantation activities and palm oil processing required to produce OPEFB. Considering the wide and scattered distribution of the plantations across the region, the OPEFB was assumed to be obtained from the palm oil mill industry as waste. The waste was assumed to be transported by diesel-fuelled trucks from the oil mill to the BECCS-PS plant, and it was therefore necessary to account for GHGs emitted by the trucks. Furthermore, the production of deionized water for use in water electrolysis was also considered. Emissions from solar PV originated from the manufacturing of mono-cSi modules, which included the raw material extraction, installation, operation and maintenance (O&M), and decommissioning. The global warming potential (GWP) data for the Li-ion battery supply was also considered to account for emissions from the production and shipping of the components. For the geothermal power plant, the emissions considered were from the construction of the facility, O&M, and decommissioning. Every GHG inventory mentioned above is summarised in Table 6.
Table 6 LCA inventory data |
| Activity | Value | Reference |
|---|---|---|
| OPEFB production | 0.168 kg CO2-eq/kg OPEFB | [79] |
| Biomass transportation | 29 g CO2-eq/km/ton | [80] |
| Deionized water production | 1.43 kg CO2-eq/m3 water | [81] |
| Mono-cSi PV manufacturing | 45 g CO2-eq/kWh | [82] |
| Li-ion battery manufacturing | 56.3 g CO2-eq/kWh | [83] |
| Geothermal power plant emission | 3.88 g CO2-eq/kWh | [84] |
| BIGCC electricity production | Simulation result | |
| Hydrogen production | Simulation result | |
| Methanol production | Simulation result | |
| CCS unit | Simulation result | |
The environmental impact was assessed based on the results of the inventory analysis step. The GWP was only evaluated by considering the amount of CO2 emitted. In accordance with the IPCC’s fourth assessment report, the emissions of any compounds with a potential global warming impact were converted to a CO2 − eq value [85]. As BECCS-PS produces electricity and subsequently methanol, the overall GWP was calculated by allocating an emission amount to each product by using Eqs. (13) and (14). After accounting the emission from BECCS, the emission per kWh of electricity generated was used to calculate the emission from methanol synthesis as the process utilised the electricity from the BECCS power plant. The conventional allocation methodologies stipulated in the ISO 14,000 series of standards for Life Cycle Assessment (LCA) rely on the principles of mass, energy, or cost apportionment, with an example provided by Lee and Inaba [86]. However, these methodologies are specifically designed for scenarios wherein multiple products are generated through one unified simultaneous process. In contrast, our particular case involved the generation of electricity initially from the biomass power plant. Subsequently, this electricity was directly employed to operate the methanol synthesis plant, alongside the utilisation of carbon dioxide emitted by the biomass power plant. These were consecutive processes (see Fig. 1) that did not involve any simultaneous nor overlapped process leading to the production of multiple products.
${n}_{C{O}_{2-eq},net\,BECCS}={n}_{C{O}_{2-eq},direct\,BECCS}+{n}_{C{O}_{2-eq},indirect\,BECCS}-{n}_{C{O}_{2-eq}, CCS\,BECCS}$
${\mathrm n}_{{\mathrm{CO}}_{2-\mathrm{eq}},\;\mathrm{net}\;\mathrm{MeOH}}\;=\;{\mathrm n}_{C_{O2-\mathrm{eq}},\;\mathrm{direct}\;\mathrm{MeOH}}\;+\;{\mathrm n}_{C_{O2-\mathrm{eq}},\;\mathrm{indirect}\;\mathrm{MeOH}}$
where ${n}_{C{O}_{2-eq},net BECCS}$ and ${n}_{C{O}_{2-eq},net MeOH}$ are the net CO2 − eq emissions from BECCS (kg CO2 − eq/kWh) and methanol synthesis (kg CO2 − eq/kg MeOH), ${n}_{C{O}_{2-eq},direct BECCS}$ and ${n}_{C{O}_{2-eq},direct MeOH}$ are the direct CO2 − eq emissions obtained from the simulations, ${n}_{C{O}_{2-eq},indirect BECCS}$ and ${n}_{C{O}_{2-eq},indirect MeOH}$ are the indirect CO2 − eq emissions from the other activities calculated using the inventory data mentioned in Table 6 and plant’s electricity consumption, and ${n}_{C{O}_{2-eq}, CCS BECCS}$ is the amount of CO2 − eq captured in the CCS process and as the feed for methanol synthesis.
2.2.3 Economic assessment
The economic evaluation was carried out by applying the levelized cost method for calculating the net present cost of the commodity produced in the system over its lifetime, as defined by Eq. (15). The value of money over time and inflation were not considered by the levelized cost calculation, and therefore it was logical to compare the levelized costs of each technology at a given period. In this study, the levelized cost was determined for electricity (LCOE) and methanol (LCOM) produced by the polygeneration system.
$LCO{P}_{i}=\frac{CAPE{X}_{i}\cdot CRF+OPE{X}_{i}+Var\,O\&{M}_{i}}{{Q}_{i}}$
$CRF=\frac{r{\left(1+r\right)}^{n}}{{\left(1+r\right)}^{n}-1}$
The levelized cost of product (LCOP) includes the investment cost ($CAPE{X}_{i}$), the fixed operation and maintenance cost ($OPE{X}_{i})$, the variable operation and maintenance cost ($Var O\&{M}_{i})$ and the quantity of the commodity produced (${Q}_{i}$), while $i$ indicates the specific system. The capital cost was annualized by the capital recovery factor ($CRF$), which considers the interest rate ($r$) and the lifetime of the project ($n$). This study assumed an interest rate of 10% and the project’s lifetime of 30 years, with 2023 used as the base year.
The total investment costs for the BIGCC unit, methanol synthesis, and CCS units were calculated by the Modular Guthrie estimation based on Seider et al. [87]. The Chemical Engineering Plant Cost Index (CEPCI) of 2023 was used to estimate the cost in 2023 [88]. Other economic data was estimated based on approaches adopted in the literature [31,42,89,90,91,92,93,94]. The land cost required to build the solar PV facility was calculated based on local regulations [95]. The variable costs, which accounted for the utility consumption, were estimated using the Aspen Economic Analyzer and the cost sheet in Seider et al. [87]. The cost of transporting CO2 through the pipeline, which consisted of capital and O&M costs, was calculated by applying the approach of Lee et al. [96]. The cost of injecting CO2 into the sink was obtained from the average injection cost of existing projects [97].
To fully evaluate BECCS, an assessment of the CO2 avoidance cost (CAC) is essential. The CO2 avoidance is described as the amount of CO2 emissions avoided due to the emission reduction in the system. The CAC accounts for the cost of the electricity production and the intensity of CO2 emissions with and without carbon capture schemes. It is defined by the IPCC as follows [98]:
$CAC=\frac{LCO{E}_{CCS}-LCO{E}_{ref}}{{\left({t}_{C{O}_{2}}/MWh\right)}_{ref}-{\left({t}_{C{O}_{2}}/MWh\right)}_{CCS} }$
The application of a novel technology may result in a decline in the investment cost over time as the cumulative installed capacity increases [99]. The significance of this decline is usually affected by the maturity of the technology that impacts the levelized cost. This decline in investment cost also decreased the fixed operational cost of each technology. Hence, the levelized cost of electricity and methanol was projected until 2070. The projection of the investment cost was estimated by applying Eqs. (18 and 19),
$lr=1-{2}^{-a}$
${C}_{t}={C}_{0}{\left(\frac{{P}_{t}}{{P}_{0}}\right)}^{-a}$
where the learning rate, as listed in Table 7, was taken into account. $lr$ represents the learning rate and $a$ represents the learning index. While ${C}_{t}$ is the investment cost in year $t$, ${C}_{0}$ is the investment cost in the base year, ${P}_{t}$ is the cumulative installed capacity in year $t$ and ${P}_{0}$ is the cumulative installed capacity in the base year. $P$ depends on the reviewed system where it is commonly quantified in installed capacity or energy produced. This formulation is employed based on the empirical observations encompassing multiple energy technologies, which frequently demonstrate a log-linear association between the unit cost of technology and its cumulative installed capacity [99,100].
The OPEFB price was estimated by considering the growth of the Indonesian Crude Price (ICP) issued by the Indonesian Ministry of Energy and Mineral Resources [105]. The historical pricing for crude palm oil, the OPEFB sales price and the costs associated with loading and transport were evaluated to estimate the total OPEFB cost for the year of projection [106,107].
3 Results and discussion
3.1 Technical analysis
3.1.1 The BIGCC and CCS unit
The production capacities of the BIGCC unit varied in the simulations. Cases A and B generated 30.87 and 50 MW of electricity, respectively. The consumption of OPEFB and O2 for Case A were 22 and 8 tons/hour, respectively, while Case B consumed 35.6 tons/hour of OPEFB and 12.9 tons/hour of O2. The CO2 from the flue gas was captured in the MDEA-PZ absorption column with a collection efficiency of 99.9%. An increased pressure may be applied in the absorption column to improve the column setup, but its application would increase both capital and operating costs of the CO2 capture process. Table 8 summarizes the technical performance of the BIGCC unit.
Table 8 Technical performance of the BIGCC unit |
| Parameter | Unit | Value |
|---|---|---|
| Ash content in syngas | mg/m3 | 0 |
| H2S content in syngas | ppmv | 18.15 |
| Tar content in syngas | mg/m3 | 0 |
| Carbon conversion efficiency (CCE) | % | 99% |
| Cold gas efficiency (CGE) | % | 60.40% |
| H2/CO ratio of syngas | - | 0.59 |
| LHV of syngas | Btu/scf | 277.13 |
| Gas turbine efficiency | % | 35.63% |
| Combined cycle total efficiency | % | 49.14% |
| Overall efficiency | % | 29.68% |
The simulated CO2 capture for the off-gas from the syngas clean-up unit showed that Cases A and B required 1531.5 and 2480.3 kg/hour of solvent, respectively. The carbon capture efficiency for both scenarios was 99.9%. High CO2 recovery rates, i.e., ≥ 99%, using similar technology were also obtained and discussed in Tuinier et al. [108], Park et al. [109] and Magli et al. [110]. According to the simulation result, the reboiler duty for the amine regeneration is 5.37 MJ/kg CO2, while the temperature within the stripper varies between the range of 120.1 and 121.2 °C. The TEG requirements in Cases A and B were 0.028 and 0.046 kg/hour, respectively. The final CO2 specification for pipeline transportation is presented in Table 9. Before being transported and injected into the sink, the captured CO2 underwent four compression stages to achieve a dense phase.
Table 9 The final CO2 specification for pipeline |
| Component | Unit | Value |
|---|---|---|
| CO2 | %v/v | 99.7 |
| SO2 | ppmv | 1661.10 |
| Nitrogen | %v/v | 0.006 |
| Oxygen | ppmv | 1.22 |
| H2O | ppmv | 37.63 |
3.1.2 Hydrogen production and methanol synthesis
In each scenario, electricity from either the PV system or the geothermal power plant was supplied directly to the PEM electrolyser. The simulation of hydrogen production revealed energy usage of 53.75 kWh/kg H2, water usage of 9.39 kg/kg H2 and an energy efficiency of 62%. These values aligned with the typical technical performance of PEM electrolyser [55]. To ensure the correct stoichiometry in the methanol synthesis unit, the molar ratio of CO2 and H2 entering the reactor was 1:3. Therefore, the H2 requirement for methanol synthesis was 4.2 tons/hour. In addition to H2, the PEM electrolyser yielded 33.6 tons/hour of O2 as a by-product. The overall energy efficiencies of the PV-PEM and GEO-PEM were 11.5% and 6.8%, respectively. Double flash technology was used in the geothermal power plant, which had an efficiency of 11%, whereas mono-cSi PV systems and li-ion batteries have greater efficiencies, i.e. 19.38% and 91.8%, respectively. Furthermore, the total area required to house the entire PV system facility was 8.46 km2. The technical performances of the H2 production and methanol synthesis processes are presented in Table 10. At the end of the methanol synthesis process, the two-stage distillation obtained methanol with a purity of 99.9 wt% because there was no azeotrope present in the multicomponent system.
Table 10 Technical performances of the hydrogen production and methanol synthesis processes |
| Parameter | Unit | Value |
|---|---|---|
| Hydrogen production | ||
| Energy usage | kWh/kg H2 | 53.75 |
| H2O usage | kg/kg H2 | 9.39 |
| Energy efficiency | % | 62 |
| PV capacity | MWp | 1,894 |
| Battery capacity | MWh/day | 3,496 |
| PV land requirement | m2/kWp | 6.33 |
| Geothermal heat requirement | MW | 2,072.46 |
| Methanol production | ||
| Electricity usage | kWh/kg MeOH | 0.218 |
| CO2 usage | kg/kg MeOH | 1.41 |
| H2 usage | kg/kg MeOH | 0.193 |
| Overall CO2 conversion | % | 97.64 |
| Overall H2 conversion | % | 100 |
| Energy efficiency | % | 82.93 |
3.1.3 Overall technical performance
The overall energy efficiency was determined for the whole system within the BECCS-PS plant. Figure 7 shows the energy flow of the overall system, starting with the biomass supply and the generation of renewable power to the polygeneration plant gate. The letters A and B indicate the variations of the BIGCC power production capacity used in the scenario. The overall energy efficiencies in the PV-PEM and GEO-PEM scenarios for both BIGCC capacities were 11% and 7%, respectively. As shown in Fig. 7, the energy losses in the PV-PEM scenario were lower than in the GEO-PEM scenario due to the better efficiency of the technology.
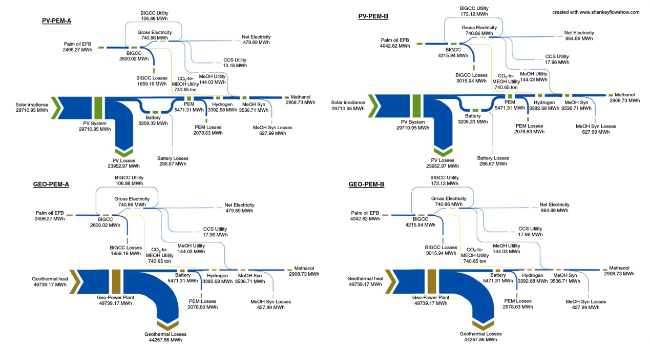
Fig. 7 Sankey diagram of the energy flow for all scenarios |
3.2 Life cycle analysis
The direct emissions from the BIGCC unit were due to the CO2-eq losses during carbon capture and waste disposal. The CO2-eq emissions from the BIGCC unit calculated in this study were compared with those from conventional natural gas combined cycle and coal integrated gasification combined cycle power plants [111]. A comparison of the CO2-eq emissions for schemes with and without a CCS unit is shown in Fig. 8. The carbon neutrality of OPEFB was taken into consideration in this comparison. When the CCS unit was excluded, identical CO2-eq emissions were observed in Cases A and B, which originated from upstream activities. When the CCS unit was included, both proposed scenarios resulted in negative emissions of -1 kg and -0.62 kg CO2-eq/kWh for Cases A and B, respectively. Case B produced a lower negative emission than Case A, because 40% of the flue gas was released directly into the atmosphere.
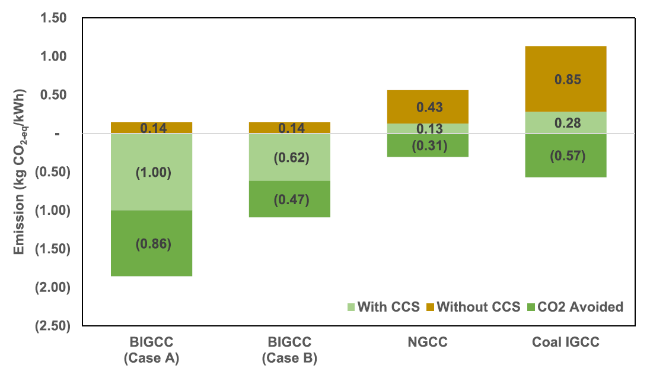
Fig. 8 The CO2-eq emissions from different power plants |
In addition to the emissions from the BIGCC unit, there were emissions released during methanol synthesis due to the H2 production and electricity consumption. Figure 9 compares the methanol emissions per kilogram for all scenarios. The total emissions in Case A for the PV-PEM-A and GEO-PEM-A scenarios were -0.83 and -1.65 kg CO2-eq/kg MeOH, respectively. While the emissions in Case B for PV-PEM-B and GEO-PEM-B were -0.70 and -1.52 kg CO2-eq/kg MeOH, respectively. In both cases A and B, the PV-PEM scenario emitted more CO2-eq than the GEO-PEM scenario because the emission factor in the cradle-to-gate LCA of PV manufacturing was more significant than that in the construction of a geothermal power generation plant. Furthermore, the emissions from solar PV appear to be relatively significant because, as explained in Subsection 2.2.2, its emissions were originated from the manufacturing of mono-cSi modules, which included the raw material extraction, installation, operation and maintenance (O&M), and decommissioning [82]. However, the emissions contribution from other units, i.e. the BIGCC, methanol synthesis and carbon capture units, in the two scenarios had identical values because the operating conditions and process schemes remained the same. Figure 10 presents Sankey diagrams of the carbon flow through the polygeneration system. The negative values in the processes were due to the consideration of the direct emissions from the flue gas or the waste stream of each unit and the consumption of green electricity supplied by the BIGCC unit.
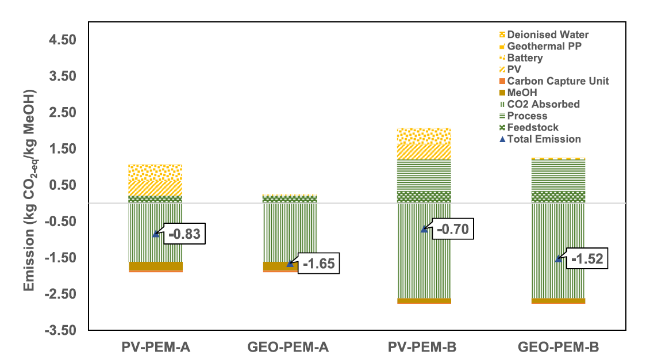
Fig. 9 The CO2-eq emissions for methanol synthesis in all scenarios |
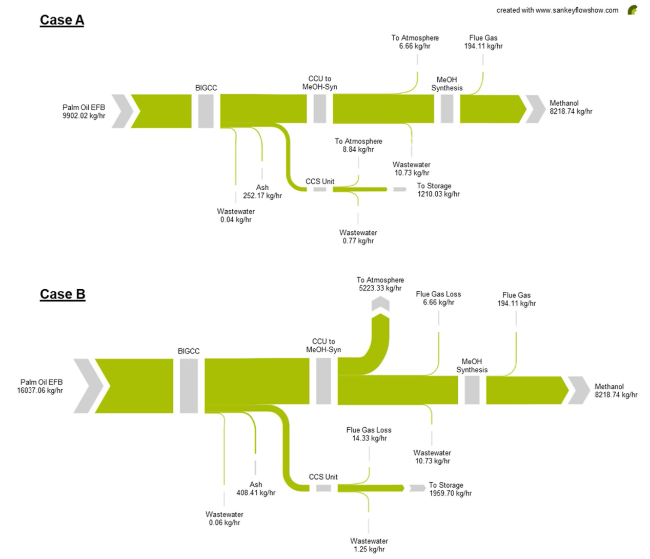
Fig. 10 Sankey diagrams of the carbon flow through the polygeneration system |
3.3 Economic analysis
3.3.1 The LCOE and CAC
The LCOE of the BIGCC unit for Cases A and B when accounting for the CCS unit were 0.193 and 0.143 USD/kWh, respectively. These values incorporated the investment and operational costs for carbon capture, dehydration and compression, transportation and CO2 injection units. As shown in Fig. 11, both types of levelized cost were higher than those in Cases A and B when the CCS unit was not considered.
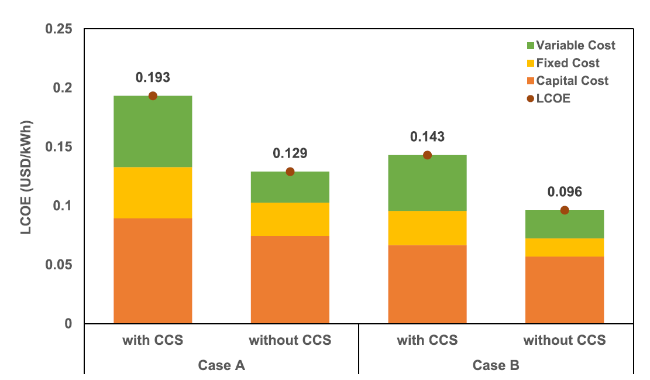
Fig. 11 Levelized cost of electricity for all cases in the BIGCC unit |
The CAC for Cases A and B were 67.66 and 56.06 USD/ton CO2, respectively, as shown in Fig. 12. These values were in accordance with the range of CAC values estimated for BECCS as reported by the IPCC, which is around 40 − 250 USD/ton CO2 [2]. The values presented in Fig. 12 indicate that the variation of the electricity production capacity affected the CAC values in the different cases, with the production costs and total CO2 avoided being lower for a larger production capacity in a power plant.
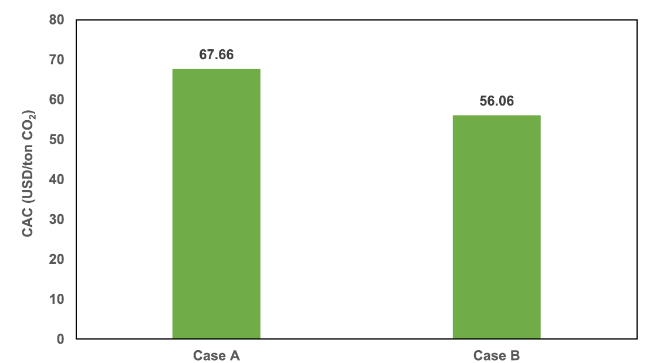
Fig. 12 The CAC for both cases in the BIGCC unit |
3.3.2 LCOM
Figure 13 shows the LCOM for PV-PEM-A, PV-PEM-B, GEO-PEM-A and GEO-PEM-B, which had values of 1,237, 1,191, 961 and 918 USD/ton of methanol, respectively. These values were all greater than the current production cost of conventional methanol, which is 100 − 250 USD/ton of methanol [14]. The production cost in each scenario was dominated by the variable costs, including the price of catalysts, electricity, and the CO2 and H2 feedstock. The catalyst price was constant because it was unaffected by the proposed variations. The CO2 and electricity costs from the BIGCC unit were calculated using the weighted average method, with values of 0.130 USD/kg CO2 and 0.149 USD/kWh for Case A and 0.093 USD/kg CO2 and 0.110 USD/kWh for Case B, respectively. In addition, the levelized cost of H2 (LCOH) also had a significant impact, with values of 5.27 USD/kg for PV-PEM and 3.86 USD/kg for GEO-PEM.
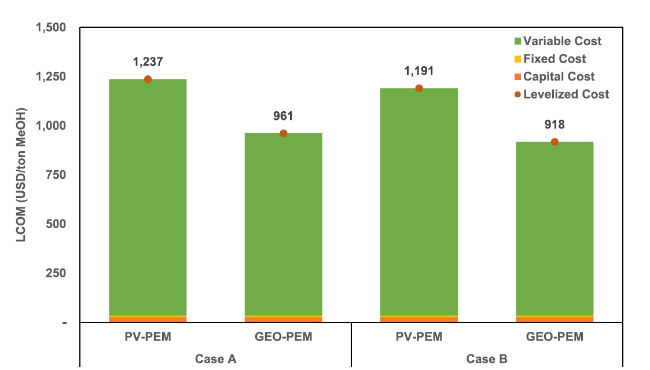
Fig. 13 Levelized cost of methanol in all scenarios |
3.3.3 Projection of levelized cost
The levelized cost of green methanol in 2023 indicated that it was less competitive than conventional methanol. However, due to the improving learning rates, the investment costs for more environmentally friendly systems, including the BIGCC unit, PEM electrolyser, PV and battery systems, and geothermal power plants, may decline in the future.
Figure 14 shows the projected cost of green methanol production for Case B. In 2031, the production cost of green methanol obtained with PV-PEM was expected to be cheaper than that obtained with GEO-PEM. This was because the geothermal power plant had reached operational maturity, and therefore there would not be a large decrease in production costs. The levelized cost of H2 produced from PV-PEM decreased from 3.93 USD/kg in 2030 to 2.55 USD/kg in 2070. The LCOE reduction for H2 production using GEO-PEM from 2030 to 2070 was expected to be less significant than that obtained using PV-PEM, which decreased from 3.92 to 3.70 USD/kg H2. The LCOE of the BIGCC unit would also decline from 13.6 cents/kWh in 2030 to 12.5 cents/kWh in 2070. Additionally, the cost of CO2 feedstock was projected to decrease from 8.85 cents/kg CO2 in 2030 to 8.14 cents/kg CO2 in 2070.
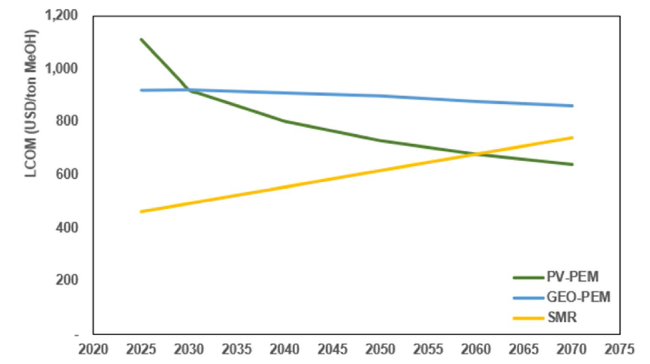
Fig. 14 Projected levelized cost of methanol |
Based on Ning Asih et al. [31], by comparing the levelized cost of conventional methanol with H2 produced from the SMR, the LCOM with PV-PEM would be cheaper from 2060 onwards. This shift in cost-effectiveness was attributed to the anticipated rise in natural gas prices, which serves as the feedstock for SMR. Additionally, the SMR technology also demonstrates a low learning rate due to its maturity. Furthermore, the cost of H2 production with PV-PEM would continue decreasing, with a slightly lower rate for GEO-PEM.
4 Conclusion
This study assessed the integration of BECCS in the polygeneration system (BECCS-PS) of a BIGCC unit and the production of green methanol using renewable H2 produced from electrolysis with either a PV-battery or geothermal power as the power source. The electricity production capacities of the biomass power plant were varied. The techno-economic and environmental aspects consisting of the energy efficiency, the levelized cost of the products and CO2 − eq emissions were evaluated. The overall energy efficiencies of the PV-PEM and GEO-PEM scenarios were 11% and 7%, respectively. The BIGCC unit produced negative CO2 − eq emissions, with values of -1.00 kg CO2 − eq/kWh for Case A and -0.62 kg CO2 − eq/kWh for Case B. The overall emissions were attributed largely to methanol production, in which the PV-PEM scenario produced higher CO2 − eq emissions (-0.83 to -0.70 kg CO2 − eq/kg MeOH) than the GEO-PEM scenario (-1.65 to -1.52 kg CO2 − eq/kg MeOH). In terms of the economic aspects, the LCOE of a BIGCC unit with a higher production capacity was lower than that for a BIGCC unit with a smaller capacity. The LCOM for the PV-PEM scenario in 2023 (1,191-1,237 USD/kg) was higher than in the GEO-PEM scenario (918-961 USD/kg). However, based on the projection, the cost decline for PV-PEM was more significant due to its high learning rate and the cost would be competitive with fossil-based methanol from 2060.
Supplementary Information
Additional file 1.
The online version contains supplementary material available at https://doi.org/10.1007/s43979-023-00069-1.
Authors’ contributions
MRP: Methodology, Software, Validation, Investigation, Formal analysis, Visualization, Writing - original draft. RM: Validation, Methodology, Supervision, Writing - review & editing. WWP: Conceptualization, Methodology, Supervision, Writing - review & editing. All authors read and approved the final manuscript.
Funding
Open access funding provided by Shanghai Jiao Tong University. No funding was received to assist with the preparation of this manuscript.
Availability of data and materials
Enquiries about data availability should be directed to the authors.
Declarations
Ethics approval and consent to participate
Not applicable.
Competing interests
The authors do not have any relevant competing interests to declare in relation to the content of this article.
Consent for publication
All authors agree to the publication of this manuscript.
Publisher’s Note
Springer Nature remains neutral with regard to jurisdictional claims in published maps and institutional affiliations.
