
1 Introduction
Energy security and climate change have an impact on the economy, the environment, technology, and society. Global warming has become one of humanity’s greatest threats. Consumption of fossil fuels increases carbon dioxide (CO2) concentration, the principal greenhouse gas (GHG) caused by humans. There is an urgent need to address global warming caused by the greenhouse effect, as well as how to meet our energy needs in a sustainable manner. In response to climate change, reducing CO2 emissions and pursuing low-carbon development have become unavoidable options.
The Paris Agreement is a legally binding international climate change treaty. It was adopted by 196 parties at Climate Change Conference (COP) 21 in Paris on December 12, 2015, and it went into effect on November 4, 2016. The goal is to limit global warming to less than 2 degrees Celsius, preferably 1.5 degrees Celsius, relative to pre-industrial levels [29]. Every 5 years, each nation must submit an updated Nationally Determined Contribution (NDC).
In an effort to reduce average global temperatures, Indonesia has committed to a low-carbon development strategy. In its First NDC report, Indonesia pledged to reduce its emissions by 29% below business as usual (BaU) levels by 2030 on its own, and by 42% with international assistance [16]. Indonesia revised its UNFCCC NDC commitments in 2021, but the emission reduction remained the same.
Asian Development Bank Institute stated that Indonesia accounts for more than 35 percent of the Association of Southeast Asian Nations’ (ASEAN) total energy demand [8]. Indonesia’s contribution to reducing emissions at the ASEAN and global levels is crucial. And as the largest emitter of greenhouse gases in 2019, the energy sector is expected to significantly contribute to Indonesia’s emission reductions [14].
Indonesian power sector is one of the leading contributors to the reduction of GHG emissions; however, it is still dominated by power generation technologies that rely on fossil fuels. In 2020, coal accounted for 62 percent of the production of electricity [20]. This value is still far below the national energy policy target, which calls for a minimum renewable energy share of 23% in 2025 and 31% in 2050. Therefore, careful planning of the energy system in Indonesia, particularly the electricity sector, is essential.
Numerous policy methods have been implemented to reduce CO2 emissions in the power sector, economists and international organizations strongly recommend carbon pricing as a cost-effective instrument for achieving a given abatement target. Some developed and developing countries, such as Sweden, implemented a carbon tax in 1991 at a rate of United States dollars (USD) 26.07/ tCO2, which has gradually increased to USD 123.07/ tCO2 by 2022. By implementing carbon price, Sweden has reduced its greenhouse gas emissions by 35 percent by 2020 [19].
The Indonesian government, through the Directorate General of Taxes (DGT), has been enacting policies to reduce the growth of GHG from the energy sector [25]. The government has learned from the success stories of other countries regarding carbon pricing. Under Law No. 7 of the Year 2021 on the Harmonization of Tax Regulations (UU HPP), on October 7, 2021, Indonesia enacted a carbon tax of IDR 30,000 or the equivalent of USD 2.02/ tCO2e emission above the specified cap. The carbon tax is based on a cap-and-tax system that assesses a fee on carbon emissions that exceed a predetermined limit. Indonesia has pushed back the implementation of a carbon tax scheduled for April and July 2022 to an unspecified time. According to Sri Mulyani, the Minister of Finance, government officials decided to delay the implementation of a carbon tax because they required additional time to ensure that it was consistent with or compatible with existing laws and to coordinate the implementation roadmap. The rising cost of essential commodities and energy also contributed to this decision. The rate of inflation increased to 2.64 percent in March 2022 [2]. According to Sri Mulyani, the Minister of Finance, government officials decided to delay the implementation of a carbon tax because they required additional time to ensure that it was consistent with or compatible with existing laws and to coordinate the implementation roadmap. The rising cost of essential commodities and energy also contributed to this decision. The rate of inflation increased to 2.64 percent in March 2022.
To reduce CO2 emissions, Indonesia plans to establish a carbon trading market and expand the carbon tax to industries other than coal-fired power generation by 2025 [27].
If Indonesia can optimize its carbon price in the power sector, it can contribute to the global effort to limit the rise in global average temperatures to 2°C by the middle of the century. In response to this concern, the Integrated Market Allocation (MARKAL)-EFOM System (TIMES) model will be used to analyze and optimize the effect of the carbon price on Indonesia’s power sector. Several research papers on carbon prices have previously used the TIMES model, one of which is the paper by Liu et al. in 2018. This paper analyzes the impact of control measures and carbon pricing mechanisms on China’s power sector using the TIMES model to develop several emission scenarios.
In this context, the following specific research questions are be investigated:
● What are the effects of instituting a carbon tax on the Indonesian power sector?
● How much carbon tax is required for Indonesia to meet its NDC?
To answer these questions, an analysis of the effect of the carbon price on carbon emission, energy mix, and energy investment was conducted using the current Indonesian DGT carbon price rate and the proposal for an International Carbon Price Floor (ICPF) for middle-income and high-income countries in Indonesia by 2050. In addition, an estimate of how much carbon tax Indonesia must implement to meet its NDC by 2030 of reducing between 29 and 41% of its emissions under the BaU scenario by 2030 was conducted. In the TIMES model, the power sector model is constructed.
2 Model development
The Indonesia TIMES model was developed with 2020 as the base year to examine the impact of carbon prices on the Indonesian electricity sector through 2050. This base year was chosen due to the timeliness and accessibility of the data.
2.1 TIMES model generator
TIMES is a technologically advanced economic model generator for single or multi-regional energy systems. Each technology is described in TIMES using technical and economic parameters. TIMES optimizes based on the requirements of end-use energy services, the existing energy equipment stocks, and the characteristics of future technologies. TIMES also requires current and future primary energy sources and their potential [4].
The TIMES model aims to provide energy services at the lowest possible global cost by making simultaneous decisions regarding equipment investment, operation, and primary energy supply. The model of the generation equipment is selected based on an evaluation of the characteristics of alternative generation technologies, the economics of energy supply, and environmental considerations.
TIMES assumes competitive markets for all commodities by default, in which case the equilibrium is partially regulated. The outcome is an equilibrium between supply and demand that maximizes the total net surplus [9]. In every period, the calculated quantities and prices for the commodities are in equilibrium, which means that for each commodity, the quantities produced by suppliers and the quantities demanded by consumers are equal. Therefore, equilibrium exists at the intersection of the supply and demand curves,consequently, market prices are equal to the marginal values in the system.
The description of the energy system object of study in TIMES is based on the Reference Energy System (RES), a network diagram that represents the relationship between the main constituents of an energy system, which are [9]:
● Commodities: any good produced, transformed or consumed by technologies. In TIMES they are classified into five groups: energy carriers, material, monetary flows, emissions, and energy service.
● Technologies: any equipment that produces, transforms, transmits, distributes, or uses commodities.
● Commodity flows: the amount of commodity consumed or produced by a particular technology.
The TIMES model requires the description of a time horizon. Then, such a time horizon is subdivided into distinct time periods consisting of several years that can vary from period to period [9].
TIMES is constructed using variables and equations derived from the input data. In TIMES, a process’s outputs are linear functions of its inputs, and nonlinear functions, such as supply and demand curves, can be represented by a stepped sequence of linear functions. All equations in the TIMES principle are linear. This linearity property enables the partial equilibrium to be calculated as a linear programming problem [28].
The objective of linear programming problems is to maximize or minimize an objective function linear in the unknowns while adhering to constraints expressed as linear equations and inequalities. The standard formulation for linear programming is as follows:
$\begin{array}{c}\mathrm{min\, }{\mathrm{c}}^{\mathrm{T}}\mathrm{ \,x}\\ \mathrm{Ax }=\mathrm{ b}\\ \mathrm{x }\ge 0\end{array}$
Where c and b are the vectors of the known coefficients, A is the matrix of known coefficients, T is the transpose operator, and x is the vector of decision variables (the unknowns to be determined by the optimization).
The objective function, which expresses the minimization criterion, is the first expression. The remaining two expressions represent the constraints, which are a set of equations or inequalities containing the decision variables to be satisfied.
The objective function of TIMES is the discounted sum of annual energy system costs, which must be minimized. First, for each year of the time horizon, the total costs incurred during that year are determined. Then, TIMES computes the total net present value for each region by discounting the costs of each year relative to a given reference year. Finally, they are summed into a single cost, which is the objective function to be minimized. The mathematical expression for the TIMES objective function is [9]:
$Total\, discounted\, cost=\sum\limits_{r=1}^{R}\sum\limits_{y\in YEARS}{(1+{d}_{r,y})}^{REFYR-y}1*{ANNCOST}_{r,y}$
where:
● ANNCOST(r,y): annual total cost for region r and year y
● dr,y: discount rate
● REFYR: reference year for discounting
● YEARS: cost-bearing years within the time horizon
● R: region considered in the model
TIMES implements these large-scale optimization models using GAMS, a high-level programming language that solves energy system problems with thousands of constraints and variables. Several tools exist for managing a TIMES model without inputting and manipulating data directly in GAMS; VEDA-FE (Front End) and ANSWER for creating, modifying, and running a model, and VEDA-BE and ANSWER for exploring and analyzing model results, are the most important model interfaces.
Figure 1 provides an overview of the Indonesian electricity sector model structure. This system model is constructed using TIMES, a model generator created by the Energy Technology System Analysis Programme of the International Energy Agency. The VErsatile Data Analyst (VEDA) manages the data handling process in TIMES by processing input and output data, and the data will be analyzed by General Algebraic Modeling System (GAMS).
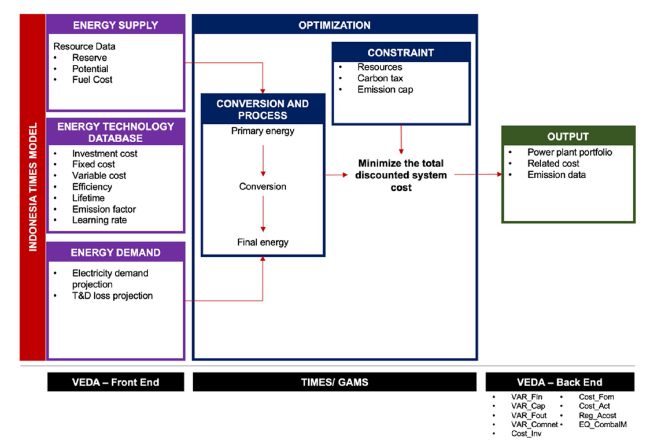
Fig. 1 Overview framework of the Indonesian electricity sector model structure |
2.2 Scenario
Table 1 presents seven scenarios with varying carbon prices to see the effects of instituting a carbon tax on the Indonesian power sector up until 2050. The price starts at 2.02 USD/ tCO2 and then increased abruptly until the desired price.
1. 2.02 USD/ tCO2: approved price rate by the Indonesian Directorate General of Taxes under Law No. 7 of 2021 on the Harmonization of Tax Regulations [25].
2. 50 USD/ tCO2: Indonesia is classified as a middle-income country by the World Bank, this is the proposed middle-income country price floor by ICPF [22].
3. 75 USD/ tCO2: this is the price floor for the high-income country proposed by ICPF or the upper limit of the middle-income country [22].
4. 10, 25, 35 USD/ tCO2: due to the significant change from 2.02 to 50 USD tCO2, it will be challenging to analyze the transitions in between, so these three prices need to be added to see the transition.
5. 150 USD/ tCO2: this price is added to determine what happens if the carbon price is well above 75 USD/ tCO2.
Table 1 Applied carbon price to see the effects of instituting carbon tax on the Indonesian power sector |
| Year | DGT | 10 USD | 25 USD | 35 USD | 50 USD | 75 USD | 150 USD |
|---|---|---|---|---|---|---|---|
| 2023 | 2.02 | 2.02 | 2.02 | 2.02 | 2.02 | 2.02 | 2.02 |
| 2025 | 2.02 | 3.35 | 5.85 | 7.52 | 10.02 | 14.18 | 26.68 |
| 2030 | 2.02 | 4.68 | 9.68 | 13.01 | 18.01 | 26.35 | 51.35 |
| 2035 | 2.02 | 6.01 | 13.51 | 18.51 | 26.01 | 38.51 | 76.01 |
| 2040 | 2.02 | 7.34 | 17.34 | 24.01 | 34.01 | 50.67 | 100.7 |
| 2045 | 2.02 | 8.67 | 21.17 | 29.5 | 42 | 62.84 | 125.3 |
| 2050 | 2.02 | 10 | 25 | 35 | 50 | 75 | 150 |
And, in order to answer the question of how much carbon price is required to meet Indonesia’s 2030 NDC [17], two scenarios have been developed:
1. 29 percent reduction scenario: the power sector is expected to reduce 11% of 2030 BaU emissions in this scenario.
2. 41 percent reduction scenario: the power sector is expected to reduce 14% of 2030 BaU emissions in this scenario.
2.3 Reference energy system and model framework
The description of the energy system object of study in TIMES is based on the Reference Energy System (RES), a network diagram that shows the relationship between an energy system’s primary components, which are commodities, technologies, and commodity flows [9]. Figure 2 shows the energy sector examined in this research.
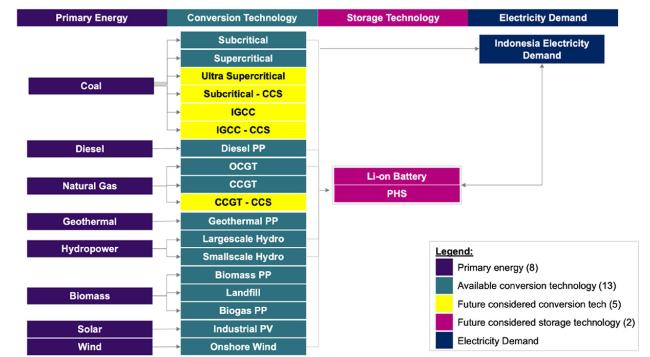
Fig. 2 RES of Indonesia power sector |
In this model, 17 power plants and two energy storage technologies compete, including fossil power plants such as coal, diesel, and gas, renewable energy technology such as geothermal, hydropower, and biomass, and variable renewable energy technology such as utility-scale solar and large-scale onshore wind. Li-ion batteries and pumped hydro storage (PHS) are energy storage technologies.
The initial stage that must be specified in the VEDA is the system boundary. The first definition is the number of regions; the model considers Indonesia to be a single region. The reason for choosing a single region as the geographic focus for this model is that it is difficult to find data pertaining to a single district or province, so there will be a great deal of missing information, necessitating an excessive number of assumptions.
The second boundary consists of landmark years, which include 2020 as the base year, 2025, 2030, 2035, 2040, 2045, and 2050. In this study, only the power sector will be examined. The time slice utilized in this study will be streamlined to an hourly time slice.
A discount rate is the rate of return that is applied to the present value of future cash flows. Costs and the discount rate used to finance those costs must be covered by the electricity business’s revenue. The majority of power generation projects in Indonesia are 70-80% debt-financed and are dependent on funders; for international funding, the discount rate ranges from 5 to 8%, and for local funding, the discount rate ranges from 7 to 12% [7]. Moreover, the discount rate used to evaluate projects in developing countries is ten percent [31]. The discount rate is therefore 10% for all technologies and scenarios throughout the entire model year.
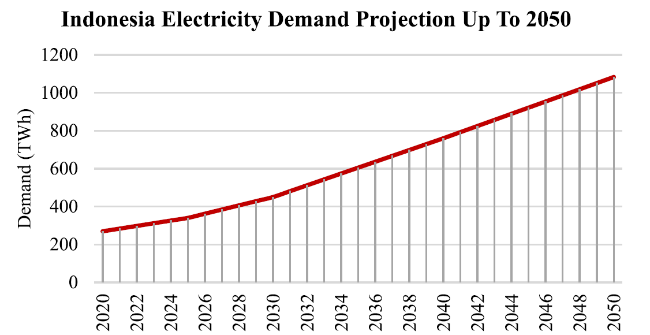
2.4 Electricity demand
2.5 Energy resource potential in Indonesia
Indonesia is endowed with various energy resources, as described in Tables 2 and 3. As seen in Table 2, the resource potentials that come from fossil fuels that are considered include coal, diesel, and natural gas. Moreover, the renewable energy resource potentials come from geothermal, hydropower, biomass, wind, and solar. To meet domestic and international demands, fossil fuels (petroleum, natural gas, and coal) have been heavily exploited. Even though the renewable energy potential is substantial, particularly for solar and hydropower, the level of renewable energy utilization is still low, accounting for only 11.09 percent of the total capacity in 2020 [26].
| Resource | Reservea | Resourcea | Unit | 2020 R/P Ratiob | Import (TJ)a | Export (TJ)a |
|---|---|---|---|---|---|---|
| Coal | 38,805.48 | 143,700.00 | million ton | 62 | 246,929 | 9,266,244 |
| Oil | 2.44 | 4.17 | billion barrels | 9 | 453,295 | 178,895 |
| Natural gas | 43.57 | 62.39 | Trillions of standard cubic feet of gas (TSCF) | 19.8 | - | 795,123 |
2.6 Techno-enviro-economic and flexibility parameters
In this model, 17 power plants and two energy storage technologies compete, including fossil power plants such as coal, diesel, and gas, renewable energy technology such as geothermal, hydropower, and biomass, and variable renewable energy technology such as utility-scale solar and large-scale onshore wind. Li-ion batteries and pumped hydro storage (PHS) are energy storage technologies. The techno-economic and environmental parameters are obtained from Directorate General of Electricity of Indonesia and Danish Energy Agency report on 2021, Technology Data for the Indonesian Power Sector.
Factors that affect competition between technologies in the future are investment costs and their reductions and emissions if we consider carbon prices. Future technological developments are vital things that need attention in building a country’s RES [24]. Technological developments show the relationship between energy costs and technology as a function of time.
The learning curve concept estimates investment cost function. This formula is based on empirical observations with the relationship between the two, both cumulative production and installed capacity, which is explained in the logarithmic equation below:
${{Y}}_{{y}}{e}{a}{r}\boldsymbol{ }{\,n}={a}\boldsymbol{ }{{\,x}}^{\frac{{l}}{n}}\boldsymbol{ }{\,b}\boldsymbol{ }{{l}}{n}\boldsymbol{ }\,2$
Y = Technology unit cost
a = Base year cost
x = Learning rate percentage
b = Cumulative experience
Figures 4 and 5 shows the rate of decline in investment costs for each technology from 2020 to 2050 after running Eq. 3. The power plants with the lowest investment costs were PLTS and biogas power plants. This is because this technology has the highest learning rate when compared to other technologies. Coal, diesel oil, and gas-fired power plants have relatively low investment costs but higher emission factors and fuel costs.
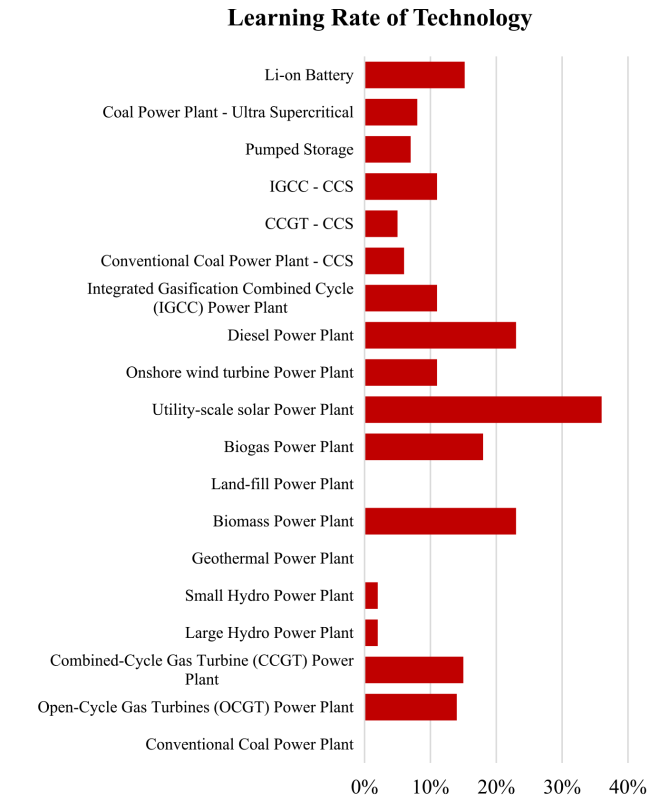
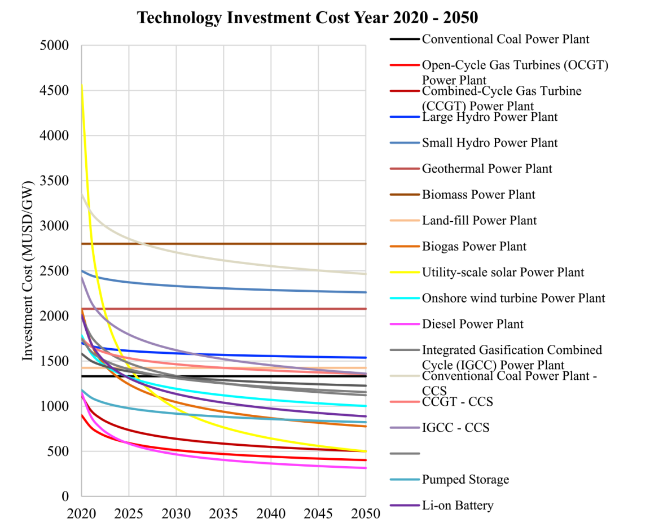
Fig. 5 Technology investment cost up until 2050 |
2.7 Fuel cost
The fuel cost projection is taken from the study of Reyseliani and Purwanto in 2021. This projection is carried out following the assumption of world crude oil price growth projections. As seen in Fig. 6, diesel oil will be hard to compete in the future due to its high price. For technologies that use coal and natural gas, there is still a possibility to compete with other technologies looking at the decline in fuel prices that occurred in 2020-2050.
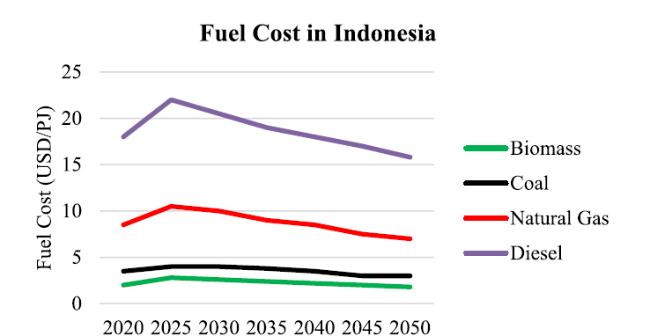
Fig. 6 Comparison of fuel prices in 2020-2050 (source: [23]) |
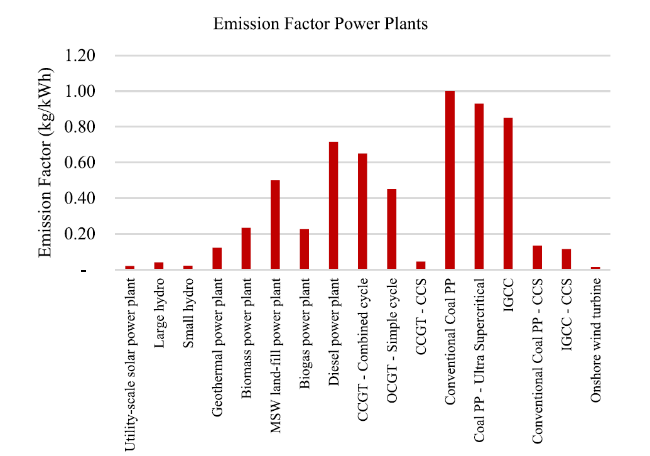
2.8 Emission factor
The CO2 emission factor for various power generation technologies, from primary energy to electricity, is shown in Fig. 7. Coal-fired power plants produce the most CO2. Meanwhile, solar power plants, wind power plants, hydropower plants, and geothermal power plants emit the least amount of pollution. CCS usage reduces the emission factor of fossil power plants.
2.9 National electricity system performance
Figure 8 demonstrates the transmission and distribution performance of the Indonesian electricity system. From 2012 to 2020, T&D losses in Indonesia will continue to decrease for improved performance. This historical data will be incorporated into the modelling in order to predict losses until 2050.
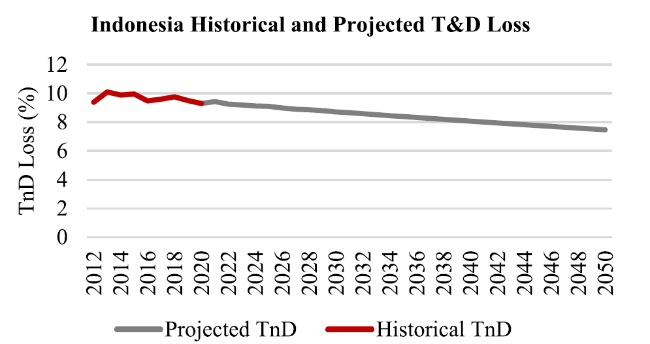
Fig. 8 Transmission and distribution losses in Indonesia % (source: [26]) |
3 Model validation
After obtaining the results of model optimization, the results are validated. Validation is performed by calculating the portfolio generation capacity error rate. The acceptable error rate is less than or equal to 10% absolute. This is done to ensure that the model adequately represents the existing system. According to Table 4, the error rate of each type of generated optimization falls below the 10% threshold and is nearly identical to State Electricity Company’s RUPTL 2020 mix, with coal, diesel, natural gas, hydro, geothermal, wind and solar 0.01% error rate, and biomass 0.96% error rate.
Table 4 Validation result of Indonesian TIMES model up until 2050 |
| Plant Type | Power Generation (TWh) | Power Generation Share % | Power Generation Error Rate | Power Generation Share Difference | ||
|---|---|---|---|---|---|---|
| Actual RUPTL 2020 | Model Result | Actual RUPTL 2020 | Model Result | |||
| Coal | 180.2 | 180.19 | 66.30% | 66.92% | 0.01% | 0.62% |
| Diesel | 6.9 | 6.90 | 2.54% | 2.56% | 0.01% | 0.02% |
| Natural gas | 45.67 | 45.67 | 16.80% | 16.96% | 0.01% | 0.16% |
| Hydro | 17.9 | 17.90 | 6.59% | 6.65% | 0.01% | 0.06% |
| Geothermal | 15.56 | 15.56 | 5.73% | 5.78% | 0.01% | 0.05% |
| Wind | 0.47 | 0.47 | 0.17% | 0.17% | 0.01% | 0.00% |
| Solar | 0.13 | 0.13 | 0.05% | 0.05% | 0.01% | 0.00% |
| Biomass | 2.41 | 2.43 | 0.89% | 0.90% | 0.96% | 0.01% |
4 Results and discussion
4.1 Impact of carbon price
The results of the optimization of the electricity sector consider the economic and environmental aspects translated into a carbon price. All carbon price scenario in Table 1 is applied to the BaU model.
Figure 9 shows the installed capacity from 2020 to 2050 in BaU, as well as the carbon price scenarios that have been applied. In addition, Fig. 10 summarizes the increases and decreases of the installed capacity in 2050 for each scenario compared to BaU in order to better comprehend the impact of applying carbon prices to the BaU model. As the price of carbon increases, the proportion of installed capacity will shift towards technologies with a lower emission factor.
● DGT plan 2.02 USD/ tCO2e: compared to BaU, share of conventional coal power plants will decrease, 31.15 GW will switch to ultra-supercritical power plants in 2050, and 3.93 GW will be fulfilled by gas power plants in 2050.
● 10 USD/ tCO2e: compared to BaU, the shift from conventional coal power plants to ultra-supercritical will be 60.70 GW, and the shift to gas power plants will be even more significant, namely 8.56 GW in 2050.
● 25 USD/ tCO2e: compared to BaU, the shift from a conventional coal power plant to an ultra-supercritical one will be higher than DGT 2.02 USD/ tCO2e, which is 125.80 GW in 2050. The shift to a gas power plant will be even more significant, namely 10.78 GW in 2050. At this carbon price, there is also a slight shift to become a utility-scale solar power plant of 85.70 GW in 2050.
● 35 USD/ tCO2e: shifting from conventional coal power plants to ultra-supercritical and gas power plants will be less, namely 57.41 GW and 10.77 GW receptively in 2050. This is because, at this price, the model will choose cleaner technologies from fossil fuel power plants. Compared to 25 USD/ tCO2e and BaU, a utility-scale solar power plant becomes larger, 157.05 GW.
● ICPF for middle-income countries 50 USD/ tCO2e: shifting to advanced coal and gas power plants will be even less, 49.24 GW and 9.57 GW in 2050, respectively. However, solar utility-scale and geothermal will increase to 176.87 GW and 28.4 GW in 2050, respectively.
● ICPF for high-income countries 75 USD/ tCO2e: there will be a little shift from conventional coal to advanced coal 24.27 GW, and gas power plants by 6.63 GW in 2050. Solar utility-scale and geothermal will increase to 176.88 GW and 28.5 GW in 2050, respectively. Moreover, at this price, hydropower will be driven to be installed by 53.23 GW in 2050.
● 150 USD/ tCO2e: there will be no shift from conventional coal to advanced coal. However, conventional coal and gas power plants will reduce their capacity, and the model will choose utility-scale solar of 203.36 GW, geothermal 28.5 GW, and hydropower 100.06 GW. The geothermal portion does not change from 75 USD/ tCO2e to 150 USD/ tCO2e; the modeler includes a geothermal potential capacity limit, according to the Ministry of Energy and Mineral Resources publication in 2018 (Tables 2 and 3).
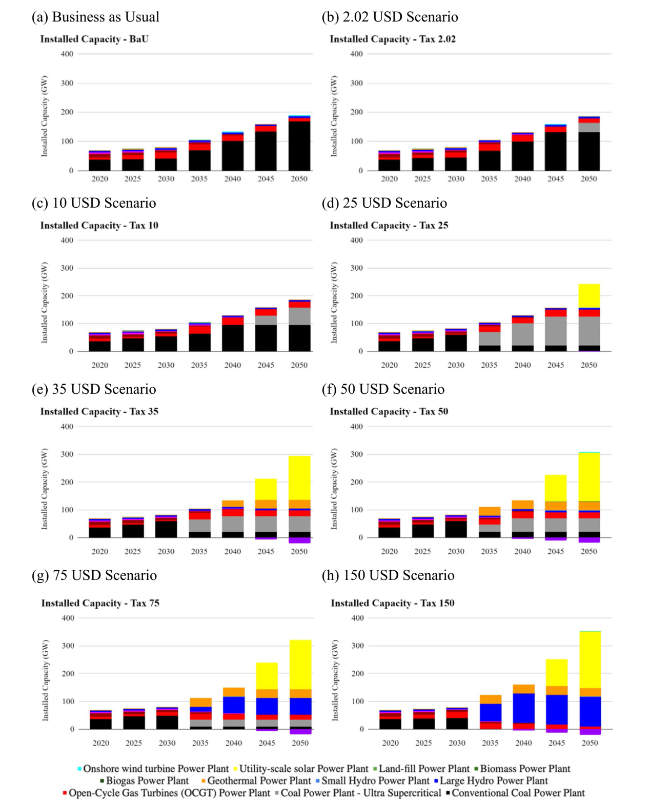
Fig. 9 Installed capacity until 2050 for a business as usual b 2.02 USD scenario c 10 USD scenario d 25 USD scenario e 35 USD scenario f 50 USD scenario g 75 USD scenario h 150 USD scenario |
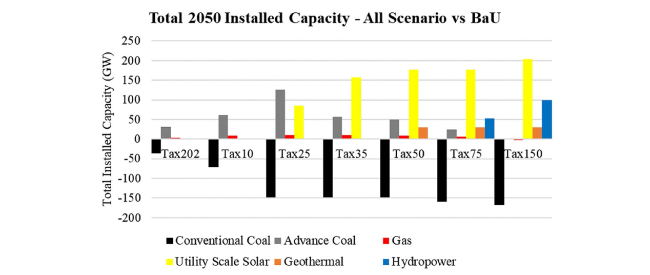
Fig. 10 2050 installed capacity - all scenario vs BaU |
Figure 11 shows BaU power generation in TWh from 2020 to 2050, using all carbon price scenarios. Furthermore, Fig. 12 summarizes the increases and decreases in power generation in TWh in 2050 for each scenario compared to the BaU model to better understand the impact of applying carbon prices to the BaU model. As the applied carbon price rises, the share of power generation will shift to technology with a lower emission factor.
● DGT plan 2.02 USD/ tCO2e: compared to BaU, the portion of coal power generation will decrease by 29.27 TWh and will switch to gas in 2050
● 10 USD/ tCO2e: compared to BaU, the shift from coal to gas will be even higher, 63.74 TWh in 2050
● 25 USD/ tCO2e: compared to BaU, coal power generation will reduce even higher to 253 TWh, gas will increase by 80.30 TWh and solar by 170.34 TWh in 2050.
● 35 USD/ tCO2e: compared to BaU, coal power generation will reduce even higher to 551 TWh, gas will increase by 64.86 TWh, and solar by 329.39 TWh in 2050.
● ICPF middle-income countries 50 USD/ tCO2e: coal power generation will reduce even higher to 600.44 TWh, gas will increase by 71.28 TWh, solar by 370.96 TWh in 2050, and geothermal by 156 TWh.
● ICPF high-income countries 75 USD/ tCO2e: coal power generation will reduce even higher to 825.39 TWh. Gas will increase only to 49.35 TWh from BaU, lower than 50 USD. The model will increase solar by 370.98 TWh, geothermal by 157.94 TWh, and hydro by 247.13 TWh in 2050.
● 150 USD/ tCO2e: coal power generation will reduce even higher to 1,030.83 TWh, and gas will also reduce by 18.17 TWh from BAU in 2050. The model will choose to increase solar by 426.51 TWh, geothermal by the same increment as 75 USD/ tCO2e, and hydro by 464.55 TWh in 2050. The geothermal portion does not change from 75 USD/ tCO2e to 150 USD/ tCO2e; this is because the modeler includes a geothermal potential capacity limit, according to the Ministry of Energy and Mineral Resources publication in 2018 (Tables 2 and 3).
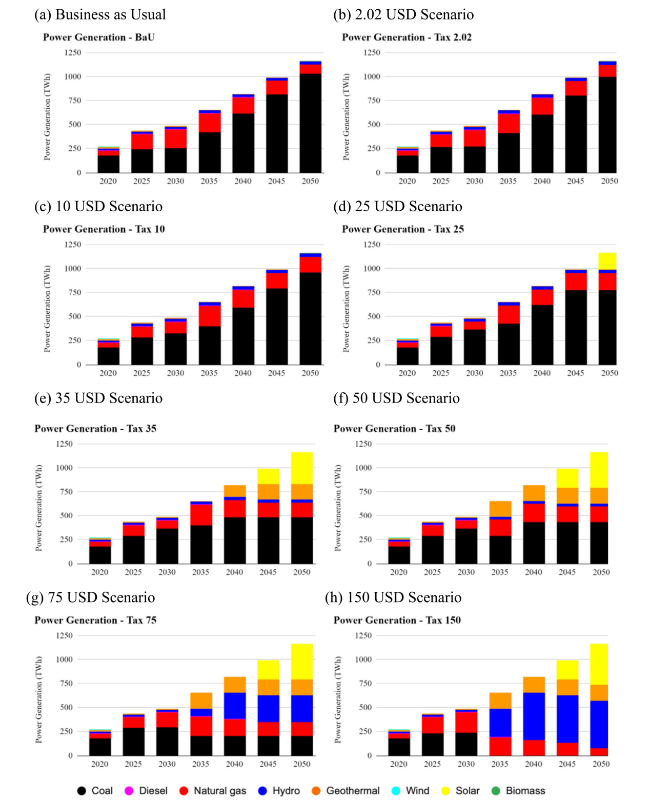
Fig. 11 Power Generation Until 2050 for a business as usual b 2.02 USD scenario c 10 USD scenario d 25 USD scenario e 35 USD scenario f 50 USD scenario g 75 USD scenario h 150 USD scenario |
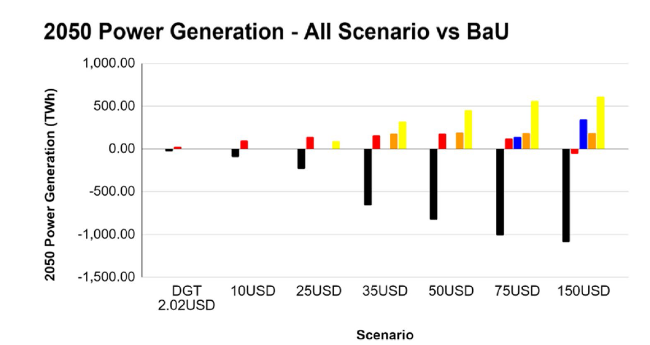
Fig. 12 2050 power generation - all carbon price scenario vs BaU |
● BaU: CO2 emissions will increase exponentially from 211.09 to 1074.33 million tCO2e or experience an increase of 409%.
● DGT plan 2.02 USD/ tCO2e: the graph overlaps with BaU because the carbon price of 2.02 USD/ tCO2e is too small to bring about visible changes, in 2050, only about 9.38 million tCO2e was reduced compared to BaU. This carbon price experiences an increase of 404.50% from 2020 BaU.
● 10 USD/ tCO2e: changes in CO2 levels are already visible on the charts, but only 133.81 million tCO2e from BaU in 2050. This carbon price experiences an increase of 345.56% from 2020 BaU.
● 25 USD/ tCO2e: the change in CO2 level is 381.47 million tCO2e from BaU in 2050. This carbon price experiences an increase of 228.23% from 2020 BaU.
● 35 USD/ tCO2e: the change in CO2 level is 612.22 million tCO2e from BaU in 2050. This carbon price experiences an increase of 118.92% from 2020 BaU.
● ICPF middle-income country 50 USD/ tCO2e: the change in CO2 level is 645.00 million tCO2e from BaU in 2050. This carbon price experiences an increase of only 103.39% from 2020 BaU.
● ICPF high-income country 75 USD/ tCO2e: the change in CO2 level is 840.96 million tCO2e from BaU in 2050. This carbon price experienced an increase of only 10.56% from 2020 BaU.
● 150 USD/ tCO2e: the change in CO2 level is 1039 million tCO2e from BaU in 2050. This carbon price experienced a decrease of -83.26% from 2020 BaU.
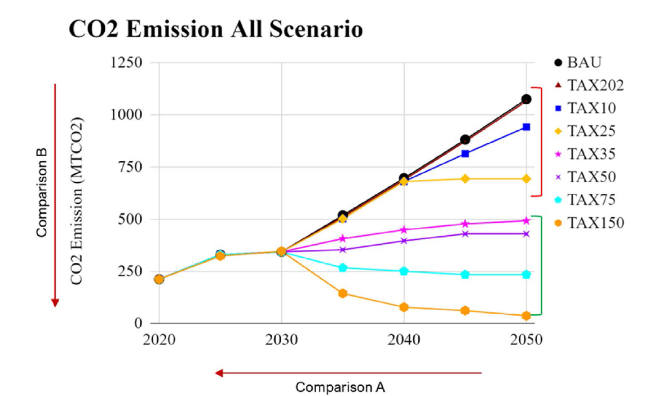
Fig. 13 CO2 emission 2020-2050 in different carbon price scenario |
Table 5 Emission comparison table in different carbon price scenario |
| Scenario (USD/ tCO2e) | 2050 to 2020 Comparison (A) | 2050 Comparison to BaU (million tCO2e) (B) | 2050 Emission Intensity (gCO2e/ kWh) |
|---|---|---|---|
| BaU | 408.95% | N/A | 923.16 |
| 2.02 USD | 404.50% | -9.38 | 915.10 |
| 10 USD | 345.56% | -133.81 | 808.18 |
| 25 USD | 228.23% | -381.47 | 595.37 |
| 35 USD | 118.92% | -612.22 | 397.09 |
| 50 USD | 103.39% | -645.00 | 368.92 |
| 75 USD | 10.56% | -840.96 | 200.54 |
| 150 USD | -83.26% | -1039.00 | 30.36 |
Figure 14 shows the total cost (investment, variable, and fixed) for BaU and all scenarios from 2020 to 2050 in billion USD. The total cost to Indonesia under the BaU scenario until 2050 is 15.83 billion USD. In the scenario of Indonesia’s current carbon price of 2.02 USD/ tCO2e, the cumulative cost that will be imposed to Indonesia until 2050 is 16.32 billion USD, and the higher the carbon price that will be charged, the greater the total cumulative cost that must be borne, with the cumulative cost reaching 28.33 billion USD in the scenario of 150 USD/ tCO2e. Figure 15 shows the share of cumulative cost per technology selected by model. Coal power plants are a significant contributor to Indonesia’s cumulative cost; in BaU, it accounts for more than 75% of the cost but gradually decreases towards the higher carbon price imposed. Starting from 25 USD/ tCO2e, the cumulative cost for utility-scale solar power plants gradually increases as the carbon price increases. Starting from a carbon price of 35 USD/ tCO2e, geothermal increases little by little until 75 USD/ tCO2e reaches its maximum installed capacity due to potential limitations by the government. Hydropower increases gradually from a carbon price of 75 USD/ tCO2e.
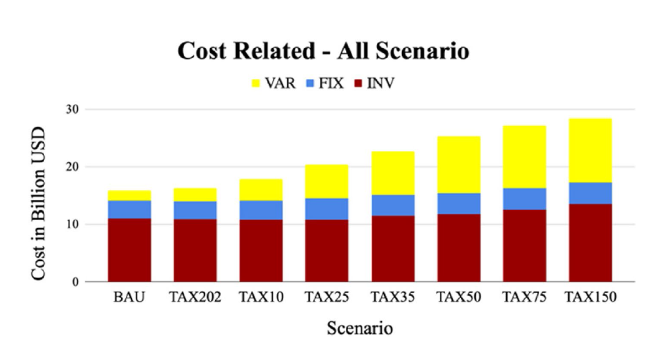
Fig. 14 Cumulative cost 2020-2050 in different carbon price scenario |
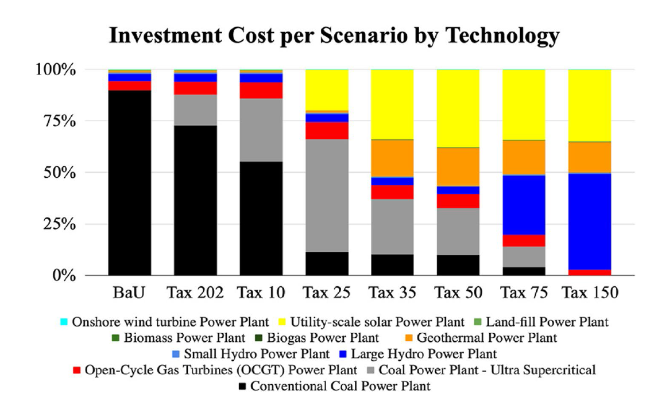
Fig. 15 Share of cumulative cost 2020-2050 per technology in different carbon price scenario |
Table 6 shows the average cost per kilowatt-hour of electricity generation from 2020 to 2050. In BaU, the average cost of electricity from 2020 to 2050 will be USD 0.029/ kWh. When a carbon price is implemented, the overall cost of electricity generation rises due to higher operating expenses and carbon pricing liabilities, until carbon price USD 150/ tCO2 the price will be USD 0.051/ kWh.
Table 6 Indonesia average cost of electricity generation for from 2020-2050 in different carbon price scenario |
| Scenario | Average Cost of Electricity Generation from 2020-2050 (USD/ kWh) |
|---|---|
| BAU | 0.029 |
| TAX 2.02 | 0.024 |
| TAX 10 | 0.032 |
| TAX 25 | 0.037 |
| TAX 35 | 0.041 |
| TAX 50 | 0.046 |
| TAX 75 | 0.049 |
| TAX 150 | 0.051 |
4.2 Approximate price needed for 2030 NDC
In accordance with Indonesian Law No. 16 of 2016, Indonesia ratified the Paris Agreement, committing to reduce its greenhouse gas emissions by 29% through its own efforts by 2030, or by 41% with international assistance. This commitment is consistent with the 2020 Nationally Determined Contribution (NDC) of Indonesia to the United Nations Framework Convention on Climate Change (UNFCCC). To achieve the aforementioned objective, the government has established sector-specific reduction targets, as shown in Table 7.
Table 7 Emission reduction NDC target (source: [11]) |
| Sector | GHG Emission Reduction Target (%) | |
|---|---|---|
| 29% Reduction | 41% Reduction | |
| Energy | 11.00% | 14.00% |
| Waste | 0.38% | 1.00% |
| IPPU/ Industry | 0.10% | 0.11% |
| Agriculture | 0.32% | 0.12% |
| Forestry | 17.20% | 23.00% |
As shown in the table above, the energy sector is critical to achieving Indonesia’s GHG emission reduction targets. Because of the country’s reliance on fossil fuels, the energy sector is responsible for the second highest greenhouse gas emissions after Forest and Other Land Use (FOLU). To achieve a 29 percent reduction scenario, the energy sector needs to reduce GHG emissions by 11%, while a 41 percent reduction scenario necessitates a 14% reduction.
Using the energy sector-specific reduction targets in Table 8, the constraint scenario is applied to the TIMES model over a shorter time period, from 2020 to 2030. Figure 16 shows the installed capacity in BaU from 2020 to 2030, with an unconditional 29% reduction and a conditional 41% reduction. As the percentage of reduced emissions increases, the proportion of installed capacity will shift toward technologies with lower emission factors.
Table 8 Emission reduction scenarios to estimate the required carbon price for Indonesia’s 2030 NDC |
| CO2 Emission | Unit | |
|---|---|---|
| Projection of Indonesia’s CO2 Emissions in 2030 | 316.67 | million tCO2e |
| Scenario 29% decrease (Energy: 11% decrease) | 281.83 | million tCO2e |
| Scenario 41% decrease (Energy: 14% decrease) | 272.33 | million tCO2e |
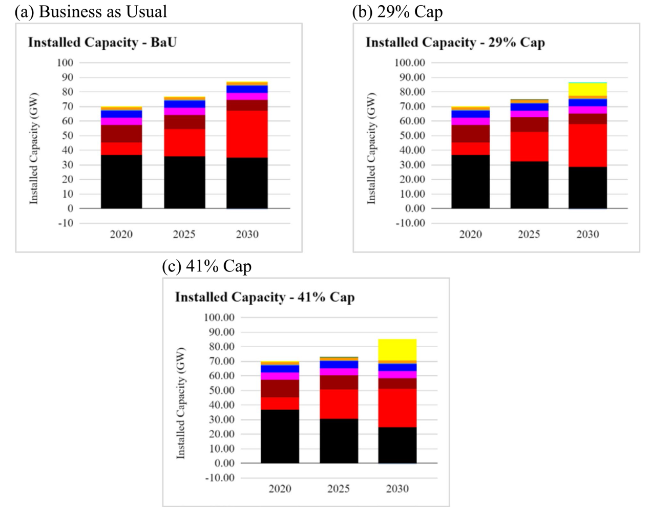
Fig. 16 Indonesia 2030 NDC emission reduction installed capacity for a business as usual b 29% cap c 41% cap scenarios |
In the scenario of a 29% reduction, the capacity of conventional coal power plants will reduce by 6.22 GW in 2030 compared to BaU. There is no change from conventional to advanced coal power plants. Solar power plants will increase significantly by 8.57 GW in 2030 compared to BaU due to the CO2 reduction of 11% at a 29% reduction scenario. In the 41% reduction scenario, the capacity of conventional coal power plants will reduce by 8.22 GW in 2030 compared to BaU. There is no visible change from conventional to advanced coal power plants. Solar power plants increase significantly by 14.05 GW in 2030 compared to BaU due to the CO2 reduction of 14% at a 41% reduction scenario.
Figure 17 shows the power generation in TWh from 2020 to 2030 in BaU, an unconditional 29% reduction, and a conditional 41% reduction scenario. As the emission reduction gets a higher percentage, the share of power generation will shift to technology with a lower emission factor. In the scenario of an unconditional 29% reduction, by 2030, power generated by coal power plants will be reduced by 114.23 TWh, while solar will increase by 33.33 TWh compared to BaU. In the scenario of a conditional 41% reduction, by 2030, power generated by coal power plants will be reduced by 115.23 TWh, while solar will increase by 54.44 TWh compared to BaU.
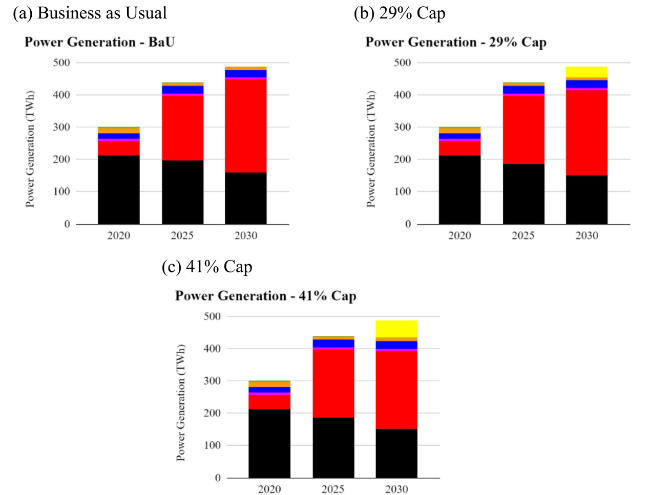
Fig. 17 Indonesia 2030 NDC emission reduction power generation for a business as usual b 29% cap c 41% cap scenarios |
Figure 18 shows the CO2 emissions from BaU under two scenarios: a 29% reduction and a 41% reduction. CO2 emissions in BaU are expected to rise exponentially from 208.15 million tCO2e in 2020 to 342.62 million tCO2e in 2030, a 40.87% increase if business as usual continues. In the 29 percent reduction scenario, CO2 emissions from the energy sector are expected to decrease by up to 11 percent, totaling 281.84 million tCO2e. CO2 emissions from the energy sector are expected to decrease by up to 14 percent in a 41 percent reduction scenario, totaling 272.33 million tCO2e.
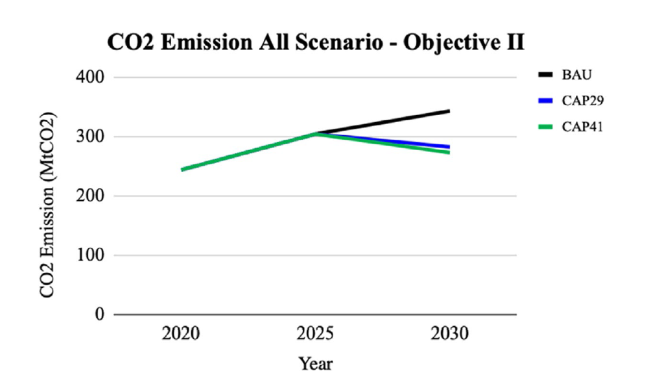
Fig. 18 CO2 emission until 2030 for Indonesia 2030 NDC emission reduction scenarios |
Figures 19 and 20 show the total cost related (investment, variable, and fixed) for BaU, an unconditional 29% and a conditional 41% emission reduction scenario in billion USD for 2020 to 2030. The greater the reduction percentage applied to BaU, the greater the costs that Indonesia must bear. The total cost of the 29% cost reduction scenario is 5.52 billion USD. Furthermore, the total cost required for the 41% reduction scenario is \$5.55 billion USD.
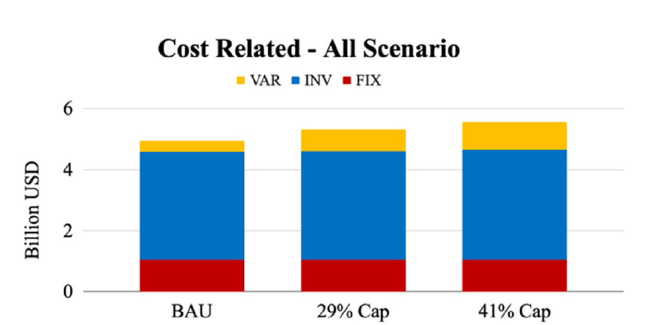
Fig. 19 Total cost of emission reduction scenarios for Indonesia 2030 NDC |
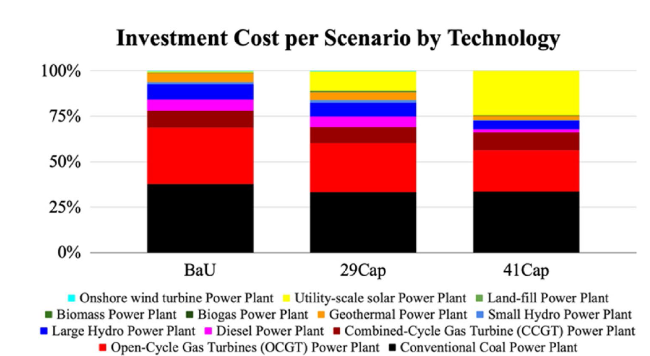
Fig. 20 Total cost per technology for Indonesia’s 2030 NDC emission reduction scenarios |
Table 9 shows the carbon tax generated by the model by 2030. To achieve an unconditional 29% reduction scenario, which is an 11% reduction in energy sector emissions to 281.84 million tCO2e by 2030, Indonesia will need a carbon price of USD 39.65/ tCO2e by 2030. To achieve a 41% reduction scenario, which is a 14% reduction in energy sector emissions to 272.33 million tCO2e by 2030, Indonesia will need a carbon price of USD 43.78/ tCO2e by 2030.
Table 9 Generated carbon price by the 2030 model |
| Scenario | Carbon Price (USD/ tCO2e) |
|---|---|
| 29% Reduction | 39.65 |
| 41% Reduction | 43.78 |
According to the model’s carbon price results, USD 39.65/tCO2e and USD 43.78/ tCO2e are still within the reasonable ICPF price range for middle-income countries (Table 10).
Table 10 ICPF carbon price floor types based on country income |
| Type of Country | IMF Floor Price (USD per tCO2e) |
|---|---|
| Low Income | 25 |
| Middle Income | 50 |
| High Income | 75 |
5 Discussion
Indonesia’s currently accepted carbon price rate is USD 2.02/ tCO2, but modeling results show that it will not make a significant difference from BaU. If prices remain unchanged in 2030 and 2050, this price will only result in more cost for an ineffective outcome. Singapore, for example, began carbon pricing in 2019 at a rate of SGD 5/ tCO2 or approximately USD 3.77/ tCO2 [21], however, the country made the bold decision to raise its carbon price rate to SGD 50-80/ tCO2 or approximately USD 37.68-60/ tCO2 in 2030 to support its net zero targets and improve the price signal and incentive for businesses and individuals to reduce their carbon footprint under national climate goals [5]. In order to meet an NDC goal, Indonesia needs to rapidly increase its carbon price level in the power sector to between USD 40 and 50/ tCO2 in accordance with ICPF standards for Middle-Income Countries and modeling results.
Currently, Indonesia intends to apply this carbon price only to coal-fired power plants. Singapore, for example, has a carbon price that already covers 80% of its total emissions from manufacturing, power, waste, and water facilities [5]. Moreover, looking at the results of Sweden’s carbon price, despite its high price and a significant amount of emission reduction, the policy has not achieved a satisfactory level of emissions reduction because significant polluters, such as steel and concrete manufacturers, are largely exempt from the tax until the introduction of The European Union Emissions Trading Scheme (EU ETS) to protect their international competitiveness, so they are not incentivized to reduce their emissions [10]. In the future, Indonesia may need to cover more sectors, especially the ones that contribute significantly to its emission.
Indonesia should also develop detailed regulations and a plan for how the carbon tax revenue will be used. Sweden has been able to reduce carbon emissions while maintaining solid GDP growth for the past thirty years, with GDP per capita increasing by more than 50 per cent between 1990 and 2019 [30]. This effect may be partly due to carbon tax revenue being used to lower other types of taxes in Sweden, with the remainder going to the government’s general funds [13]. Indonesia may benefit from lower emissions and other socioeconomic effects by ensuring that carbon revenue is used correctly. The introduction of carbon prices in Indonesia also poses several possible challenges. Direct challenges include institutional resistance, business influence in the political process, fossil fuel subsidies, and corruption. As well as indirect challenges, such as stranded assets, debt and revenue, outsourcing emissions, and distributional impact. Governments may face these challenges to ensure a smooth carbon tax policy implementation.
There are still some simplifications in this study, and several recommendations could improve the analysis in the future. This study assumes Indonesia is a single region, further research should take a multi-regional approach, which could be done in an island or province approach. This study only looked at the Indonesian power sector, and it is suggested to do a multi-sector modeling to see the effects on another sector as well. More research is needed to determine the socioeconomic effects of instituting a carbon price in Indonesia. The energy demand forecast input for this study was obtained from the Indonesian Government’s research institution; however, additional energy demand modeling may be required to account for Indonesia’s ability to meet the SDG 7 targets.
6 Conclusion
The introduction of carbon prices will impact the power sector in Indonesia. As the carbon price increases, installed capacity and power generation will shift to lower-carbon technologies; at USD 2.02-10/ tCO2 conventional coal plants will shift to gas-fired and supercritical coal plants, at USD 25-75/ tCO2 solar and geothermal power plants will emerge, and at USD 75-150/ tCO2 hydropower plant will emerge. As the carbon price rises, cumulative costs will rise more than BaU, increasing the average cost per kWh of electricity generation from 2020 to 2050 by 76%, from USD 0.029/kWh in BaU to USD 0.051/kWh in USD 150. As the price of carbon increases, peak emissions will also decrease relative to BaU, resulting in carbon prices below 25 USD/ tCO2 being costly and ineffective.
In order to reach an unconditional 29% and conditional 41% reduction scenario from the power sector, installed capacity and power generation need to shift to lower-carbon technology by 2030; gas and utility-scale solar plants will replace coal plants. The approximate carbon price needed to reach the unconditional 29% reduction scenario is USD 39.65/ tCO2 and for the conditional 41% reduction scenario is USD 43.78/ tCO2 by 2030. These prices are still within the reasonable ICPF price limit for Indonesia to approach the middle-income country price floor.
Abbreviations
ASEAN $\ \ \ \ \ \ \ \ $Association of Southeast Asian Nations
CCS $\ \ \ \ \ \ \ \ $Carbon Capture and Storage
CO2 $\ \ \ \ \ \ \ \ $Carbon Dioxide
DGT $\ \ \ \ \ \ \ \ $Directorate General of Taxes
GAMS $\ \ \ \ \ \ \ \ $General Algebraic Modeling System
GHG $\ \ \ \ \ \ \ \ $Greenhouse Gas
ICPF $\ \ \ \ \ \ \ \ $International Carbon Price Floor
IMF $\ \ \ \ \ \ \ \ $International Monetary Fund
NDC $\ \ \ \ \ \ \ \ $Nationally Determined Contributions
PHS $\ \ \ \ \ \ \ \ $Pumped Hydro Storage
RES $\ \ \ \ \ \ \ \ $Reference Energy System
RUPTL $\ \ \ \ \ \ \ \ $Rencana Usaha Penyediaan Tenaga Listrik
TIMES $\ \ \ \ \ \ \ \ $Integrated Market Allocation (MARKAL)-EFOM System (TIMES)
USD $\ \ \ \ \ \ \ \ $United States Dollar
UNFCCC $\ \ \ \ \ \ \ \ $United Nations Framework Convention on Climate Change
VEDA $\ \ \ \ \ \ \ \ $The VErsatile Data Analyst
Acknowledgements
Not applicable.
Authors’ contributions
FAK: Conceptualization, and design of study, acquisition of data, Formal analysis, Drafting the manuscript, revising the manuscript critically for important intellectual content, Approval of the version of the manuscript. SD: Conceptualization, and design of study, revising the manuscript critically for important intellectual content, Approval of the version of the manuscript.
Funding
Open access funding provided by Shanghai Jiao Tong University.
Availability of data and materials
Not applicable.
Declarations
Ethics approval and consent to participate
Not applicable.
Consent for publication
Not applicable.
Competing interests
The authors declare that they have no known competing financial interests or personal relationships that could have appeared to influence the work reported in this paper.
Publisher’s Note
Springer Nature remains neutral with regard to jurisdictional claims in published maps and institutional affiliations.
