
1 Introduction
Global warming is harmful to human life and ecological environment. Excessive emission of carbon dioxide (CO2), a major anthropogenic greenhouse gas (GHG), into the atmosphere has the profound impact on the global warming. The global CO2 emissions in 2019 was 36.71 billion tons from fossil fuels [1], which are the main emission sources of CO2 in the atmosphere. To reduce GHG emission, it is essential to separate CO2 from the exhaust gas emanated from combustion plants. Therefore, Post-combustion technology has attracted extensive attention, and a lot of researches have focused on the following technologies: membrane purification, cryogenic distillation, absorption and adsorption [2].
Chemical absorption method has been widely used in the industry because of low cost, large absorption, and high selectivity [3,4]. Whereas, due to the highly corrosive to equipment, high energy consumption and large efficiency loss, chemical absorption method still needs further improvement [5]. In contrast, solid adsorption exhibits favorable advantages including the absence of corrosivity, the low volatility and the low energy penalty [6,7]. Adsorbent is one of the key factors affecting CO2 capture by adsorption method. Molecular sieves are considered as CO2 adsorbents with good application potential because of following advantages: stable chemical properties, high wear resistance, high heat resistance, low thermal effect and easy large-scale production. Among which, 13X and 5A molecular sieve adsorption of CO2 has high selectivity and large adsorption capacity [8,9].
In order to improve the adsorption performance of adsorbents for CO2, many researches have done on the modification of adsorbent and changing of adsorption conditions. It is found that the adsorption capacity of CO2 on 13X molecular sieve can be improved by metal ion exchange, carbon black modification and amine functionalization [10,11,12]. However, the stability and industrial production of modified materials need further exploration. Reducing the adsorption temperature is also one of the effective ways to increase the adsorption capacity of CO2 [13,14]. Based on our previous findings [15], low temperature can reduce the energy consumption of pollutant removal condensing reducing water vapor content in flue gas, so we applied it on CO2 capture.
In this paper, we test the adsorption capacity of following adsorbents, 3A, 4A, 5A, 13X Molecular sieve and activated carbon at different temperatures. The effect of CO2 concentration and water vapor on the adsorption capacity of 13X molecular sieve have been explored. 6 times adsorption and desorption cycle tests are carried out to investigate the reusability of 13X molecular sieve. Finally, the energy consumption of absorbent desorption is calculated.
2 Experimental section
2.1 Materials
All gases used in this study are supplied by Beijing Huayuan Chemical Co., Ltd. The specifications on the gases are as follows: He (high purity grade, 99.995% purity), N2 (prepurified, 99.998% purity), CO2 (prepurified, 99.998% purity), and CO2/He certified gas mixtures (9.86% CO2 balance He). The adsorbent materials used in this study are 13X molecular sieve (powder and pellets with diameter of 0.6 ~ 0.9 mm), 3A molecular sieve (powder), 4A molecular sieve (powder), 5A molecular sieve (powder) and active carbon (powder), which are bought in Nankai University Catalyst Co., Ltd.
2.2 Evaluation of CO2 adsorption/desorption over absorbents
Pure CO2 adsorption tests are performed with MicrotracBEL catalyst analyzer BELCAT-II. First, 100 mg of absorbents are set to the middle tube of a triple sample tube and pretreated with He at 150 °C for 1 h to remove adsorbed adsorbate. After cooling to specific temperature, the flowing gas is switched to 30 sccm of 9.86 vol%- CO2/He for 1800 s to get breakthrough curve. The sample placement method is shown in Fig. 1. The adsorption capacity Qm is calculated by integrating CO2 concentration in the output steam. The effect of concentration CO2 is performed, and CO2 is diluted by He.
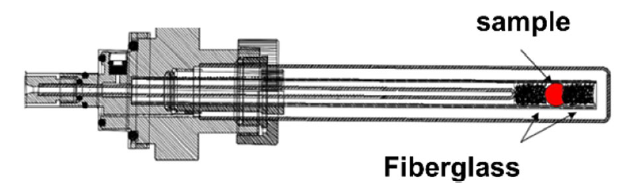
Fig. 1 Test equipment chart |
CO2 reusability experiments are performed on MicrotracBEL catalyst analyzer BELCAT-II. 13X Molecular sieve adsorbed 9.86% CO2 to equilibrium at 0 °C, then the purge is carried out at 20 °C with 30 mL/min of He for 2 h. Adsorbate is added to launch the second adsorption-desorption cycle, subsequently. 6 cycles are performed in total.
In this study, He is the balance gas rather than N2 for the following reasons. Firstly, the thermal conductivities of CO2 and N2 are similar, while helium has a much higher thermal conductivity than CO2 and is easily deprived of heat. Then, 13X has much higher selectivity for CO2 than N2, that is, N2 has little influence on the adsorption of CO2 by 13X [16,17,18,19].
2.3 Effects of water vapor
The water vapor effect on the CO2 uptakes using 13X at 53 °C has been investigated by breakthrough tests. Firstly, 20 g of 13X pellets (diameter: 0.6-0.9 mm) pretreated with N2 at 150 °C for 2 h are loaded into a copper tube (inner diameter: 8 mm). Secondly, a mixture with a flow rate of 1 L/min is introduced into the copper tube in the water bath at 53 °C, the concentration of carbon dioxide and water vapor in the mixture are 10% and 15%, respectively. Finally, the concentration of CO2 passing through the molecular sieve bed is detected by the flue gas analyzer (Testo 350) and the data is processed to obtain the adsorption capacity and breakthrough curve of 13X molecular sieve to CO2 under the test conditions. In the control group, dry CO2 gas is used as adsorbent and tested by the same method. In order to further explore the effect of water vapor on 13X molecular sieve adsorption of CO2, the molecular sieve is adsorbed with water vapor for 10 min and 60 min, respectively, and then the CO2 dry gas adsorption test is carried out. The pretreatment temperature is set at 150 °C for the following two reasons,
The purpose of this paper is to explore the influence of temperature on adsorption capacity and estimate the energy consumption of CO2 capture using 13X molecular sieve at different temperatures. This study will guide the following pilot test, which will be established based on the existing low-temperature adsorption platform, and the pretreatment temperature of the adsorbent in the existing facilities is 150 °C. Although complete degassing of 13X could not be achieved at this temperature, and there may be some organic compounds that are difficult to desorbed, the pretreatment temperature of the penetration test was set at 150 °C to be closer to the actual application conditions.
3 Results and discussion
3.1 CO2 breakthrough experiments
In this study, 3A, 4A, 5A, 13X molecular sieve and activated carbon, which are commonly used in industry, are selected to verify the adsorption capacity by CO2 through breakthrough tests. Figure 2a-e show the breakthrough curve obtained with an inlet CO2 concentration of 9.86 vol% for all the tested adsorption temperatures.
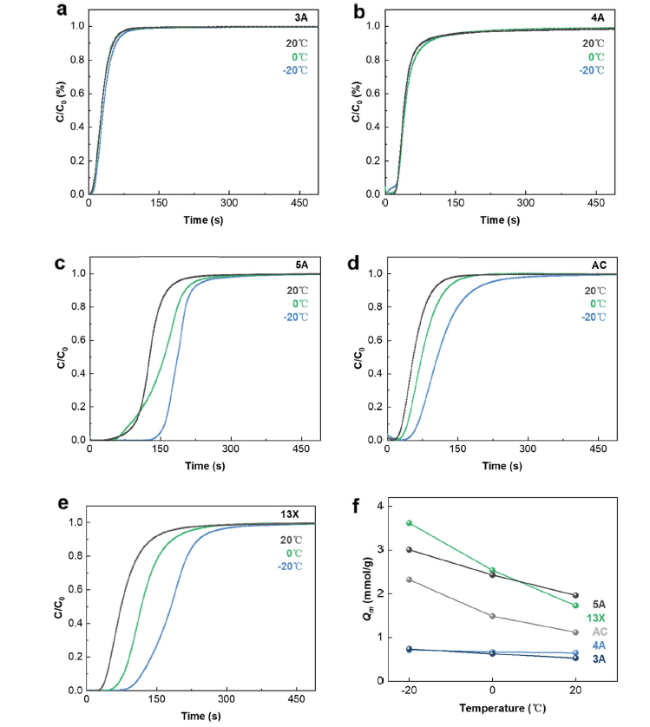
Fig. 2 The breakthrough curves of (a) 3A, (b) 4A, (c) 5A molecular sieve, (d) activated carbon and (e) 13X molecular sieve adsorbing CO2 in dry gas at different temperatures. (f) Maximum adsorption capacity of different adsorbents for CO2 at different temperatures |
The adsorption capacity of the above adsorbents for CO2 at the test temperature is shown in Fig. 2f. As shown in Fig. 2, 5A and 13X molecular sieves have much higher CO2 adsorption capacity than 3A and 4A molecular sieves. For all adsorbents, the adsorption capacity increases with decreasing temperature. At ambient temperature, 5A molecular sieve shows the best performance of CO2 adsorption. However, the adsorption capacity of 13X exceeds 5A molecular sieve at temperatures below 0 °C since the temperature has a much more significant impact on the adsorption performance of 13X molecular sieve. This makes 13X molecular sieve a favorable choice for CO2 removal through temperature swing adsorption (TSA) at low temperatures. Compared to other adsorbents, 13X molecular sieve has larger pore size, lower Si/Al ratio and stronger polarity. The pore size of 13X is around 8-10 Å, that is larger than 5A (around 5 Å), 4A (around 4 Å), 3A (around 4 Å). Although the dipole moment of CO2 molecule is zero, it has strong interaction with cations of molecular sieve because it contains strong polar quadrupole moment [20]. Therefore, 13X with strong polarity has better adsorption performance for CO2.
3.2 The effect of temperature
The breakthrough curve of 13X molecular sieve adsorbing CO2 in dry gas at different temperatures is shown in Fig. 3a. The results demonstrate that the adsorption capacity of 13X molecular sieve is clearly negatively affected by the operating temperature increase (from − 80 °C to 80 °C). The adsorption capacities of 13X molecular sieve as shown in Fig. 3b enhances to 11.8 times, which is from 0.42 mmol/g at 80 °C to 5.38 mmol/g at − 80 °C. This may be because the adsorption of carbon dioxide by 13X is thought to be primarily a physical process that emits heat, raising the temperature will inhibit the reaction going forward. Therefore, reducing the adsorption temperature can effectively improve the adsorption capacity of molecular sieve to CO2 and prolong the breakthrough time, which has a good application prospect in engineering. It is worth noting that at 20 °C, the CO2 adsorption capacity of 13X molecular sieve is only 1.79 mmol/g, lower than previous studies [21] that the CO2 adsorption capacity of 13X under the same conditions is about 3.8 mmol/g. This may be because the pretreatment at 150 °C in this study could not achieve complete degassing of the material, so the adsorption capacity is low.
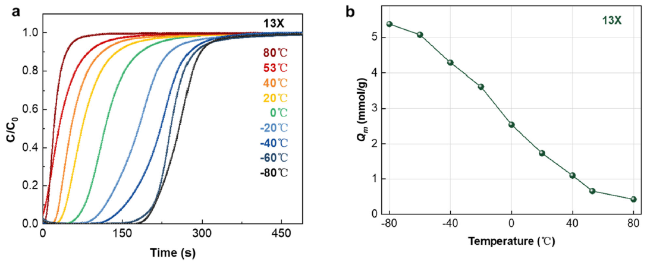
Fig. 3 a The breakthrough curves of 13X molecular sieve adsorbing CO2 in dry gas at different temperatures. bMaximum adsorption capacity of 13X molecular sieve for CO2 at different temperatures |
3.3 The effect of CO2 concentration
In practical application, CO2 content are different according to the types of flue gas. Hence, materials with good adsorption performance over a wide temperature range are expected to be used for separating CO2 from flue gas. The effect of CO2 concentration on the adsorption capacity of 13X is studied and breakthrough curves are shown in Fig. 4a. As shown in Fig. 4b, in the experimental range, the concentration of CO2 has a positive effect on the adsorption capacity of 13X. With the CO2 concentration increases from 1% to 10%, the adsorption capacity increases by 109.4% which is from 1.212 mmol/g to 2.538 mmol/g. It should be noted that the adsorption capacity of 13X can be more than 2.1 mmol/g when the CO2 concentration exceeds 4%. Thus, 13X molecular sieves is considered as a promising carbon capture materials with good adsorption potential in a wide concentration range. As shown in Fig. 3b, under ambient pressure, the specific adsorption capacity increases almost linearly with CO2 concentration below 4%.
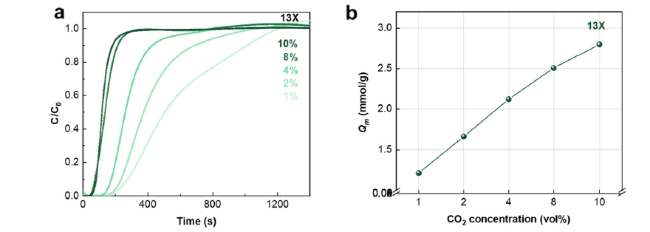
Fig. 4 a The penetration curve of 13X molecular sieve adsorbed CO2 in different concentrations of dry gas at 0 °C under ambient pressure. b The maximum adsorption capacity of 13X molecular sieve for different concentrations of CO2 at 0 °C under ambient pressure |
3.4 The effect of water vapor
Flue gases from coal-fired power plants that have been wet-desulphurized usually contain nearly 15% water vapor (saturated at 53 °C). H2O may compete with CO2 during the adsorption process and even destroy the pore structure of adsorbents, resulting in a decrease in adsorption performance of adsorbents [22]. Hence, to get closer to the actual flue gas emission, this paper explored the influence of 15% H2O on CO2 adsorption of 13X at 53 °C, results are shown in the Fig. 5a.
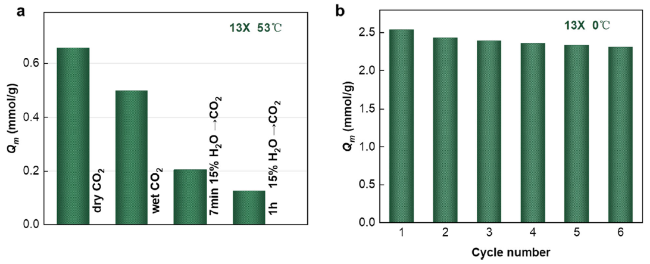
Fig. 5 a Effect of water vapor on the adsorption of CO2. b Maximum adsorption capacity of 13X molecular sieve for CO2 in reusability experiments |
In control group, when dry CO2 (10 vol%, 53 °C) passes through the 13X molecular sieve bed, the adsorption capacity of 13X molecular sieve is 0.656 mmol/g and the breakthrough time is 7 min. When the mixture gas contains 15% H2O (wet CO2), the adsorption capacity for CO2 decreased to 0.499 mmol/g due to competing adsorption. Because H2O has strong polarity, the adsorption of H2O on 13X molecular sieve, a polar adsorbent, is much stronger than CO2. The adsorption capacity of 13X molecular sieve to H2O at 53 °C is 9.289 mmol/g, which is much higher than CO2 [23].
When the CO2 breakthrough experiment is conducted after purging water vapor (15 vol%) through the 13X molecular sieve bed for 7 min, the adsorption capacity for CO2 is 0.230 mmol/g, which decreases 54% compared with purging H2O and CO2 into the bed simultaneously. When the CO2 breakthrough experiment is conducted on 13X molecular sieve which is saturated with water, the adsorption capacity for CO2 is only 19% that of control group. This behavior indicates that although the water vapor hinders the CO2 adsorption process significantly, it does not inactivate the 13X molecular sieve completely.
The water vapor in flue gas can not only weaken the adsorption capacity of CO2, but also has a significant impact on the energy penalty on the regeneration of molecular sieve considering that the desorption heat of H2O is much higher than that of CO2. Therefore, the energy penalty for molecular sieve regeneration can be significantly reduced when the adsorption occurs at subzero temperatures where moisture content in flue gas can be reduced to pretty low levels.
3.5 Reusability of the 13X molecular sieve
The desorption performance and reusability of 13X molecular sieve are two key properties of a good adsorbent material in practical applications. The results of reusing experiments are shown in Fig. 5b. The adsorption capacities in the 2nd ~ 6th runs with reused 13X molecular sieve decreases slightly compared with the fresh 13X molecular sieve, and the extent of the decrease is less than 1.5%. After 6 cycles, the adsorption capacity remains 92% of the first run.
It is worth mentioning that purging the 13X molecular sieve at 20 °C with noble gas can recycle most of the adsorbed CO2. That means in practical applications, this method not only has long lifetime, but also has low economic cost by avoiding heating the adsorbent in desorption process. Therefore, our results suggests that 13X molecular sieve exhibits high chemical stability and reusability for collecting CO2. However, considering that the reusability of 13X molecular sieve for CO2 removal is illustrated by only 6 cycles, increasing cycle number will be more convincing in future studies to examine the reusability.
3.6 Energy penalty analysis
To evaluate the energy penalty for removal of CO2 from flue gas by adsorption at various temperatures, the following assumptions are claimed in this study.
i) Moving bed adsorption-desorption process is adopted. The adsorption occurs in the adsorber and regeneration occurs in the desorber.
ii) Energy penalty includes two parts: (1) heat penalty for molecular sieve regeneration and (2) electricity penalty caused by refrigeration system for cooling the adsorber which only required when adsorption occurs at below ambient temperature (20 °C).
iii) Heat penalty for molecular sieve regeneration can be simply divided into three parts: water desorption heat, CO2 desorption heat and energy for heating the absorbents.
v) Heat recovery of heated molecular sieve can reduce the total energy penalty significantly, but has not been considered in this study.
vi) Flue gas is cooled to the adsorption temperatures and is saturated with H2O at corresponding temperatures. Both CO2 and H2O in flue gas are completely adsorbed.
vii) For adsorption at below ambient temperatures, two-stage cooling process is adopted for the adsorber. In the upper stage of adsorber, the heat is removed by cooling water; in the lower stage of adsorber, the heat is removed by refrigeration system.
viii) Coefficient of Performance (COP) of commercial refrigerator is considered at each cooling temperature.
ix) Electricity penalty is converted to heat penalty by a coefficient of 40%.
The parameters in the following equations were calculated use the data in Table 1. The desorption energy consumption calculation formula is shown in Eq. 1.
$ {\displaystyle \begin{array}{c}\Delta {E}_1={\Delta E}_{CO2}+{\Delta E}_{H2O}+{\Delta E}_{13X}\\ {}=\left(\mathrm{n}\left({CO}_2\right)\times {\Delta H}_{CO2}\right)+\left(\mathrm{n}\left({H}_2O\right)\times {\Delta H}_{H2O}\right)+\left(\mathrm{m}(13X)\times {C}_{p13X}\times \Delta T\right)\\ {}\varDelta T=120{}^{\circ}C-T\end{array}} $
Table 1 Adsorption and desorption parameters |
| Parameters | Symbol | unit | Value |
|---|---|---|---|
| n (CO2)/tCO2 | / | kmol/ton | 22.72 |
| Desorption temperature [26] | Tre | °C | 120 |
| Solid specific heat of 13X | Cp13X | kJ/(kg·°C) | 0.95 |
| Specific heat of flu gas | Cp flu gas | kJ/(kg·°C) | 1.37 |
| Density of flu gas | ρ flu gas | kg/m3 | 1.34 |
| Heat of adsorption of CO2 [22] | ΔHCO2 | kJ/mol | 30.73 |
| Heat of adsorption of H2O [22] | ΔHH2O | kJ/mol | 53.29 |
The refrigeration energy consumption calculation formula is shown in Eq. 2.
$ {\displaystyle \begin{array}{c}\Delta Q={\Delta Q}_{CO2}+{\Delta Q}_{gas}+{\Delta \mathrm{Q}}_{13X}\\ {}=\left(\mathrm{n}\left({CO}_2\right)\times {\Delta H}_{CO2}\times \left(1-\frac{Q_{m1}}{Q_{m0}}\right)\right)+\left(\mathrm{m}(gas)\times {C}_{p13X}\times \varDelta T\right)+\left(\mathrm{m}(13X)\times {C}_{p13X}\times \Delta T\right)\\ {}\varDelta T=T-20{}^{\circ}C\end{array}} $
Refrigeration will consume electric energy, and electricity is converted from heat energy (conversion efficiency is 40%). The calculation method of heat energy consumption corresponding to low-temperature adsorption refrigeration is shown in Eq. 3. The thermal energy required for carbon dioxide separation by adsorption is calculated as shown in Eq. 4.
$ \Delta {E}_2=\frac{\varDelta Q}{COP\times 0.4} $
$ \Delta \mathrm{E}={\Delta E}_1+{\Delta E}_2 $
The calculation results of thermal energy consumption for carbon dioxide separation by adsorption method at different adsorption temperatures are shown in Table 2. The results show that the energy consumption at 0 °C is the lowest and most economical. When the adsorption temperature increases above 0 °C, thermal energy consumption of CO2 separation by adsorption increases greatly. The possible explanation is that the higher water vapor content in flue gas, the lower adsorption capacity of molecular sieve at high temperature. Water vapor will not only reduce the adsorption capacity of 13X for CO2, but also increase the heat consumption during the desorption. The decrease of adsorption capacity of molecular sieve will lead to the increase of the amount of molecular sieve, and then increase the sensible heat of the molecular sieve during the desorption process. The adsorption amount increases significantly below 0 °C, but the refrigeration needs a lot of energy, as a result the total energy consumption is higher than 0 °C.
Table 2 Overall energy penalty analysis of removing 1 ton CO2 from flue gas |
| Temperature | °C | −80 | −60 | −40 | −20 | 0 | 20 | 40 | 60 | 80 |
|---|---|---|---|---|---|---|---|---|---|---|
| H2O Content | v% | 5 × 10⁻⁵ | 0.001 | 0.01 | 0.1 | 0.6 | 2.3 | 7.3 | 19.7 | 46.8 |
| CO2 Content | v% | 10 | 10 | 10 | 10 | 10 | 10 | 10 | 10 | 10 |
| Adsorption data | ||||||||||
| Adsorption capacity for CO2 | Qm mmol/g | 5.38 | 5.07 | 4.29 | 3.62 | 2.51 | 1.67 | 0.97 | 0.50 | 0.11 |
| Adsorbed CO2 | mCO2 kg | 1000 | 1000 | 1000 | 1000 | 1000 | 1000 | 1000 | 1000 | 1000 |
| Adsorbed H2O | mH2O kg | 0.00 | 0.04 | 0.4 | 4 | 25 | 94 | 299 | 806 | 1915 |
| Adsorbent mass | m13X ton | 4.23 | 4.48 | 5.30 | 6.28 | 9.04 | 13.6 | 23.4 | 45.5 | 212 |
| Desorption heat per mass of CO2 | ||||||||||
| CO2 adsorption heat | ΔECO2 GJ/ton | 0.70 | 0.70 | 0.70 | 0.70 | 0.70 | 0.70 | 0.70 | 0.70 | 0.70 |
| Heating molecular sieve | ΔE13X GJ/ton | 0.80 | 0.77 | 0.81 | 0.84 | 1.03 | 1.29 | 1.78 | 2.89 | 8.07 |
| H2O adsorption heat | ΔEH2O GJ/ton | 0.00 | 0.00 | 0.00 | 0.00 | 0.07 | 0.28 | 0.90 | 2.39 | 5.67 |
| Heat penalty | ΔE1 GJ/ton | 1.50 | 1.46 | 1.51 | 1.54 | 1.80 | 2.27 | 3.38 | 5.98. | 14.4 |
| Refrigeration energy per mass of CO2 | ||||||||||
| CO2 adsorption heat in the lower stage | ΔQCO2 GJ/ton | 0.48 | 0.47 | 0.43 | 0.38 | 0.23 | / | / | / | / |
| Molecular sieve cooling | ΔQ13X GJ/ton | 0.40 | 0.34 | 0.30 | 0.24 | 0.17 | / | / | / | / |
| Flue gas cooling | ΔQgas GJ/ton | 0.73 | 0.59 | 0.44 | 0.29 | 0.15 | / | / | / | / |
| Total cooling load | ΔQ GJ/ton | 1.61 | 1.39 | 1.17 | 0.91 | 0.55 | / | / | / | / |
| Equivalent heat penalty | ΔE2 GJ/ton | 11.94 | 4.89 | 1.96 | 0.71 | 0.21 | / | / | / | / |
| Total energy penalty of CO2 capture | ||||||||||
| In total | ΔE GJ/ton | 13.4 | 6.35 | 3.47 | 2.25 | 2.01 | 2.27 | 3.38 | 5.98 | 14.4 |
4 Conclusion
In this study, the adsorption capacity of common adsorbents as conducted at test temperature (− 20 °C, 0 °C, 20 °C) is 13X > 5A > active carbon >4A > 3A, thus showing a beneficial effect of the large pore sizes and polarity on the adsorption capacity. 13X molecular sieve is used as adsorbent to study the effects of temperature, CO2 concentration and water vapor. Decreasing temperature has positive effect on the adsorption of 13X molecular sieve. The adsorption capacity under − 80 °C is the highest, which is 5.380 mmol/g, nearly 10 times higher than that under 80 °C. On the other hand, increase of CO2 concentration has positive effect on the adsorption of CO2 on the 13X molecular sieve, too. When the concentration of CO2 increases to 10 times (from 1% to 10%), the adsorption capacity increases from 1.212 mmol/g to 2.550 mmol/g, an increase of about 110.4%. Whereas water vapor has negative effect. When the mixture gas contains 15% H2O, the adsorption capacity of 13X molecular sieve for CO2 decreases significantly compared with the control group, from 0.656 mmol/g to 0.499 mmol/g. The adsorption and desorption cycling tests indicate that 13X molecular sieve has high chemical stability and reusability for the removal of CO2 from mixture gas.
Nomenclature
T Temperature (°C).
Tre Desorption temperature (°C).
Cp13X Solid specific heat of 13X (kg·°C).
Cp flu gas Specific heat of flu gas kJ/ (kg·°C).
ρ flu gas Density of flu gas (kg/m3).
ΔHCO2 Heat of adsorption of CO2 (kJ/mol).
ΔHH2O Heat of adsorption of H2O (kJ/mol).
ΔECO2 CO2 adsorption heat (GJ/ton).
ΔE13X Heating molecular sieve (GJ/ton).
ΔEH2O H2O adsorption heat (GJ/ton).
ΔE1 Heat penalty (GJ/ton).
ΔE2 Equivalent heat penalty (GJ/ton).
ΔE Total heat penalty (GJ/ton).
Qm Adsorption capacity for CO2 (mmol/g).
mCO2 Adsorbed CO2 (kg).
mH2O Adsorbed H2O (kg).
m13X Adsorbent mass (ton).
ΔQ13X Molecular sieve cooling (GJ/ton).
ΔQgas Flue gas cooling (GJ/ton).
ΔQCO2 CO2 adsorption heat in the lower stage (GJ/ton).
ΔQ Total cooling load (GJ/ton).
C Concentration of carbon dioxide after adsorption (%).
C0 Concentration of carbon dioxide before adsorption (%).
Abbreviations
GHG:Greenhouse gas;CO2 :Carbon dioxide;COP:Coefficient of Performance
Authors’ Contributions
S.W. organized this study; Y.W., Y.K. contributed significantly on the experiment design and test. S.G. L.L., H.N., P.X. and B.H. guide the experiments. S.W. wrote the manuscript. All authors discussed and commented on the manuscript. The author(s) read and approved the final manuscript.
Acknowledgements
The authors appreciate the support from the China Huaneng Group (Grant Nos. HNKJ21-H65).
Funding
The authors appreciate the support from the China Huaneng Group (Grant Nos. HNKJ21-H65).
Availability of data and materials
The datasets used and/or analyzed during the current study are available from the corresponding author on reasonable request.
Declarations
Ethics approval and consent to participate
Not applicable.
Consent for publication
Not applicable.
Competing interests
The authors declare that they have no known competing financial interests or personal relationships that could have appeared to influence the work reported in this paper.
Publisher’s Note
Springer Nature remains neutral with regard to jurisdictional claims in published maps and institutional affiliations.
