
1 Introduction
Reducing carbon dioxide (CO2) emissions is the primary goal towards the transition to an environmentally friendly future that does not depend on fossil fuels. Out of the potential sources that can replace fossils, ammonia is one of the most attractive candidates that has drawn considerable attention, leading to many studies that analyze the molecule as a promising free-carbon energy carrier [1,2]. The role of ammonia as a carbon-free fuel and its potential as a source to leverage excess energy from renewable energy has encouraged numerous studies in engines and gas turbines [3,4]. These studies have complemented essential combustion analyses to determine flame propagation and ignition delay time in pure and blended ammonia mixtures.
The combustion characteristics of ammonia (NH3) when it is injected directly as pure ammonia into the combustion system differs from standard hydrocarbon fuels: the higher ignition delay time, higher heat of vaporization, higher minimum ignition energy, low burning velocity, higher auto-ignition temperature, lower heating value, restricted flammability range, low radiation intensity, lower adiabatic flame temperature, and slower chemical conversion rate, all are features that make ammonia a very distinctive fuel [5]. Therefore, a better understanding of ammonia combustion is essential to overcome the limitation of knowledge that bound the behavior of the molecule at various scales.
One of the detriments of ammonia combustion is the production of nitrogen oxides (NOX). Even though ammonia is carbon-free and can be produced through renewable methods, the combustion products contain NOX, blend composition, residence time, equivalence ratio, and initial conditions [2,6,7,8]. The term NOX refers to all nitrogen oxides that form from the combustion process, being nitric oxide (NO), nitrogen dioxide (NO2), and nitrous oxide (N2O) typically produced in combustion systems. When ammonia is employed, the dominant component of the emitted NOX is NO. Similarly, NO2 is the result of NO oxidation processes, being an emission that contributes to acid rain formation [9]. Further, N2O is considered a very potent greenhouse gas with up to 300 times the Global Warming Potential of carbon dioxide (CO2) [9,10]. The formation of nitrogen oxides can be governed by several combustion mechanisms. Ammonia/hydrogen combustion mechanisms have two primary channels. The first includes the fixation process of molecular nitrogen contained in the combustion air (thermal NOx); the other process involves the oxidization of organic nitrogen that is bounded chemically in the fuel (fuel NOx). Figure 1 simply illustrates a layout of the most significant sources of nitrogen oxides in the combustion process.
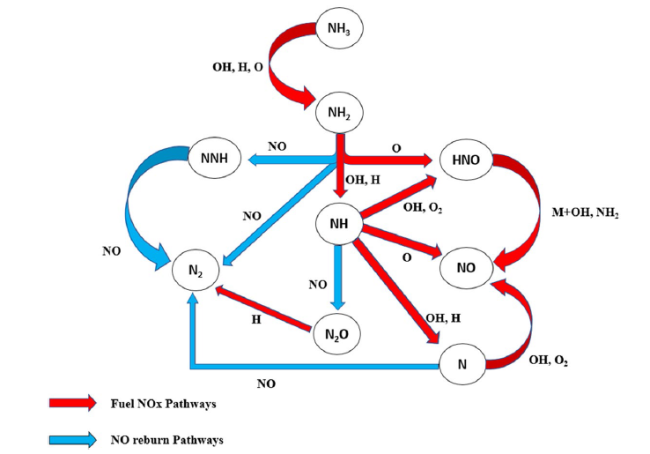
Fig. 1 Reaction pathway diagram illustrating the significant formation/Reburn steps of NO |
Much research has been conducted to improve or to find a better understanding of the concept of NOX formation mechanisms in the combustion of ammonia to develop unique strategies that enable controlling such an emission [11,12,13,14,15,16]. Recently, fuel NOX productions from ammonia have been improved with more accurate results for more complex designing applications [17,18,19,20], investigate the formation and the reduction of NOX by developing a unique NH3 model that covers a wide range of experimental conditions. An oxidation mechanism has been published by [17] which used Shock Tube experiments as a reference. They optimised their work with nine different models to highlight the discrepancies between ammonia kinetic models. The laminar flame speed has also been investigated in vast research [21] used a cylinder combustion chamber to undertake some measurements related to laminar burning velocity. They used ammonia-air blends under elevated pressure. In this study, the data has been compared with five kinetic mechanisms that were obtained from the literature and that denoted the discrepancies between models and the lack of agreement between the nitrogen-based reactions occurring with these blends. Glarborg et al. [22] established a model that offers reliable diagnostic for the creation and destruction of NO under a wide range of conditions. Their selected model can predict and deliver data for a great variety of industrial processes. The model of [23] was utilized to study the reaction structure zone and reaction pathways of NO and NO2 in non-premixed flames. This work found a high level of NO concentration in the high-temperature zone, particularly at stoichiometry. Also, the concentration of NO2 dominated under lean conditions rather than under stoichiometry, where it was found that the level of NO2 is quite small. The study indicated that the most influential reaction for NO2 production is NO + HO2 = NO2 + H, hence reflecting the reason behind the low level of NO2 at high temperatures. Klippenstein et al. [24] have been conducting their simulations at elevated pressure on the production of prompt NO for premixed flames. The study compared the modeling data with available experimental results and found that high pressure significantly impacts the prompt NO mechanism. Another study has been carried out by [25] to investigate the gas characteristics resulting from a premixed laminar blend of ammonia/air with various equivalence ratios and elevated pressure experimentally and numerically. The study found that both equivalence ratio and pressure affect NO mole fraction.
In conclusion, the complete mechanism for oxidization of intermediates to NOX is narrow and not fully understood. Due to the lack of information from experimental work, there are still discrepancies in kinetic model predictions, which include uncertainties effect on the thermochemistry and the kinetic rate data. Even though the effort of several researchers by developing NH3-NOX kinetic model, a reliable model is not developed yet. Therefore, the present work focuses on studying the concentration of NO and N2O from the combustion of NH3/H2 at 85/15 VOL% at various thermal powers and Reynolds numbers using experimental and numerical tools. This particular blend is unique, as it can potentially enable the use of some doping whilst ensuring reduced ammonia cracking to recover the doping agent (hydrogen). The work is done using a bespoke combustor, whilst the numerical analyses are conducted by employing seven chemical kinetic mechanisms.
2 Methodology
2.1 Experimental work
A burner with a tangential swirl and a geometric swirl number of Sg = 1.05 was used in this work at different Re and thermal powers, as illustrated in Fig. 2. A network of Bronkhorst mass flow controllers was utilized to feed the system with flows within 15—95% of the full capabilities with an accuracy of ± 0.5% Rd. The unit has been fed using a blended fuel of ammonia and hydrogen, as mentioned in Table 1. The ammonia and air were introduced via a mixing chamber, while hydrogen was fed through 6 holes with an equal slot. The holes are angled at 45◦ and positioned 4 cm below the burner exit. When the hydrogen is injected, it will go directly into the swirl for premixing with ammonia and air. A CH4 continuous pilot flame was used for ignition and to ignite the flame and kept on to avoid flame extinctions during instability. Along with that, the pilot flame is located above the sampling point to avoid interference with the emissions data. Different conditions were carried out to assess and determine the influence of ammonia concentration on NOX formation at a constant equivalence ratio.
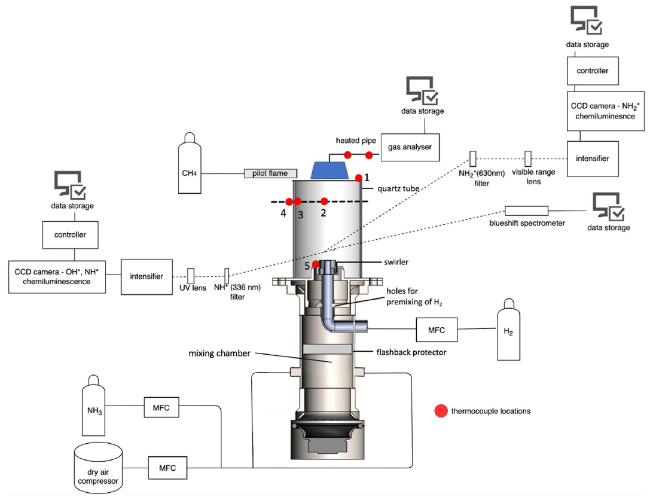
Fig. 2 Tangential burner unit with measuring devices and control systems |
Table 1 Experimental measurements |
| Parameter | Value | Parameter | Value |
|---|---|---|---|
| Blends NH3/H2 (vol %) | 85/15 | Inlet Temperature | 288 K |
| Thermal Power | 10 kW, 15 kW and 20 kW | Inlet Pressure | 0.11 MPa |
| Reynolds No | 20,000, 30,000 and 40,000 | Outlet Pressure | 0.10 MPa |
| Equivalence Ratio (Φ) | 0.65 | Swirl | 1.05 |
All the experiments reported here were carried out at atmospheric pressure (~ 1.1 bar) and temperature (~ 288 K) conditions. A pair of LaVision intensified CCD Cameras was employed to examine chemiluminescence traces of several species. The devices were activated simultaneously at 10 Hz and with a gain of 90%. Several Edmond filters were employed for different species, namely, OH* (309 nm) [26], NH* (336 nm) [26,27,28], and NH2* (630 nm) [26,27,28,29,30]. Five hundred frames per flame have been obtained by using Lavision Davis V10. The frames were post-processed employing a bespoke MatLab script [31], which was designed to undertake Abel Deconvolution after obtaining 3 × 3-pixel median filters and temporary averaging of the 500 images. Five thermocouples have been employed for determining the temperature at five certain points, as illustrated in Fig. 3. The thermocouples with 3 mm diameter were k-type and used in locations 1,4, and 5, while the other thermocouples, 5.60 mm and 10.23 mm diameters were Ceramic shielded R type, and have positioned in locations 3 and 4, respectively. Location 2 was chosen to monitor the flame temperature at the centerline of the flame at 3.9 cm from the quartz exit, while locations 3 and 4 were selected at the same height to monitor the temperature difference at the liner, thus calculating estimated heat loss. Location 1 and 5 were chosen to monitor temperature at the quartz exit liner and burner nozzle wall, respectively. The thermocouples were directly plugged into a RS data logger and linked to a computer. The calibration process was done previously for the thermocouples, which showed an average error of 3%. The thermocouples measurements have been corrected, taking into consideration the surrounding convective and radiative heat transfer of the thermocouple by implementing Eq. (1), [32].
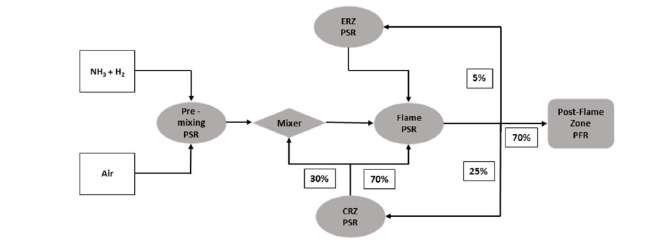
Fig. 3 Chemical reactor network (CRN). CRZ: Central Recirculation Zone; ERZ: External Recirculation Zone |
$T_g=T_{tc}+\varepsilon_{tc}\sigma\left(T_{tc}^4-T_w^4\right)\frac d{kNu}$
where Tg is the gas temperature; Ttc is the thermocouple bead temperature; Tw is the characteristic radiant surrounding temperature (wall temperature); K is the gas thermal conductivity; εtc is the emissivity of the thermocouple and Nu is the Nusselt number.
A bespoke Emerson CT5100 quantum Cascade laser analyzer was used to measure several species of interest produced from the combustion process, such as NO, N2O, NO2, NH3, H2O and O2. the measurement was undertaken at a frequency of 1 Hz, linearity of 0.999, ± 1% repeatability and 190 °C of sampling temperature. The dilution process was carried out via adding N2 within the sample with ± 10% repeatability, which was conducted when the wet reading crossed the range of the analyzer detection. A period of 120 s was allocated to do the recording of emission data for each points and to calculate the average for each condition. The flame stability was monitored by using a webcam type Logitech C270, which was installed 5 m away from the burner.
Finally, A UV/visible-capable optical fiber head (Stellernet Inc DLENS with F600 fiber optic cable) was installed 3 cm above the burner’s exit and 10 cm away from its central axis. The other end of the optical fiber was connected to a UV/visible-capable spectrometer (Stellernet Inc BLUE-Wave) featuring a 100-mm focal length and a 25-µm wide entry slit. The spectrometer was equipped with a 600-grooves/mm grating and a Si-CCD detector (Sony ILX511b) featuring 2048 effective pixels of size 14 × 200 µm2, yielding a spectral resolution of 0.5 nm. The detector’s exposure time was set to 1 s and 20 scans were averaged to improve the signal-to-noise ratio (SNR). The Y-axis of the spectrometer was calibrated using a standard light source (SL1 Tungsten Halogen). In this study, contributions from different species, or specific spectral ranges, were quantified by integration of the chemiluminescence spectra over some specified wavelength ranges. These ranges are 221-261 nm for NO*, 302-326 nm for OH*, 335-346 nm for NH*, and 622-642 nm for NH2*.
2.2 Chemical kinetic modeling
In the present study, Ansys CHEMKIN-Pro [33] was applied for all numerical simulations to calculate the concentration of NOX emissions. Based on the previous studies [31,34,35,36], a chemical reactor network (CRN) was improved for better predictions of emissions from the combustion zone, as illustrated in Fig. 3. The modeling process of Mixing zones, Flame zones, central recirculation zone (CRZ), and external recirculation zone (ERZ) were imitated and modeled using a perfectly stirred reactor (PSR). Residence times were obtained from results obtained during previous numerical validated campaigns [37], delivering values close to 0.05 s at the central recirculation zone and 0.005 s at the shearing flow, with an estimated recirculation of species derived from the previous experimental campaigns [31,38] as shown in Fig. 3, within the constant volume of the combustion chamber. Although it is emphasized that these numbers are condition dependent (i.e., power, flow, temperature and pressure), their use in previous analyses have delivered acceptable results for the study of various ammonia blends [34]. Thus, they have been also used in this study. As displayed in Fig. 3, The numbers 30% and 70% stand for the volumetric split ratio of the gas supplied to the mixer and flame zone, respectively. While 5%, 25%, and 70% refer to the gas percentages in the external recirculation zone (ERZ), central recirculation zone (CRZ), and post flame zone after the gas crossing the flame zone. Depending on the thermocouple measurements, the approximation of heat loss data has been derived experimentally. The plug flow reactor (PFR) was employed for modeling the post-flame zone with a one-dimensional length of 15 cm, Table 2. The objective of kinetic modelling is to understand the discrepancy between models and identify the most sensitive reactions to the production of NO and N2O.
Table 2 Grid properties adopted in the current work |
| Number of grid points | 2000 |
|---|---|
| Adaptive grid control of solution gradient | 0.02 |
| Adaptive grid control of solution curvature | 0.02 |
| Starting axial position | 0 cm |
2.3 The investigated kinetic models
Seven kinetic reaction mechanisms, published in the past two years including NOx combustion chemistry suited, were selected to compare the numerical data with experimental measurements for the combustion of the NH3-H2 blend. In the following, the kinetic models will be pointed to by a short name representing the first author followed by the year of publication. The kinetic mechanisms are detailed in Table 3 in terms of the number of reactions, the number of species, and the fuel mixture used in each model, as well as the target factors and describe the effects of parameters in the combustion characteristics of each model. The mentioned chemical kinetic mechanisms were selected for sensitivity analysis of reactions and to check the accuracy of the NOX sub-mechanisms that were newly added to their database depending on previous numerical and experimental campaigns and further validation using a chemical reaction network.
Table 3 Chemical kinetic mechanisms used in the present work |
| No | Kinetic model | No. of Reaction | No. of species | Fuel mixture | Optimization parameter | Parameters effect |
|---|---|---|---|---|---|---|
| 1 | A.Bertolino et al. [39] | 264 | 38 | NH3 | LBVs Ignition delay time speciation measurements | Optimization of nitrogen chemistry based on pressure-dependent reactions |
| 2 | B. Mei et al. [40] | 264 | 38 | NH3/NO/N2 | LBVs Markstein length NOx formation | Equivalence ratios |
| 3 | X. Han et al. [41] | 298 | 36 | NH3 NH3/N2O | LBVs speciation measurements | Equivalence ratios N2O mixing ratios |
| 4 | X. Zhang et al. [42] | 263 | 38 | NH3 NH3/H2 | NOx formation | Lean and rich conditions Hydrogen-enriched in fuel |
| 5 | A. Stagni et al. [43] | 203 | 31 | NH3 | LBVs Ignition delay time speciation measurements | Optimization of ammonia oxidation mechanism in a full range of operating conditions |
| 6 | X. Han et al. (2019) [44] | 130 | 20 | NH3 + syngas | LBVs Ignition delay time NOx measurements | Equivalence ratios |
| 7 | S. de Persis et al. [45] | 647 | 103 | CH4 | LBVs NOx measurements | Equivalence ratios Elevated pressure |
Bertolino et al. [39] adopted a method with a hierarchical and systematic procedure to improve the nominal model of [43] by considering all the target datasets and uncertain parameters. a cumulative impact function (CIF) and Evolutionary Algorithm have been introduced to select the reactions with major impact and to optimize the solution. Their methodology has been supported by using a database of 635 experimental data points that cover ignition delay times, speciation, and laminar burning velocity of ammonia combustion.
Mei et al. [40] introduced a kinetic model for combustion of NH3/NO at atmospheric conditions (P = 1 atm and T = 298 K) with various equivalence ratios. the model has been improved based on the model reported from [18]. the rate constants of key chemical reactions have been updated, especially those which are directly or indirectly implicated in the interactivity between NH3 and NO such as NH2 + NO = NNH + OH, NNH = N2 + H, NNH + NO = N2 + HNO and NH2 + NO = N2 + H2O. The kinetic model can offer accurate targets of sensitivity validation for the kinetics of NH3 and NO interaction.
Han et al. [41] investigated the effect of N2O enrichment in fuel on the combustion characteristics of NH3. The impact of rate constants for the most sensitive reactions in ammonia self-ignition and flame propagation of NH3 + O2 and H2 + N2O blends were considered in the study. Their detailed model has been improved based on [46,47]. The thermodynamic data of nitrogen-based species have been selected from the database of Burcat and Rusicc [48]. while the rate constant of the kinetic reaction N2 + O = NO + N was considered based on the experimental and kinetic modeling investigation of NO formation in CH4 + O2 + N2 premixed flames [48]. Their model has been validated experimentally using the heat flux method at 1 atm and 298 K and the entire range of equivalence ratio.
Zhang et al. [42] constructed a kinetic model which deals with NH3 and NH3-H2 combustion. The model was established based on [18]. The kinetic model has been revisited for the reactions related to NH3 sub-mechanism. The thermodynamic data of nitrogen-related radicals, especially NH, NH2, NNH, and N2H2, were updated based on the work published by [49]. Also, the rate kinetics of the most important reactions, particularly those related to NOX formation, have been evaluated based on some experimental [50,51] and theoretical [43,49,52,53,54,55] studies. Along with that, the numerical data from model prediction have been validated with JSR experimental measurements of oxidation on NH3-H2 blended flames at atmospheric pressure, low -moderate temperatures (800-1280 K), different H2 contents, 0-70VOL% in the fuel, and various equivalence ratios.
Stagni et al. [43] developed a kinetic model that deals with ammonia oxidation in a wide range based on various studies, including NOX sub-mechanism from [64], updating the HONO/HNO2 chemistry depending on the work reported by [56], and updating the thermodynamic database of all species depending on [48]. Also, the NH2OH chemistry and dissociation reaction were considered, particularly for the reactions involving NH and NH2 radicals from work published by [57]. The capability of the kinetic model has been tested in various configuration systems (Shock tube, Rapid compression machine, Flow reactor, Laminar flame speed, and burner-stabilized flame) and assessed in a wide range of operation conditions.
Han et al. [44] reported a kinetic model that estimates NOX emissions characteristics for ammonia oxidation. The study of Varga et al. [58] was the starting point for developing their kinetic model. The study included updating the database of constant rate parameters, collision factors, and pressure-dependent coefficients for the most critical reactions in ammonia oxidations, considering the individual investigation option for each reaction and its effect on laminar burning velocity. The role of HONO, HNOH, HON, HNO2, HONO2, and NO3 reactions on the combustion characteristics has also been reported. In terms of validation, the model was tested and compared with several experimental measurements from literature with various operation conditions and equivalence ratios.
De Persis et al. [45] developed a kinetic mechanism for predicting nitrogen oxide formation. The effect of both equivalence ratio and pressure on NO mole fractions has been considered. The NOX sub mechanism has been developed and revised based on the investigation work done by Lamoureux et al. [59]. The contribution of NO major pathways (prompt, thermal, NNH, and N2O) has been reported and compared with the study from [24]. The mechanism has been validated based on experimental measurements of NO mole fraction profile using the LIF method in laminar counterflow configuration system at various equivalence ratios and pressure ranging from 1 -7 atm.
As shown in Table 3, all the mechanisms improved the NH3 sub mechanisms in their database with corresponding thermochemistry data. Most of these models directly describe the combustion of NH3 except de Persis model that deals with CH4 flames, but it already has a NOX formation mechanism in its database and improved to some limits to forecasting acceptable levels of NOX.
The kinetic mechanisms containing nitrogen chemistry in its database would describe the combustion of ammonia. Along with that, the weak performance of these models does not mean the model is not well applicable for the conditions of interest, which it was originally improved for.
3 Results and discussions
In this section, the experimental results are compared with predicted data obtained via detailed kinetic models described in Sect. 2.1. Both experimental and numerical data were carried out in the same conditions of pressure and temperature (NTP). The equivalence ratio for the lean mixture of NH3/H2 fuel was kept constant for all cases (∅ = 0.65).
3.1 Effects of Reynolds number
Constant Reynolds number is one of several essential parameters in investigating the performance of many practical systems, especially power generation and comparison aims between combustion system configurations [60]. To analyze the influence of turbulence factors on the combustion characteristics such as flame and emissions, three values of Reynolds number (20,000, 30,000, and 40,000) will be considered at a fixed equivalence ratio of 0.65. The figures below compare the present NO and N2O measurements with data estimated from kinetic models and for different Reynolds numbers in the range 20,000-40,000 at combustor exhaust. The mole fractions of NO and N2O in Figs. 4 and 5 are presented in units of ppmv. As shown in Fig. 4, the mole fraction of NO increases with the Reynolds number. The NO mole fraction resulting via experiments was close to data obtained by Stagni’s model. Based on the comparison between the present study results and the modelling data from the literature, both Bertolino’s and Stagni’s mechanisms have a closer, reasonable agreement with the experimental data.
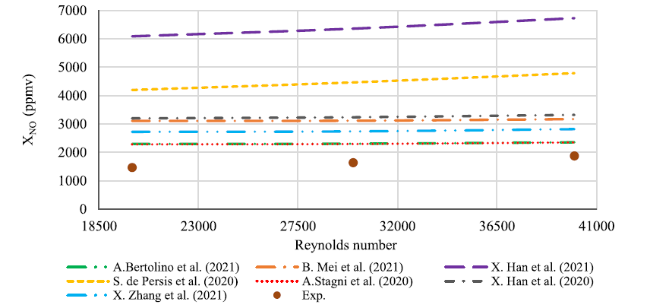
Fig. 4 Comparison between experimental results and numerical concentration profiles of NO when the Reynolds number varies from 20,000 to 40,000 at the exhaust |
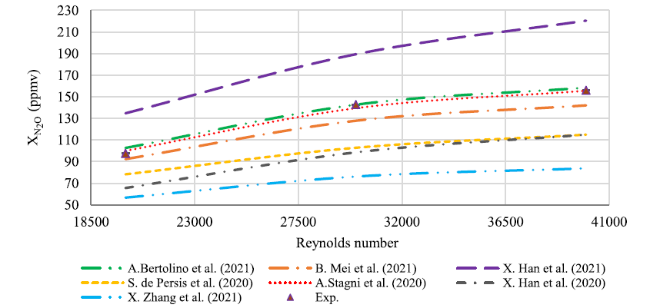
Fig. 5 Comparison between experimental results and numerical concentration profiles of N2O when the Reynolds number varies from 20,000 to 40,000 at the exhaust |
Figure 5 shows the variation of the mole fraction of N2O in ppmv when the Reynolds number increases from 20,000 to 40,000 at zone exhaust. Bertolino's, Stagni's, and Bowen Mei Mechanisms gave better estimation to these experimental results than other models.
Figures 6 and 7 demonstrate the radical spectroscopic spectrum and the chemiluminescence data, respectively, of different radicals of interest at a constant equivalence ratio of 0.65 and under different Reynolds numbers at the flame zone. The chemiluminescence images of OH*, NH*, and NH2* in Fig. 7 were normalized to image dataset max to display radicals distributions in the flame. Table 4 shows the integrated intensities of different radicals from the spectrum shown in Fig. 6. As can be seen, the concentration of NO emissions at the exhaust reported minimum level when the Re = 20,000. The reason behind that is the deterioration of the flame characteristics due to lower reactivity and radical formation at Re = 20,000. This behavior can be seen clearly in Fig. 7, the distribution of radicals expands with increasing Re. The integrated radical intensities of NO*, OH*, NH*, and NH2* in Table 4 shows an increasing trend as Re increased from 20,000 to 40,000 which is also obvious in Fig. 7. It was interesting to notice the increase in radical intensities is much lower when Re increased from 30,000 to 40,000, which reflects into exhaust emissions as well, thereby signifying the importance of these radicals in NH3/H2 flames. In Fig. 7, the flame brush expands with increasing Re, giving an indication of an increase in the radical concentrations. The increase in NH2* radicals with increasing Re is due to OH* radical abundance and its role in the chemical reaction NH3 + OH ↔ H2O + NH2. OH* radicals are also responsible for NH* production through the reaction NH2 + OH ↔ NH + H2O and can be considered the largest source of NH production from NH2. Eventually, NH* radicals are consumed through the chemical reaction NH + NO ↔ N2O + H to form N2O by consuming NO. The considerable increase in N2O when Re = 40,000 can be attributed to increased flame temperature, thus higher heat loss through the quartz liner. This phenomenon will be analyzed further in the latter part of the study.
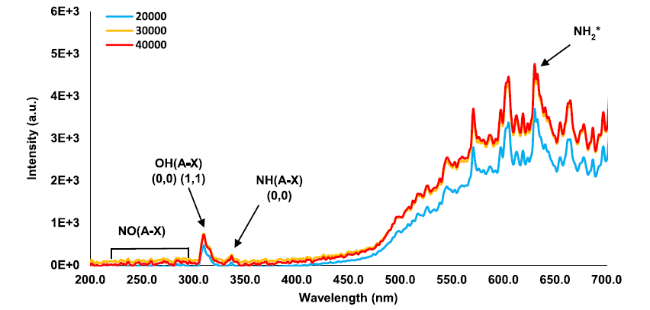
Fig. 6 Chemiluminescence spectrum at Φ = 0.65 and various Reynolds numbers at the flame zone |
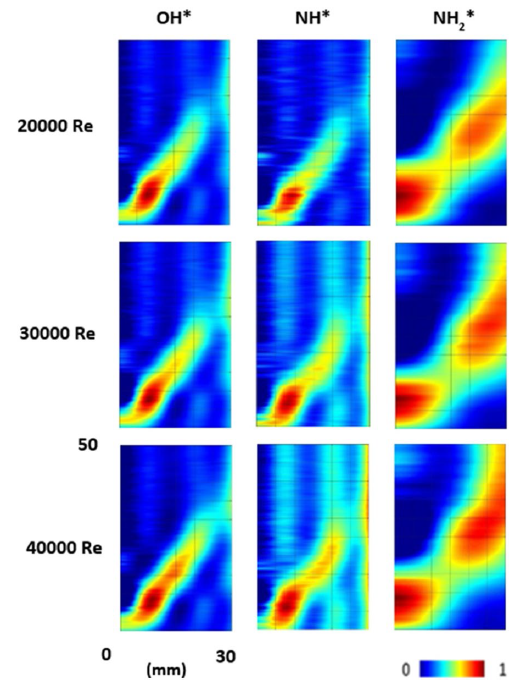
Fig. 7 NH*, NH2*, and OH* chemiluminescence at 85/15 VOL% Of NH3/H2 blend at Φ = 0.65 and various Reynolds numbers at the flame zone. Colormap normalized to image dataset maximum |
Table 4 NO*, OH*, NH* and NH2* values resulted at various Re |
| RADICALS RANGE | Re = 20,000 | Re = 30,000 | Re = 40,000 |
|---|---|---|---|
| NO* (221—261 nm) | 2817 | 4920 | 4941 |
| OH* (302—326 nm) | 10,258 | 13,688 | 14,602 |
| NH* (335—346 nm) | 1552 | 2495 | 2768 |
| NH2* (622—642 nm) | 122,973 | 151,558 | 158,137 |
3.2 Effects of thermal power
Figures 8 and 9 illustrate the variation of NO and N2O concentration in ppmv in terms of thermal power at the exhaust. The figures also include data from seven literature models run under the same operating condition. As can be seen, the mole fractions of NO peaked at 15 kW thermal power. NO mole fraction decreased with the decrease or increase in thermal power from 15 kW. All models predicted similar trends. However, the NO concentration resulting from experiments was close to those predicted by Stagni’s, Betrolino’s, and Zhang’s mechanisms.
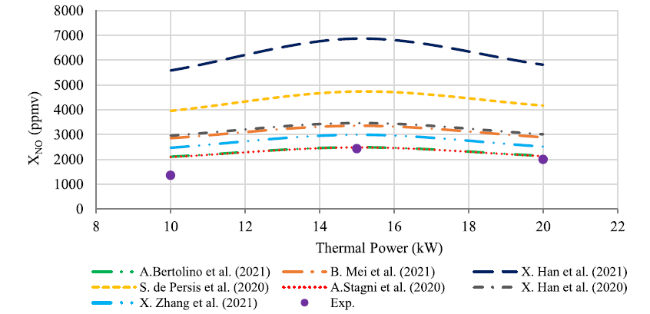
Fig. 8 Comparison between experimental results and numerical concentration profiles of NO when thermal power in rang 10-20kW at the exhaust |
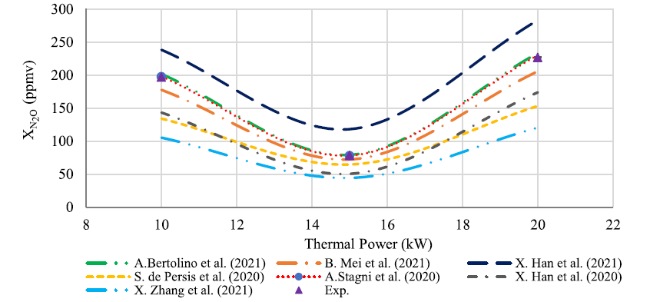
Fig. 9 Comparison between experimental results and numerical concentration profiles of N2O when thermal power in range 10-20kW at the exhaust |
Figure 9 shows the concentration of N2O. The figure illustrates a sharp decay in the concentration of N2O when the thermal power equals 15 kW. As power was increased to 20 kW, the N2O mole fraction increased and nearly gave the same value to that of a thermal power equal to 10 kW. Stagni’s, Betrolino’s, and Bowen Mei’s mechanisms achieved a good agreement with the experimental results of the present study. In contrast, the other mechanisms gave the same trend but with a difference in the concentration of N2O.
The radical spectroscopic spectrum at different thermal power with a constant equivalence ratio of 0.65 at the flame zone is presented in Fig. 10, while Fig. 11 denotes the chemiluminescence imprints of this blend at various powers. Similar to previous discussions, colormaps were normalized to image dataset maximum to show the changes in radicals distributions as thermal power changes. Table 5 provides the integrated intensities of different radicals from Fig. 10. OH*, NH*and NH2* figures show an increase in their concentration when the thermal power increased up to 15 kW then decreased with increasing thermal intensity to reach 20 kW, Table 5. Simultaneously, this can be appeared clearly, especially when the thermal intensity increases from 10 to 15 kW, the flame brush expands due to increasing the OH*, NH*, and NH2* radical concentrations, Fig. 11. The increased production of these radicals at 15 kW reflects into increased NO productions and decreased N2O productions. This is further confirmed by the maximum radical intensity of NO* at 15 kW, Table 5. It is believed that NO production, in this case, is due to the conversion of NH2 to NH through reactions with OH radicals, then combining NH and OH to form HNO, which is known to be the main source of NO formation in most mechanisms. Simultaneously, the chain branching reaction NH2 + NO ↔ NNH + OH and the chain-terminating reaction NH2 + NO ↔ H2O + N2 are known as the key chain reactions for NO consumptions [34].
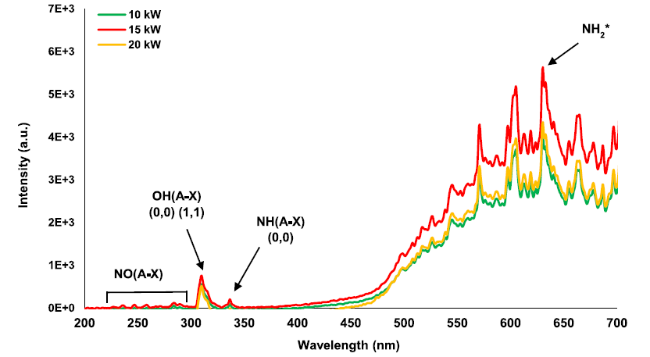
Fig. 10 Chemiluminescence spectrum at Φ = 0.65 and various thermal powers at the flame zone |
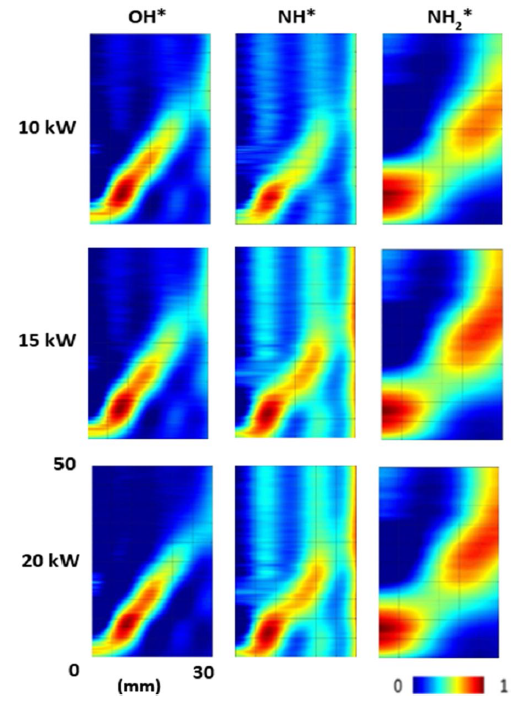
Fig. 11 NH*, NH2*, and OH* chemiluminescence at 85/15 VOL% Of NH3/H2 blend at Φ = 0.65 and various thermal power at the flame zone. Colormap normalized to image dataset maximum |
Table 5 NO*, OH*, NH* and NH2* values resulted at various Re |
| RADICALS RANGE | 10 kW | 15 kW | 20 kW |
|---|---|---|---|
| NO* (221—261 nm) | 3108 | 4720 | 4468 |
| OH* (302—326 nm) | 11,677 | 15,045 | 14,039 |
| NH* (335—346 nm) | 1687 | 2503 | 2405 |
| NH2* (622—642 nm) | 134,210 | 184,198 | 150,000 |
3.3 Sensitivity analyses
As can be seen from the concentration profiles for both NO and N2O in the above figures, Han’s mechanism gave the highest over-prediction for NO and N2O. At the same time, Zhang’s mechanism predicts a low concentration of N2O. Stagni, Betrolino, and Bowen Mei mechanisms are the most accurate models since they predict data near the range of experimental combustion results. Therefore, sensitivity analyses and rate of production for NO and N2O as well as the NOX formation/consumption pathways at the flame zone are presented using Stagni, A.Betrolino, and Bowen Mei’s kinetic models. As the highest exhaust emissions were observed at high thermal power, 20 kW, and high Reynolds number, 40,000, these conditions have been selected for analyzing the sensitivity and rate of production of both NO and N2O species in this part of the study.
3.4 [NO] Sensitivity analysis
NO is one of the most critical ammonia combustion products since it has a dangerous effect on the ecosystem with the production of acid rain and other environmental impacts. To study NO's chemistry and investigate the contribution of NO in the formation of N2O, sensitivity analyses have been considered for two previously explained conditions in this part of the study.
3.4.1 [NO] Sensitivity analysis for 20 kW of thermal power
Figures 12, 13 and 14 depict the sensitivity analysis of NO, rate of production, and NO formation/decomposition pathways, respectively, at the combustion flame zone when thermal power is equal to 20 kW using three kinetic models. As can be seen from the pathway’s diagram, HNO shows a great tendency to form NO at the flame zone and can be considered the primary source of NO production.
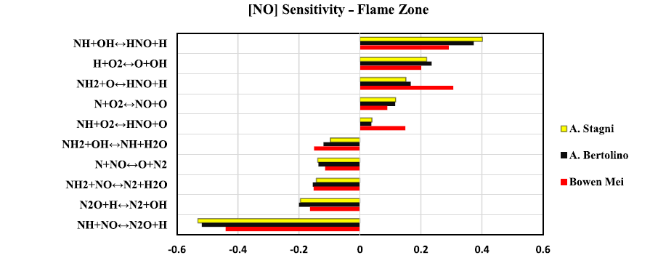
Fig. 12 Sensitivity analysis diagram of NO at the flame zone for 20 kW thermal power |
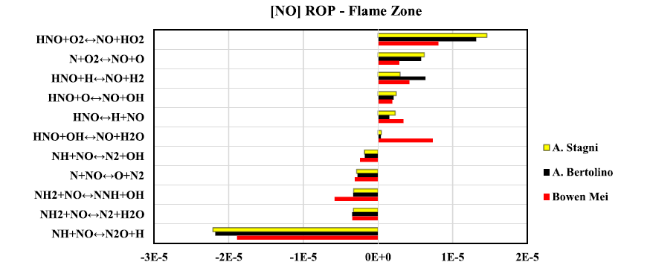
Fig. 13 Rate of production diagram of NO at the flame zone for 20 kW thermal power |
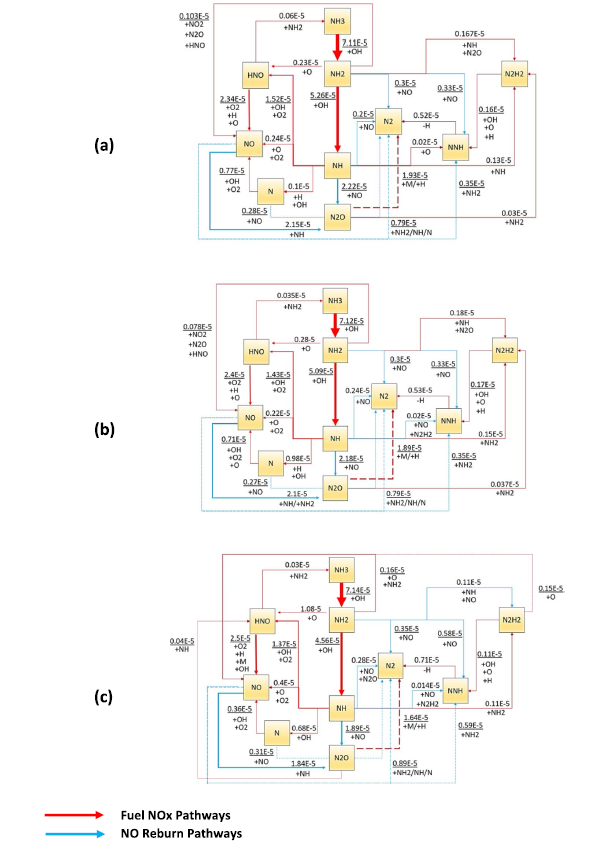
Fig. 14 Chemical reaction pathways show NOX formation/consumption at flame zone when thermal power equal to 20 kW predicted by (a) Stagni, (b) Bertolino, and (c) Mei kinetic models. Lines refer to the reaction path; Numbers stand for the absolute rate of production in ppmv, which has been represented by line thickness for better explanation |
From Fig. 12, all the kinetic models show high positive sensitivity for the reaction NH + OH ↔ HNO + H, and this reaction is considered the most influential reaction in producing HNO species, among other reactions. Also, the high positive sensitivity of the reaction H + O2 ↔ O + OH leads to an increase in the possibility of the formation of HNO through the reactions NH2 + O ↔ HNO + H and NH + OH ↔ HNO + H due to the abundance of O and OH radicals.
As can be seen from Fig. 13, Stagni and Bertolino’s models indicate that the most prominent chemical reactions responsible for NO production from HNO are HNO + O2 ↔ NO + HO2 and HNO + H ↔ NO + H2. At the same time, the Bowen Mei mechanism illustrates that both reactions HNO + O2 ↔ NO + HO2 and HNO + OH ↔ NO + H2O are the most effective in producing NO from HNO. Most importantly, the chemical reaction NH + NO ↔ N2O + H is responsible for consuming the NO and transforming it to N2O by reacting with NH. All three mechanisms indicate that NH + NO ↔ N2O + H is the dominant reaction in consuming NO, among other reactions.
As shown from Fig. 14, the pathway diagrams predicted from all three kinetic models indicate that NH2, NH, and N radicals tend to react with NO to produce N2 but at different concentrations. Also, the substantial contribution of both chemical reactions, NH2 + NO ↔ NNH + OH and NH2 + NO ↔ N2 + H2O for converting NO to NNH and N2, respectively, can be noticed in all three kinetic mechanisms. Along with that, the Bowen Mei mechanism shows a considerable increase in the amount of NO reacting with NH2 to produce NNH through the chemical reaction NH2 + NO ↔ NNH + OH, and with NH2, NH and N by NH2 + NO ↔ N2 + H2O, NH + NO ↔ N2 + OH and N + NO ↔ O + N2, compared to the other kinetic mechanisms considered here which demonstrate lower reacting concentrations of NO to produce NNH and N2.
3.4.2 [NO] Sensitivity analysis when Re = 40,000
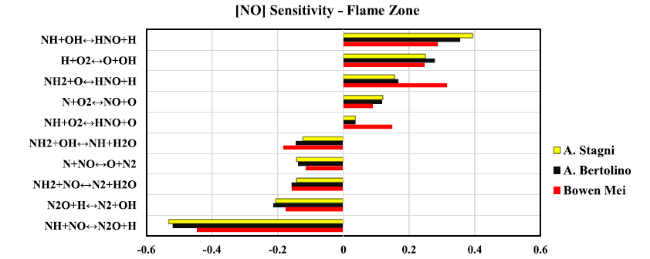
Fig. 15 Sensitivity analysis diagram of NO at flame zone when Reynolds number equal to 40,000 |
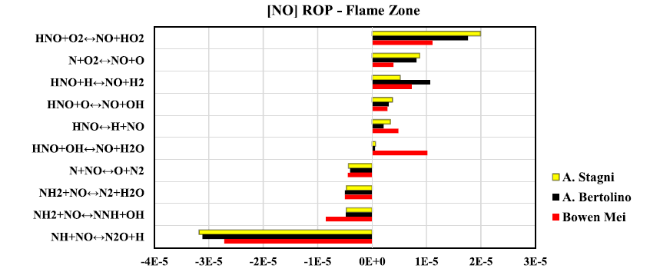
Fig. 16 Rate of production diagram of NO at flame zone when Reynolds number equal to 40,000 |
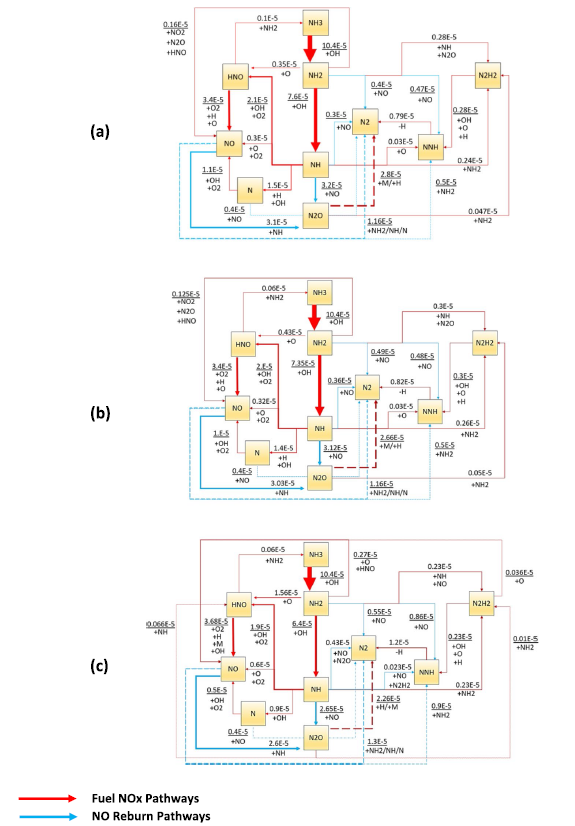
Fig. 17 Chemical reaction pathways presenting NOx formation/ consumption at flame zone, Reynolds number equal to 40000 predicted by (a) Stagni, (b) Bertolino, and (c) Mei kinetic models.: Lines refer to the reaction path; Numbers stand for the absolute rate of production in ppmv, which has been represented by line thickness for better explanation |
As can be seen from the pathway’s diagram N, NH, NH2, and HNO are the species responsible for NO formation at the flame zone. As seen earlier, HNO has a significant effect on the formation of NO and can be considered the dominant source of NO production among other species. In addition, the effect of Reynolds number was considerably noticed as the concentration of NO from HNO increased noticeably compared to NO-pathways from Fig. 14 for Stagni and Bertolino. At the same time, the Bowen Mei mechanism demonstrates a different effect, as the NO concentration is reduced and shows the role of the N2H2 in the formation of NO.
Figure 15 illustrates NO sensitivity analysis at the flame zone when Reynolds number hit 40,000. The sensitivity level of the reaction H + O2 ↔ O + OH is high and gives a positive value to produce O and OH radicals. The abundance of O and OH radicals encourage the reactions NH + OH ↔ HNO + H and NH2 + O ↔ HNO + H in the formation of HNO which is the main source of NO formation as these reactions show high positive sensitivities of HNO formation.
Figure 16 shows NO production rates and illustrates that the dominant chemical reactions for the creation of NO are HNO + O2 ↔ NO + HO2 and N + O2 ↔ NO + O for both Stagni and Bertolino models. However, the Bowen Mei mechanism predicts that NO could be produced due to the reaction of HNO with O2 and OH through the reactions HNO + O2 ↔ NO + HO2, and HNO + OH ↔ NO + H2O, respectively, and can be considered the controlling reactions responsible for NO formation. In addition to that, the chemical reaction NH + NO ↔ N2O + H gives a negative rate of NO production for all three kinetic mechanisms.
As can be noticed from Fig. 17, the pathway’s layout indicates the consumption of NO is dependent on the availability of NH2, NH, and N radicals to react with NO. All three mechanisms give similar trends but with different concentrations since the chemical reactions NH2 + NO ↔ NNH + OH and NH2 + NO ↔ N2 + H2O are responsible for consuming NO to form NNH and N2. Further, the pathway’s diagram clearly shows the effect of Reynolds number on NH3, NH2, and NH compared to the thermal power pathway’s diagram (Fig. 14). It shows an increase in the reactive amount of NH3 with OH to produce NH2, a similar effect that occurs with NH2 and NH for all three models. The Bowen Mei mechanism clearly indicates the role of N2H2 in the formation of NO compared with Stagni and Bertolino, as the reaction is not included in their predicted pathway diagram.
3.5 [N2O] Sensitivity analysis
One of the most important drawbacks of ammonia combustion could be N2O, especially under lean conditions. The gas has a much greater Global Warming Potential than CO2. Hence, it is important to determine its sensitivity analyses, rates of production of various species and to create a pathway’s diagram to examine the role of N2O in the ammonia combustion process in two conditions previously discussed.
3.5.1 [N2O] Sensitivity analysis for 20 kW of thermal power
Figures 18 and 19 show the sensitivity analysis and rate of production of N2O using the three kinetic mechanisms when the thermal power is equal to 20 kW. It has been noticed that the chemical reaction NH + NO ↔ N2O + H has a considerable effect on the formation of N2O. Along with that, NH2 + OH ↔ NH + H2O and H + O2 ↔ O + OH also participate in the creation of N2O. All three mechanisms give nearly the same trend for N2O concentration. In addition, the Bowen Mei mechanism shows that the N2O formation rate is higher than that predicted by Stagni and Bertolino kinetic models. The chemical reaction N2O + H ↔ N2 + OH gives a pessimistic sensitivity prediction for N2O, which can be observed for all three kinetic models. In Fig. 19, the third body reaction N2O(+ M) ↔ N2 + O(+ M) showed a negative production rate for N2O in all three models.
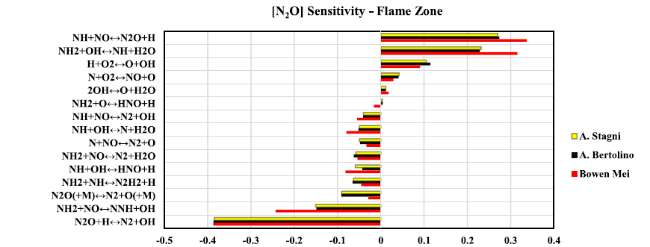
Fig. 18 Sensitivity analysis diagram of N2O at flame zone when thermal power equal to 20 kW |
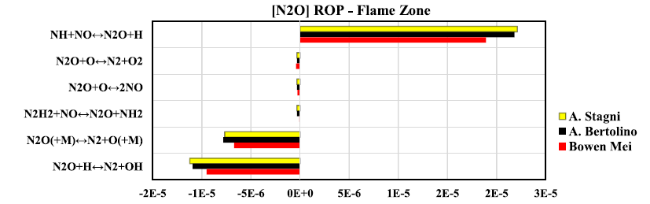
Fig. 19 Rate of production diagram of NO at flame zone when thermal power equal to 20 kW |
The pathways diagram from Fig. 17 indicates that both NH and NO are the major sources for the formation of N2O. NO reacts with NH radicals through the chemical reaction NH + NO ↔ N2O + H to produce N2O. At the same time, Both Stagni and Bertolino’s chemical models predict the consumption path of N2O to N2 via the chemical reactions N2O + H ↔ N2 + OH and the decomposition path of N2O through the chemical reaction N2O + NH2 ↔ N2H2 + NO. In comparison, the Bowen Mei mechanism indicates that N2O + NH ↔ HNO + N2 is also responsible for consuming N2O to produce HNO, and this reaction does not appear in Stagni and Bertolino models. All three models indicate that the reaction N2O + H ↔ N2 + OH is substantial in consuming N2O to N2.
3.5.2 [N2O] Sensitivity analysis when Re = 40,000
Figures 20 and 21 refer to the sensitivity analysis and rate of production of N2O at operational conditions at Re = 40,000. Figure 20 shows that both reactions NH + NO ↔ N2O + H and NH2 + OH ↔ NH + H2O have a positive sensitivity for all three models. Along with that, the Bowen Mei model gives higher predictions to both previous chemical reactions compared with Stagni and Bertolino models. In addition, NH2 + NO ↔ NNH + OH and N2O + H ↔ N2 + OH give negative sensitivity of N2O for all three models, whilst the Bowen Mei mechanism also predicts a high negative sensitivity level of NH2 + NO ↔ NNH + OH in comparison to Stagni and Bertolino kinetic mechanisms.
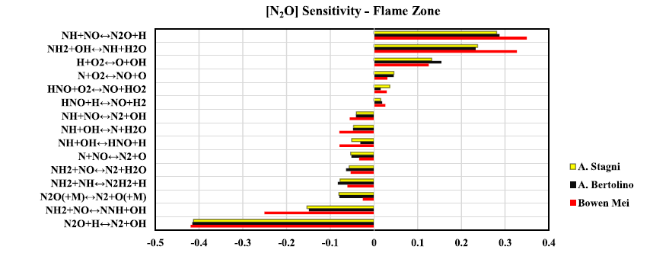
Fig. 20 Sensitivity analysis diagram of N2O at flame zone when Reynolds number equal to 40,000 |
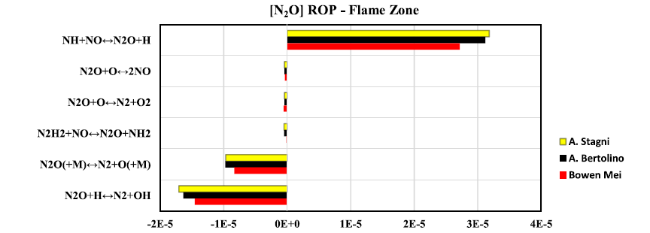
Fig. 21 Rate of production diagram of N2O at flame zone when Reynolds number equal to 40,000 |
Figure 21 indicates that NH + NO ↔ N2O + H is one of the dominant reactions for the formation of the pollutant. Further, the third body reaction N2O(+ M) ↔ N2 + O(+ M) and N2O + H ↔ N2 + OH present negative rates of production that lead to a decrease in the concentration of N2O. Also, all three mechanisms indicate that the chemical reaction N2O + H ↔ N2 + OH is mainly responsible for the consumption of N2O.
As can be seen from Fig. 17, Stagni and Bertolino’s models predict the formation of N2O due to the chemical reaction NH + NO ↔ N2O + H. Stagni and Bertolin models identify small amounts of N2O consumptions via the reaction with N2 and N2H2 with the radicals H and NO, respectively. However, the Bowen Mei mechanism denotes NH radical’s role in producing HNO through the reaction NH + N2O ↔ N2 + HNO along with other reactions mentioned in the other models for the consumption of the species. From an operational condition perspective, the pathways diagram for both cases shows that Reynolds number has an obvious effect in increasing the concentration of N2O compared to thermal power. The Reynolds number effect extends to the consumption side of N2O; all the models demonstrate an increase in the consumption rate of N2O, thus producing N2 and N2H2. Even though there are differences in the final concentrations of N2O, all the kinetic mechanisms gave similar trends.
4 Conclusions
The present work has investigated the concentrations of NO and N2O at 85/15 (%vol) of NH3/H2 blend using both experimental and numerical analyses. Experiments at various Reynolds numbers and thermal powers have been carried out at standard atmospheric conditions (1.1 bar and 288 K). The experimental results have been used to validate the numerical data and check the accuracy of kinetic models adopted in this study. Seven recently published kinetic models for ammonia combustion have been used and showed different predictions. The kinetic mechanisms of Stagni et al. and Bertolino et al. have given the best agreement in the prediction of NO and N2O over various thermal powers and Reynolds numbers. The main conclusions of this study can be summarized as follows.
·Measurements in terms of thermal power: The maximum concentration of NO is when the thermal intensity reaches 15 kW and then decreases for other cases, while the N2O mole fraction reaches a peak when the thermal power is equal to 20 kW, and its concentration decreases to record a minimum value at 15 kW. Along with that, the numerical investigation showed that HNO + O2 ↔ NO + HO2, N + O2 ↔ NO + O, and HNO + H ↔ NO + H2 are the most critical reactions for NO formation at 20 kW. In addition, the chemical reaction NH2 + OH ↔ NH + H2O, H + O2 ↔ O + OH, and NH + NO ↔ N2O + H substantially affect the formation of N2O.
·Measurements in terms of Reynolds number: the NO productions increased gradually when the Reynolds number varied from 20,000 to 40,000 and recorded a maximum value at Re = 40,000. The same behavior was noticed with N2O, as the concentration of N2O reaches the maximum at the maximum Re (40,000). Also, the NH and NO radicals when Re = 40,000 are more than those resulting in other Re values. The reason behind this effect is that NO heavily participates in the formation of N2O. Further, the numerical analyses for Stagni and Bertolino kinetic models depicted that the dominant reactions behind the formation of NO were HNO + O2 ↔ NO + HO2 and N + O2 ↔ NO + O, which differed from those in the Bowen Mei et al. [40] model. Also, the Bowen Mei model predicted high sensitivity values for NH + NO ↔ N2O + H and NH2 + OH ↔ NH + H2O, which play an essential role in the formation of N2O, different from Stagni and Bertolino assumptions.
The impact of Reynolds number and thermal intensity conditions on the N2O and NO emissions level has been clearly shown. Therefore, the intensity of produced radicals such as NH*, NH2*, and NO* increased with varying Reynolds conditions from 20,000 to 40,000, whereas peaks of the radicals were noticed at 15 kW thermal power. Finally, a considerable amount of NO is consumed by reactions with NH to produce N2O through the chemical reaction NH+NO↔N2O+H, a behavior that intensifies when Re =40,000.
Abbreviations
NH3 : Ammonia;H2 :Hydrogen;NO:Nitrogen monoxide;NO2 :Nitrogen Dioxide;N2O:Nitrous oxide;N2 :Nitrogen;NOX :Nitrogen oxides;CO2 :Carbon dioxide;NH, NH2 :Nitrogen hydrides;OH:Hydroxide;Re:Reynolds Number;NTP:Normal pressure and temperature;CRZ:Central Recirculation Zone;ERZ:Eternal recirculation zone.;G:GasTc:Thermocouplew:Wall*:Radical
Authors’ Contributions
Conceptualization—Alnasif A. and Mashruk S.; Investigation—Mashruk S., and Alnasif A.; Methodology—Valera-Medina A, Mashruk S., and Alnasif A; Project administration—Valera-Medina A, Mashruk S.; Resources—Valera-Medina A., Mashruk S., and Alnasif A.; Supervision—Valera-Medina A.; Visualization—Alnasif A. and Mashruk S.; Writing—original draft—Alnasif A. and Mashruk S.; Writing—review and editing—Mashruk S., Kovaleva M., Wang P., and Valera-Medina A. All authors have read and agreed to the published version of the manuscript.
Funding
This work was supported by the SAFE-AGT pilot (no. EP/T009314/1) with funding from the Engineering and Physical Sciences Research Council (EPSRC). The research was undertaken at Cardiff University’s Thermofluids Lab (W/0.07) with invaluable technical support from Mr. Malcolm Seaborne. Engineering and Physical Sciences Research Council,EP/T009314/1,A Valera-Medina
Availability of data and materials
Information on the data underpinning the results presented here, including how to access them, can be found in the Cardiff University data catalogue at http://orca.cf.ac.uk/XXXXXX.
Declarations
Competing interests
The authors declare no conflict of interest.
