
1 Introduction
As the most important branch of photovoltaic (PV) field for global carbon neutrality, crystalline silicon (c-Si) solar cell technology has a market share of over 95% due to the advantages of mature industry, low manufacturing cost and high material reliability. Currently, the research hotspots in the c-Si industry are focused on passivated emitter and rear cell (PERC), tunnel oxide passivated contact (TOPCon) cell and Si heterojunction (SHJ) cell. PERC has become the mainstream of the PV market since its conception in 1989 [1]. The power conversion efficiency (PCE) of the present mass production of p-Si PERCs is in the range of 22.8%-23.3% with the world-record PCE of 24.06% declared by Longi Solar (http://taiyangnews.info/technology/longi-24-06-efficiency-perc-cell-world-recod). TOPCon cell was first proposed by Feldmann et al. [2], in 2013, by using a passivated structure of ultrathin SiOx and doped polycrystalline Si, thus achieving low recombination carrier selective contacts. Hollemann et al. [3], realized an efficiency of 26.1% utilizing a TOPCon structure in combination with an interdigitated back contact (IBC). SHJ cell is one of the most mature solar cells in the industry, and has been maintaining the world’s highest efficiency in the field of c-Si cells due to its effective carrier selective contacts and heterojunction interface characteristics. Yoshikawa et al. [4], employed the SHJ structure combined with IBC electrodes to increase the efficiency to a certified 26.7%, which is currently the highest single junction non-concentrator c-Si solar cell in the world.
However, the PCE of c-Si solar cells is approaching the Shockley-Queisser limit (detailed balance) of 29.4% (Fig. 1(a)) [5], and the enhancement of single junction PCE will be very difficult due to the energy mismatched photons and the presence of electrical recombination (Auger, Shockley-Read-Hall, and etc.) [7]. The simplest way is to use absorber materials with different bandgaps to absorb photons of different energies, which can reduce the thermal loss of high-energy electrons, and the most cost-effective approach is the 2-terminal perovskite/c-Si tandem solar cell (2 T PSK/c-Si TSC). According to numerical calculations by Yu et al. [6], (Fig. 1(a)) the theoretical tandem PCE can be as high as 43% using a PSK with a bandgap of 1.72 eV (experimental optimal bandgap of 1.68 eV) [8] in combination with a c-Si of 1.12 eV. As shown in Fig. 1(b) [8,9,10,11,12,13,14,15,16,17,18,19,20,21,22,23,24,25,26,27,28,29,30,31,32,33,34,35,36,37,38,39,40,41,42,43,44,45,46,47,48,49,50] (https://www.oxfordpv.com/), it takes only 6 years from the 13.7% (homojunction-based) first reported by Mailoa et al. [22], to 29.8% achieved by Helmholtz Zentrum Berlin (HZB) [50], revealing a very rapid progress in PCE of PSK/c-Si TSC. Moreover, based on the superiority of high PCE and mature industrialization of sub-cells, PSK/c-Si TSC has gradually become the hottest research topic in the field of multi-junction cells, and is expected to be a natural candidate for replacing conventional c-Si cells [51,52,53].
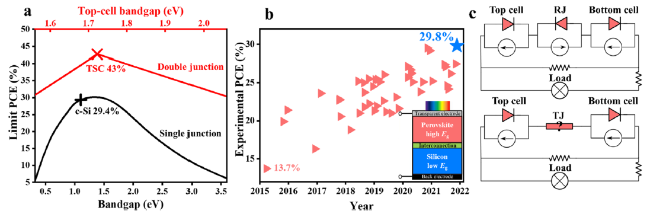
Fig. 1 a Theoretical limit PCE for single junction and c-Si-based double junction solar cells [5,6]. b Experimental PCE evolution of PSK/c-Si TSC reported by literature, together with the schematic of PSK/c-Si TSC shown in the inset. c Equivalent circuits of 2 T PSK/c-Si TSC. Top is a recombination junction (RJ) case, and bottom is a tunnel junction (TJ) case |
As a more widely used means of predicting the limit efficiency, the detailed balance makes the following assumptions: [54,55,56] (1) light absorption is assumed to be zero for the energy below the bandgap of the solar cell. All photons with energy above the bandgap are assumed to be absorbed; (2) each absorbed photon generates only one electron-hole pair; (3) the quasi-Fermi energy level is assumed to be constant; and (4) only recombination effect inside the solar cell is radiative recombination. For PSK solar cells, Sha et al. [54], exclusively revealed that the angularly unconstrained MAPbI3 limit efficiency can reach 31%, and their dominant revelation of textured structure has been guiding the subsequent research work. To make the PSK photovoltaic performance close to the Shockley-Queisser limit, Zhang et al. [57], found that the 1-dimensional/3-dimensional (1D/3D) hybrid PSK films have significant ferroelectricity, and learned from simulations that the PCE increases significantly with the increase of dielectric constant.
Since the direct connection between the PSK and Si devices will have a potential in the opposite direction, a recombination junction (RJ) or tunnel junction (TJ) is generally used to avoid the loss of open circuit voltage (VOC), and its equivalent circuit is shown in Fig. 1(c). At present, the equivalent circuit of a RJ is unquestionable, but the TJ is modeled differently in special cases. With any reverse bias and a small forward bias, TJ is similar to a resistor. Howerer, the TJ’s behavior is dominated by thermionic emission under forward bias conditions when the current density is greater than the peak tunnel current [58]. This case requires the use of a thermionic-field emission expression based on the Wentzel-Kramers-Brillouin (WKB) approximation to simulate quantum tunnel effects.
Since PSK/c-Si TSC involves numerous functional interfaces (transparent electrodes, intermediate recombination layers, and transport layers), not only the fabrication process is complicated, but also its PV performance is affected by a combination of various factors. Experimentally screening the parameters of each layer is certainly the most straightforward method, but owing to the interactions among many parameters, it would be time-consuming and costly to study them separately. In this regard, photoelectric simulations allow to investigate each parameter independently, which makes it particularly significant. The specific effects of the parameters and the optimal cell structure obtained from the simulations can effectively guide the experimental process and achieve a novel breakthrough in PSK/c-Si TSC [59,60,61,62,63].
This invited review summarizes the progress of numerical simulation studies of PSK/c-Si TSC in terms of the methodology, light harvesting management, and energy yield (EY) aspects. Starting with the physical fundamentals of the methodology, we outline five commonly used software kernels (finite element method (FEM) [64,65], method of moments (MoM) [66], finite difference time domain (FDTD) [62,63,67,68,69,70,71], transfer matrix method (TMM) [72,73,74,75], and time domain integral equation (TDIE) [76]) for calculating electromagnetic problems, and point out that integration of methods, optimization of modeling and parameter correction can effectively improve simulation accuracy. For the light harvesting management part, by analyzing the optical properties of single junction cell, double junction cell and quasi-conformal structure, we illustrate that the textured PSK/c-Si TSC has excellent PV performance. A current matching loss (CML) method has also been introduced for bifacial PSK/c-Si TSC. For the EY part, we indicate that the root cause (weather, location, and time, etc.) affecting the EY of monofacial PSK/c-Si TSC is the spectral variables, and further for the bifacial issues, both the effective albedo and the PSK bandgap are to be considered. Hence, we conclude that it is essential to identify the intrinsic relevance of these factors and integrate them into cell preparation and module installation engineering to maximize EY. This in-depth numerical simulation review provides a guidance for experimental preparation of low-cost and high-efficiency PSK/c-Si TSC.
2 Physics and calculation methodology
$ \nabla \times \left(\nabla \times E\right)={k}^2{\varepsilon}_rE $
$ \nabla \cdotp \left[-{D}_n\nabla n+n{\mu}_n\left(\nabla \varPsi +\frac{\nabla \chi}{q}+\frac{K_bT}{q}\nabla \mathit{\ln}{N}_C\right)-n{D}_{th}^n\nabla T\right]=G-U $
$ \nabla \cdotp \left[-{D}_p\nabla p-p{\mu}_p\left(\nabla \varPsi +\frac{\nabla \chi}{q}+\frac{\nabla {E}_g}{q}-\frac{K_bT}{q}\nabla \mathit{\ln}{N}_V\right)-p{D}_{th}^p\nabla T\right]=G-U $
$ {\nabla}^2\varPsi =\frac{q}{\varepsilon_0{\varepsilon}_r}\left(n-p-C\right) $
where E is electric field, k wave vector, εr the permittivity, Dn (Dp) the electron (hole) diffusion coefficient, n (p) the electron (hole) concentration, μn (μp) the electron (hole) mobility, Ψ the electrostatic potential, Dnth (Dpth) the electron (hole) thermal diffusion coefficient, χ the electron affinity, Eg the energy gap, NC (NV) the conduction (valence) band density of states, Kb the Boltzmann’s constant, q the electron charge, T temperature, G the total generation rate, U the total recombination rate, ε0 the initial permittivity, C the impurity concentration.
Equation (1) is the electromagnetic wave equation, which describes the propagation of photons in the solar cell under transverse electric (TE) and transverse magnetic (TM) incidence. The absorption spectrum and E can be accessed based on Eq. (1), and the G can be further derived through E and the imaginary part of the corresponding material permittivity [80,81]. Therefore, the suitable anti-reflection layer and light trapping structures are usually designed to improve the effective light absorption and photocurrent of solar cells [18,48]. However, the electron-hole pairs inside solar cells cannot fully generate current due to the existence of the U [77,82,83], commonly including radiation, Auger, Shockley-Read-Hall, and surface recombination. Poisson Eq. (4) handles with the problem of electric potential (V) distribution with the space charge density (J) into the cell, which can be solved according to the transport process of photons in solar cells after being absorbed as listed in the Eqs. (2) and (3). The J-V curve can be obtained by Eqs. (2-4) and the corresponding boundary conditions to find the maximum power point (MPP), then PV performance parameters (VOC, short-circuit current density (JSC), fill factor (FF), PCE) of solar cells can be solved according to existing procedures [62]. Similarly, the PV performance of bifacial single junction solar cells can be easily obtained by the addition of the absorption spectra under front and rear incidence.
Based on the aforementioned single junction solar cell characteristics, the PV performance of the PSK/c-Si TSC can be determined directly from that of its sub-cells. Since the current is required to be consistent in the series circuit, the current density of the bifacial tandem cell (JBT) depends on the smaller one, and the open-circuit voltage of the bifacial tandem cell (VBT) is sum of the sub-cells, as listed in Eqs. (5) and (6), respectively. Here, monofacial case is included in the bifacial PSK/c-Si TSC considered as a condition where the rear incidence is zero. It should be noted that many researchers regard the efficiency of the TSC as the sum of the efficiencies of the two sub-cells, which is only true when the currents of the two sub-cells are matched. In fact, the PCE of the bifacial tandem cell (PCEBT) is less than the sum of the PCE of the two sub-cells due to the CML as described in Eq. (7) [84]. The CML establishes numerical relationships based on a strict energy balance principle and graphically analyzes the current characteristics of the sub-cell under bifacial illumination. This algorithm takes into account the effect of the mismatch current on the solar cell parameters, making the double junction more like a whole device (more accurate results). The PCECML can be directly acquired through MPP tracking from the J-V curves of the sub-cells by Eq. (8). Hence, the fill factor of the bifacial tandem cell (FFBT) can be easily obtained based on JBT, VBT, and PCEBT by Eq. (9). Finally, the EY of the PSK/c-Si TSC is evaluated by Eq. (10) based on time-dependent spectral illuminate Pill(t).
$ {J}_{\mathrm{BT}}={\left[J\left(\mathrm{top}\right),J\left(\mathrm{bottom}\right)\right]}_{\mathrm{min}} $
$ {V}_{\mathrm{BT}}=V\left(\mathrm{top}\right)+V\left(\mathrm{bottom}\right) $
$ {\mathrm{PCE}}_{\mathrm{BT}}=\mathrm{PCE}\left(\mathrm{top}\right)+\mathrm{PCE}\left(\mathrm{bottom}\right)-{\mathrm{PCE}}_{\mathrm{CML}} $
$ {\mathrm{PCE}}_{\mathrm{CML}}=\frac{{\left[\left({J}_{\mathrm{m}\mathrm{ax}}-{J}_{\mathrm{m}\mathrm{in}}\right){V}_{\mathrm{m}\mathrm{ax}}\right]}_{\mathrm{MPP}}}{1000\ \mathrm{W}/{\mathrm{m}}^2}\kern0.75em $
$ {FF}_{\mathrm{BT}}=\frac{{\mathrm{PCE}}_{\mathrm{BT}}\ }{V_{\mathrm{BT}}\cdotp {J}_{\mathrm{BT}}}\cdotp 1000\ \mathrm{W}/{\mathrm{m}}^2 $
$ EY=\int {P}_{\mathrm{ill}}(t)\cdotp {\mathrm{PCE}}_{\mathrm{BT}} dt $
The issue of light propagation and absorption in solar cells is ultimately a problem of solving electromagnetic field, for which there are many numerical methods, as shown in Table 1. The relatively mature kernels of simulation software are: FEM [64,65], MoM [66], which belong to frequency domain technique; FDTD [62,63,67,68,69,70,71], TMM [72,73,74,75], and TDIE [76], which belong to time domain technique. Each method has its own features and limitations. Since MoM and TDIE only focus on electromagnetic scattering problems at surfaces and interfaces, they have no application in solar cell simulation. Currently, commonly used simulation software includes TCAD, GenPro4, JCMsuite, OPTOS, FDTD, SCAPS, and AFORS-HET. These are software packages written to simulate and optimize devices by combining already established optical models. Some software is integrated and contains both electrical and optical modules, such as Silvaco TCAD. Some dominant electrical simulation software is not applicable because the PSK/c-Si TSC requires a rigorous solution for the electromagnetic field due to its many structures and widely varying optical properties.
Table 1 Overview of numerical calculation methods for electromagnetic fields |
| Technology | Methodology | Form | Characteristics | Refs. |
|---|---|---|---|---|
| Frequency Domain | FEM | Differential | Flexible discrete elements Sparse symmetric matrix facilitates the solution Accurate simulation for the interaction between the medium of complex structures and electromagnetic fields May require more storage space and computation time | [64, 65] |
| MoM | Integral | Suitable for arbitrary shapes and non-uniformity problems Electromagnetic calculations limited to surfaces May lead to increased difficulty in solving very large matrices | [66] | |
| Time Domain | FDTD | Differential | Using Maxwell’s equations as a starting point Simulation of wave propagation and the interaction between light and matter in a computerized digital space Calculation area involves not only the surface, but also the interior Too fine a mesh can lead to a huge amount of calculations | [62, 63, 67,68,69,70,71] |
| TMM | Differential | Huygens-based wave propagation model A method for calculating the propagation of light in multilayer films Complex multi-beam superimposed interference processes in matrix form Oversimplification of non-vertical incidence and multiple scattering | [72,73,74,75] | |
| TDIE | Integral | Accurate simulation calculations for surfaces and interfaces Post-storage of time to complete deferred integration, which greatly increases the storage time and space | [76] |
The optical simulation modules for solar cells are FEM, FDTD and TMM. Jäger et al. [64], utilized FEM combined with Lambertian law to provide an outlook on the light harvesting management of PSK/c-Si TSC and proposed excellent optical properties of the sinusoidal interface. The FEM discretizes the computational space into a finite number of small elements in the form of a sparse symmetric matrix, which is convenient for calculations. FEM is advanced for treating the interaction of light with complex structures, but may suffer from computational overload. Tennyson et al. [70], used FDTD to simulate the optical properties of textured PSK/c-Si TSC surfaces, and their results on the in/out-coupling of photons agree with the experimental photoluminescence (PL) characteristics. The FDTD takes Maxwell’s equations as a starting point, with easy programming processing, short procedure development time, and more natural and explicit method logic. The computational area of FDTD can be either the cell interface or the interior of the structure, but too fine a mesh division can lead to a huge calculation. Bittkau et al. [72], applied TMM and genetic algorithm to analyze the optical loss of TSC each layer and give the optimal spectral structure and material design. The TMM principle is based on Huygens wave propagation model to calculate the light in multilayer film, but simplifies non-vertical incidence and multiple scattering.
Current advances in optical simulation of tandem solar cells include: (1) integration of methods; (2) optimization of modeling; and (3) parameter correction. For the first progress, to address the restriction of single electromagnetic method, Liu et al. [85], proposed the optical path analysis combined with TMM to overcome the simulation difficulties of the metal shading and sub-band gap parasitic absorption. Besides making improvements manually, the simulation software can be an integration of multiple methods, such as matrix-based OPTOS [86,87,88,89,90] and GenPro4 [91,92]. With the evolution of artificial intelligence, solar cell simulation may be combined with algorithms such as decision trees, genetic algorithms, logistic regression, and neural networks to generate easier and more accurate packages. For the second progress, the thickness of the Si bottom-cell in PSK/c-Si TSC is about 250 μm, the simulation computation is huge, and in order to reasonably allocate computer arithmetic power and resources, the infinite Si model is used for most modeling (only calculation of PSK and functional layers) [68,69,93]. To obtain more realistic results, Ba et al. [62], employed the bottom reflection integration method to deal with the computationally intensive problem of finite Si models. For the third progress, the current density mismatch becoming a regular occurrence in bifacial PSK/c-Si TSC, Du et al. [84], proposed the CML method to achieve correction of the simulation parameters to obtain more accurate results.
3 Light harvesting management
As experiments can be limited by various factors, theoretical aspects can pave the way for experimental studies. Numerical simulation is favored by many theorists as an important tool for analyzing scientific problems, and has numerous advantages [59,60,61,94,95,96]. Firstly, the simulation can disassemble each structure of the cell to study the influence of each part independently, which helps to obtain the optimal detailed parameters in a comprehensive and detailed way. Second, simulations can investigate the effects of optical and electrical parameters on the overall performance of the cell, which can be combined with experiments to design better structural solutions and help improve the efficiency of experimental workers. Third, simulations allow the study for the experimental structure of advanced ideas.
3.1 Single junction solar cell
The laboratory certified efficiency of PSK single junction cells has increased from 3.8% [97] in 2009 to 25.5% [50,98] currently, making it an ideal top-cell for TSC due to its bandgap tunability [99,100,101], high defect tolerance [102,103], high absorption coefficient [104], and steep absorption edge [105,106,107]. The current study found that mirror-like PSK cells exhibit superior PV performance [108,109,110,111], contrary to the robust light trapping of pyramid-textured Si [112,113]. To evaluate the effects of textured PSK interfaces on the light absorption, Xu et al. [114], utilized polystyrene spheres masked on the hole transport layer (HTL, 50 nm) to increase the roughness and reduce the reflection loss at the incident side. From the simulated results (Fig. 2(a1,2)), the average reflectance of the upper surface of the planar PSK reaches 3.5%, while the impact of reflection can be neglected at the textured interface due to the scattering effects. This finding is verified in Fig. 2(a3), the textured interface exhibits a high light absorption value, and is further enhanced after being coated with an anti-reflection (AR) film. Moreover, the results of these simulations are consistent with the experimental characterization in Ref. [114].
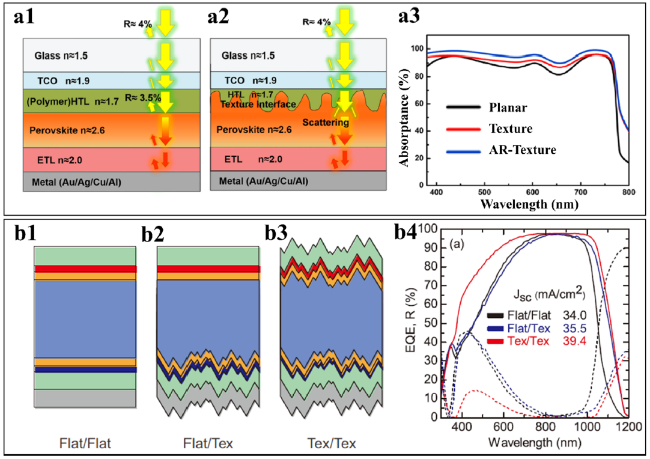
Fig. 2 Simulation of the single junction solar cell. Schematic diagram of (a1) light reflection from a planar PSK solar cell and (a2) light scattering from a textured PSK interface; (a3) Calculated curves of light absorption for three different structures. AR, anti-reflection. Reproduced with permission [114]. Copyright 2020, American Chemical Society. Schematic diagram of (b1) the full-planar SHJ cell, (b2) SHJ cell with a single texture at the bottom, (b3) SHJ cell with a double texture at the top and bottom; (b4) EQE (solid curves) and reflectance (R, dashed curves) spectra obtained from optical simulations of three structures (Flat/Flat, Flat/Tex, Tex/Tex). Reproduced with permission [115]. Copyright 2017, Elsevier B.V |
The production line process for c-Si solar cells commonly adopts a textured light incident surface to achieve optimal light capture [116,117,118]. To investigate the position specificity of the optical structure, Manzoor et al. [115], quantified and analyzed external quantum efficiency (EQE) loss by simulating the textured (Tex) interface at the top and bottom (Fig. 2(b1-3)). As shown in Fig. 2(b4), Tex/Tex has the highest EQE curve, and the integral JSC of 34.0, 35.5, and 39.4 mA/cm2 for Flat/Flat, Flat/Tex, and Tex/Tex, respectively, revealing the excellent spectral response of the textured structure. Furthermore, the waveband analysis of the EQE indicates that the bottom surface texture has a robust long-wave response and the top surface texture has a robust short-wave response, which agrees with the reflection (R) characteristics.
These simulations show that both PSK texture (nano-scale, achieved by etching 50 nm HTL) and c-Si texture (micron-scale, etching to produce about 2 μm pyramids) have strong light trapping ability, and these conclusions have been verified by experiments. However, the large-texture (micron-scale) can bring negative factors to the PSK film formation process, this can cause numerous defect states and electrical degradation. Therefore, while the inclusion of texture is beneficial, the control of size is particularly significant.
3.2 PSK/c-Si double junction solar cell
For a double junction solar cell, the building of PSK texture can be done with the optical structure of the c-Si bottom-cell, and the way of combining the structures of two different bandgap materials is the key to improve the efficiency of PSK/c-Si TSC. Due to the high experimental threshold for the preparation of different structures (e.g., textured PSK preparation involving dual-source co-evaporation) [8,46,47,48], theoretical studies can provide guidelines for experiments to obtain the best solutions. As shown in Fig. 3(a1-6), Santbergen et al. [119], performed theoretical photocurrent density simulations for six structures using the TMM-based GenPro4 optical model. When textures are applied to the backside of the PSK/c-Si TSC (Fig. 3(a1,2)), the reflection loss is reduced and the current density (JSC) increases from 17.28 to 18.16 mA/cm2. When textures of the front and rear surfaces are designed (conformal structure, Fig. 3(a6)), the current density can be up to 20.25 mA/cm2, which is the optimal theoretical structure for PSK/c-Si TSC. Since the exploitation of PSK is still in the planar stage, Santbergen et al. [119], gave three sets of planar PSK-based suboptimal tandem current densities from a theoretical viewpoint (Fig. 3(a3-5)): 18.60, 18.72, and 19.57 mA/cm2. The loss of Fig. 3(a3) lies in the front surface reflection, the loss of Fig. 3(a4,5) originates from the parasitic absorption of the burial layer, and the antireflection (AR) layer of Fig. 3(a5) can promote the optical resonance effect and avoid the reflection. To investigate the dominance of the TSC bottom texture, Ba et al. [62], utilized FDTD to simulate the light interaction at the bottom interface (Fig. 3(b1-3)). As the photons propagate to the bottom, the rough interface causes reflections in different directions and leads to an increase in current density due to the longer distance of the obliquely reflected light interacting inside c-Si. In addition, for the analysis of top texture advantage, Jacobs et al. [120], quantified the sources of optical loss in each aspect (MgF2, IZO, C60, and ITO, etc.) using TMM and Lambert-Beer’s law (Fig. 3(c1,2)), where the greatest strength of the conformal structure over the planar structure is the significant reduction in reflection (R) loss. Therefore, the addition of both top and bottom textures can promote the light absorption of PSK/c-Si TSC and improve the PV performance.
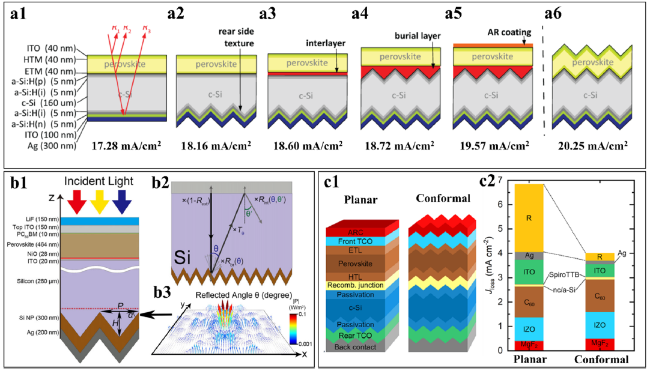
Fig. 3 Calculation of the PSK/c-Si double junction solar cell. (a1-6) Tandem structures with different roughnesses and their corresponding theoretical JSCs. AR, anti-reflection. Reproduced with permission [119]. Copyright 2016, Optical Society of America. (b1) Schematic diagram of just the c-Si bottom surface as a textured pyramid, (b2) reflection mechanism inside the c-Si cell, and (b3) vector distribution of light reflection in 3-dimensions for the bottom pyramid (λ = 1100 nm, P = 5.0 μm, and H = 3.0 μm). P, period; H, height; α, inclination angle of the pyramid. Reproduced with permission [62]. Copyright 2018, John Wiley & Sons, Ltd. (c1) Schematic diagram of planar and conformal structures, and (c2) quantitative analysis of specific JSC losses. R, reflection. Reproduced with permission [120]. Copyright 2019, American Chemical Society |
3.3 Quasi-conformal structures
Currently, the PSK preparation of conformal structure with dual-textures involves the complex dual-source co-evaporation and solution method with a laboratory efficiency of only 25.2% [48], while the fabrication of quasi-conformal structure (undulation of the interface is modified) is a facile one-step solution method and the tandem efficiency has been as high as 27.4% [43]. However, the experimental study of the quasi-conformal structure is only for the case where the front surface is flat (single-textured PSK) [39,40,41,42,43], so theoretical exploration of other types of interfaces in the quasi-conformal structure can understand the PV mechanism and extend the efficiency advantage of this structure. As shown in Fig. 4(a1,2), Qarony et al. [68], specifically investigated conformal and quasi-conformal structures using FDTD, in which the films grow along the substrate normal direction (SND) and along the local surface normal direction (LSND), respectively. By analyzing the power density distribution, they found that LSND can effectively attenuate the strong spot at the top of the pyramid compared with SND, and this effect can increase the effective light absorption thickness of PSK by 73%, which means the film deposition time can be reduced by 42%. Besides the curvature strategy on the upper surface of the quasi-conformal PSK, Jäger et al. [64], utilized FEM to propose sinusoidal c-Si substrates to optimize the lower surface of the PSK. As shown in Fig. 4(b1,2), a Si substrate with a sinusoidal structure not only makes the growth of PSK easy, but it has a lower reflection in the short-wavelength range and a higher EQE value compared to the planar structure, indicating that the substrate optimization can achieve superior optical performance. To overcome the PSK coverage issues on the pyramidal texture, quasi-conformal PSK layers were prepared by Wang et al. [71], using starch additive engineering, and theoretical analysis was performed applying FDTD. As shown in Fig. 4(c1,2), the light absorption distribution becomes more uniform in the quasi-conformal structure (Δα = 20°), and it is found to have absorption enhancement in the valley by integrating over the height direction, which agrees with the results of Ref. [68]. These three methods of interfacial undulation modification (quasi-conformal structure), except for the preparation process to meet the requirements of PSK, can yield very similar optical properties to the conformal structure. As the experimental research of PSK/c-Si TSC advances, the quasi-conformal structure has gradually replaced the planar structure with severe optical loss and become the current hot spot in academia [44,45].
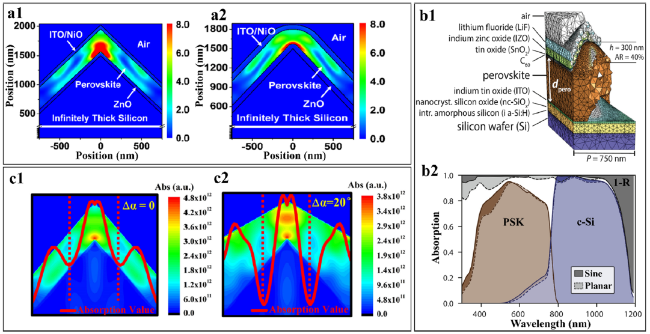
Fig. 4 Theoretical simulation of the conformal and quasi-conformal PSK/c-Si TSC. Power density distribution of PSKs (a1) growing along the substrate normal and (a2) growing along the local surface normal (λ = 750 nm). Reproduced with permission [68]. Copyright 2020, American Chemical Society. (b1) Simulation model of sine structure. AR, anti-reflection. (b2) light absorption results of planar and sine structures. R, reflection. Reproduced with permission [64]. Copyright 2021, De Gruyter. The light absorption (Abs) intensity distribution of (c1) conformal and (c2) quasi-conformal structures (λ = 600 nm). The red solid curves represent the integral of light absorption in the direction of the pyramid height, the dotted lines represent the division between tip and valley, and Δα is the difference between the inclination of PSK and Si pyramid. Reproduced with permission [71]. Copyright 2020, Wiley-VCH GmbH |
3.4 Bifacial properties
To utilize the solar spectrum more efficiently, a bifacial strategy for solar cells will result in an increase in energy output of about 25% [121,122,123]. The concept of bifacial solar cells has now been widely employed in c-Si solar cells [124], and according to the International Technology Roadmap for Photovoltaic [125], market share of bifaciality is forecast to reach approximately 40% by 2028. The PSK/c-Si TSC with greater efficiency potential can take advantage of the c-Si backside, and besides receiving the solar spectrum from the front side, ground scattered and reflected light will allow the PCE of the bifacial TSC to be further enhanced (Fig. 5(a1)) [126]. As shown in Fig. 5(a2) [127], the lowest average albedo can reach 9% (sandstone), and the highest average albedo is even as high as 88% (snow), revealing that the solar irradiation on the back surface of the solar cell should not to be underestimated.
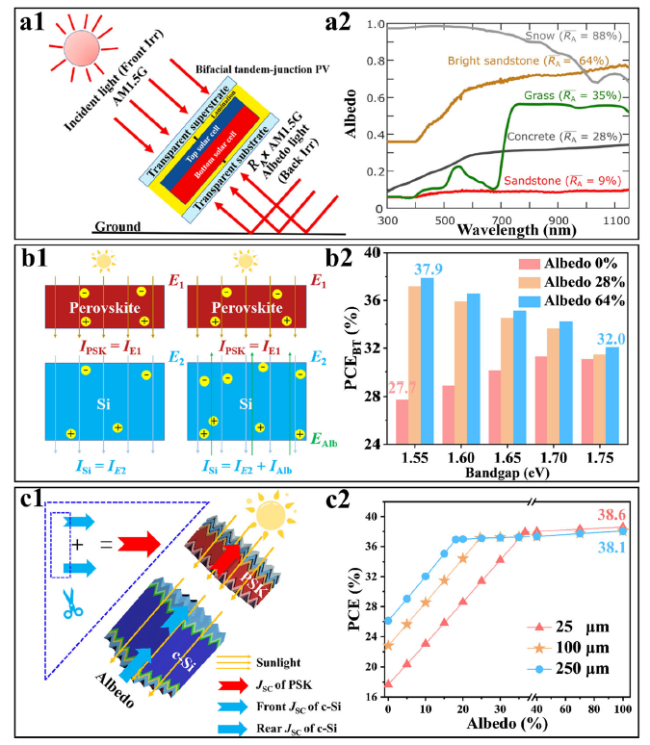
Fig. 5 Simulation of the bifacial PSK/c-Si TSC. (a1) Schematic diagram of the actual bifacial working environment. RA, albedo; Irr, irradiance. Reproduced with permission [126]. Copyright 2021, Elsevier Ltd. (a2) Albedo curves formed by different types of ground. Reproduced with permission [127]. Copyright 2019, Elsevier B.V.. (b1) Principles of CML formation in a bifacial TSC, the left is monofacial TSC and the right is bifacial TSC. Alb, albedo. (b2) Calculated bifacial tandem (BT) efficiencies under different bandgaps and albedo conditions after CML correction. (c1) Diagram of ultrathin c-Si optimized for top-cell and bottom-cell current matching. (c2) TSC efficiencies obtained for three different thicknesses (25, 100, and 250 μm) of c-Si bottom-cells at various albedos |
Since the experiment of PSK/c-Si TSC itself involves complex preparation and modulation of multilayers [46,47,48], coupled with the extremely high stability requirements for bifacial testing [41,128,129], the progress of the related bifacial studies is slow. Numerical simulations can predict the actual benefits of the bifaciality in advance and give theoretical guidance to experimental studies. However, for the simulation of the bifacial PSK/c-Si TSC, previous reports have been performed without considering the effect of current mismatch on cell parameters [82,130]. To address the effect of the albedo spectrum (Fig. 5(b1)), Du et al. [84], proposed the CML method to correct the simulation parameters and obtain more reliable results. As shown in Fig. 5(b2), when the bandgap of PSK is 1.55 eV, the difference in PCE of bifacial TSC (albedo 64%) relative to monofacial TSC (albedo 0%) is as high as 10.2% (absolute). When the albedo is 64%, the bifacial PCE of the TSC with a 1.75 eV PSK is 32.0%, while the bifacial PCE with a 1.55 eV PSK is up to 37.9%, reflecting the fact that the bifacial properties can lead to a smaller optimal bandgap (optimal bandgap of the monofacial PSK/c-Si TSC is 1.68 eV [8]). Furthermore, for the cost reduction and efficiency improvement of PSK/c-Si TSC, Du et al. [131], innovatively proposed to reduce the Si usage and achieve the redistribution of reflected light in the sub-cell by reducing the wafer thickness (Fig. 5(c1)). As shown in Fig. 5(c2), they applied FEM combined with CML to find that the 250 μm thickness c-Si bottom-cell has an advantage when the albedo is low, but when the albedo reaches about 35%, the tandem PCE is essentially the same for the three c-Si thicknesses (25, 100, and 250 μm). The tandem PCE of 25 μm c-Si is even as high as 38.6% when the albedo is 100%, revealing that the thinned Si strategy not only helps to reduce the cost, but also keeps the high PCE at sufficient albedos. These numerical researches can serve as a guidance for experimental preparation of low-cost and high-efficiency bifacial PSK/c-Si TSC.
4 Energy yield
Compared to a single junction solar cell, the currents of all sub-cells must be close to avoid current mismatch as much as possible for a monolithically integrated TSC to obtain efficient EY [62,132]. The angle of incidence and the intensity of the spectrum are often restricted by factors such as weather, location, and time under actual outdoor conditions [21,67,133,134,135], and the preparation of PSK with wide-bandgap is challenging, which limits the systematic study of EY in experimental work. On the contrary, numerical simulation is an efficient and feasible method to carry out in-depth exploration of these complex influencing factors, which is beneficial to formulate specific schemes for different scenarios to maximize the energy output.
4.1 Monofacial PSK/c-Si TSC
For monofacial properties, Jošt et al. [18], simulated two tilts of the building integrated photovoltaic (BIPV): 30° and 90° facing south in three cities (Washington, Golden, and Phoenix) located in the northern hemisphere. The annual EY of PSK/c-Si TSC for the two tilts are shown in Fig. 6(a1,2). Interestingly, 30° tilt always yields more EY than 90° tilts regardless of locations and cell types because of getting longer light time. And Phoenix yields the highest amount of energy more than 650 kWh/m2 for the 30° tilt among three cities, but does not achieve a clear advantage for the 90° tilt due to a higher part of diffuse illumination. Analysis of the structures reveals that the EY of D (both-sided texture) is significantly higher than the other three structures (A (flat), B (back-sided texture), and C (back-sided texture + light management foil)), which reflects the superiority of the dual-textures, a conclusion that is consistent with Section 3.2. As we know, the light intensity and scattering intensity will be disturbed by location and weather and thus affect the performance of TSC. Futscher et al. [136], collected and compared solar irradiation of the Netherlands (Fig. 6(b1)) and Colorado (Fig. 6(b2)), which have the characteristics of oceanic climate and grassland climate, respectively. The measurement results show that the average photon energy (APE) of the two places is close to the standard spectrum (AM1.5G, 1.845 eV). However, the annual average irradiance (249 W/m2 in Netherlands and 432 W/m2 in Colorado) is much lower than that of the standard spectrum (1000 W/m2). As shown in the inset of Fig. 6(b1), except for (1), which has a good match with AM1.5G, the solar irradiance spectra of the other cases ((2), (3), and (4)) vary tremendously, which means that the TSC current matching occurs only around data point 1. The JSC has a weaker dependence on the APE, and the current-matched tandem is the most affected by spectral changes. The limiting efficiency of PSK/c-Si TSC varies greatly with time and location due to the variability of the spectrum, and the EY of tandem cells is even lower than that of single junction c-Si solar cells at high APEs and low irradiations. Similarly, Tucher et al. [137], exhibited hourly global irradiance with a tilt angle of 29° versus APE in Freiburg from January to December in Fig. 6(c1). Although the highest spectral irradiance occurs in the summer months corresponding to about 1.8 eV APE, there is a wide range of solar irradiation. As shown in Fig. 6(c2), the difference in the maximum PCE at different times even reaches about 20% (absolute), revealing that irradiation (spectral variables) is a significant factor affecting the EY.
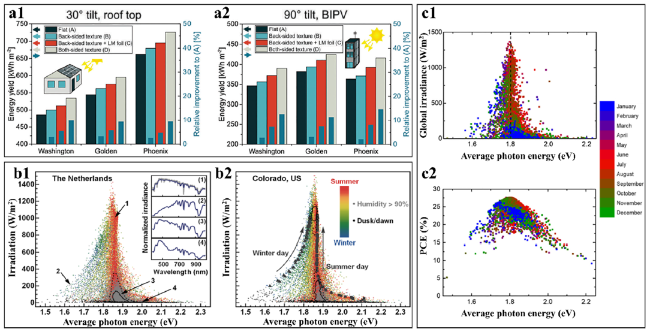
Fig. 6 Yearly energy yield for (a1) 30° and (a2) 90° solar cell orientation. Three different locations (Washington, Golden, and Phoenix) and four different cell types (A, B, C, and D) are compared here. LM, light management. Reproduced with permission [18]. Copyright 2018, The Royal Society of Chemistry. Solar spectral irradiance under the influence of weather in (b1) Netherlands and (b2) Colorado. The inset of (b1) illustrates the variation of the broad spectral distribution (1) at midday in summer with the standard spectrum (AM1.5G) in shades of gray, (2) during a winter morning, (3) during a summer day with high relative humidity, and (4) at dawn. The upright triangles and the squares in (b2) correspond to the course of clear sky days measured in winter and in summer, respectively. Reproduced with permission [136]. Copyright 2016, American Chemical Society. Time-dependent (c1) hourly global irradiance and (c2) PCEs of the PSK/c-Si TSC from January to December. Reproduced with permission [137]. Copyright 2019, Optical Society of America |
4.2 Bifacial PSK/c-Si TSC
In comparison with the monofacial solar module, the bifacial one is interfered by more environmental factors including albedo due to the introduction of the rear incident light [84,127,138]. Fig. 7(a1) displays the EY modelling for the bifacial PSK/c-Si TSC varying with the location, incident orientation, weather, and albedo etc. Many studies have proved that rear incident photons cannot penetrate the c-Si sub-cell and be absorbed by the PSK layer [139,140]. Therefore, the improvement of the current density of the c-Si sub-cell promotes the reduction of the optimized PSK bandgap under bifacial illumination, which leads to an increase in the current density of the bifacial PSK/c-Si TSC, thereby increasing the EY. In addition, as shown in Fig. 7(a2), Jäger et al. [130], found that the luminescent coupling between sub-cells has a similar effect to make the optimized PSK bandgap of the bifacial TSC red shift. In 2021, De Wolf team [41] firstly reported that the high-performance bifacial PSK/c-Si TSC with different PSK bandgaps achieved the EY of about 26 mW/cm2 during outdoor testing. They performed annual EY simulations in Fig. 7(b) to assess the PV performance of monofacial and bifacial tandems under different PSK bandgaps and albedos. The highest EY was achieved with a PSK bandgap of 1.68 eV for monofacial structure and 1.59 eV for bifacial structure when the albedo exceeding 28%, and the EY of bifacial PSK/c-Si TSC has increased by more than 20% compared to a monofacial ones under the albedo supply. However, the increasing albedo has a weak gain in energy harvesting after achieving a matching albedo and PSK bandgap, which is also verified by the conclusions of Ref. [82]. To maximize the EY of bifacial PSK/c-Si TSC, Onno et al. [82], (Fig. 7(c)) investigated the relationship between photon flux and effective albedo. They found that in addition to the ground material (white sand and dry grass) itself causing albedo variations, single-axis tracking (SAT) has a wider distribution of photon flux compared to the fixed-tilt angle case. This means that for the bifacial TSC, the optimal bandgap PSK designed based on a certain albedo value deviates from its optimum at least part of the time in a SAT system, so the fixed-tilt may be the better solution. To ensure the reliability and lifetimes of solar cells, encapsulation is a common option. Currently, two encapsulation schemes (glass/glass and glass/transparent backsheet) combined with UV-curable adhesive technology are available in the market, which can provide a strong barrier to water and oxygen and effectively slow down the performance degradation.
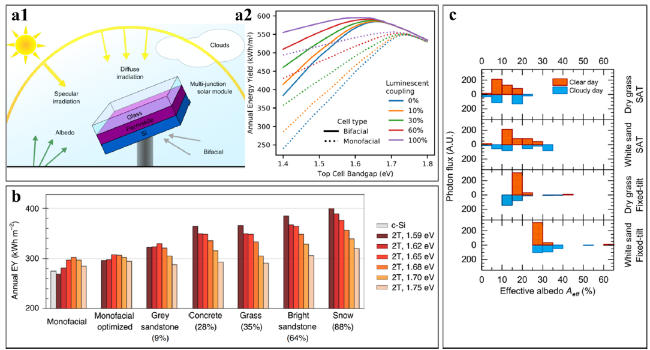
Fig. 7 (a1) Schematic of energy yield for bifacial PSK/c-Si TSC. Reproduced with permission [138]. Copyright 2019, Optical Society of America. (a2) Annual energy yield for monofacial and bifacial PSK/c-Si TSC modules simulated under different luminescent coupling. Reproduced with permission [130]. Copyright 2021, Wiley-VCH GmbH. (b) Energy yield for monofacial and bifacial 2 T PSK/c-Si TSC versus PSK bandgaps and ground conditions. Reproduced with permission [41]. Copyright 2021, Springer Nature. (c) Distribution of the photon flux versus the effective albedo for different scenarios. Reproduced with permission [82]. Copyright 2019, Elsevier Inc. |
5 Summary and outlook
In this review, we have summarized the physics and calculation methodologies, and concluded the research progress on both the light harvesting management and EY topics of the 2 T PSK/c-Si TSC. We start from the physical equations of light-medium interaction, Poisson equation, and the PV parameters calculation of double junction solar cell. Through the analysis of numerical methodologies, we conclude that a single electromagnetic calculation software kernel (FEM, MoM, FDTD, TMM, or TDIE) is very limited to deal with the problem, and the integration of methods can optimize the allocation of computational resources and thus improve the arithmetic power. The optimization of modeling and the parameter correction greatly improve the accuracy of the simulation. However, due to the many fields of physics, energy and computers involved in PSK/c-Si TSC simulation, every progress is a struggle. In the future, the development of advanced integrated software packages based on artificial intelligence, which will revolutionize the impact on numerical simulation.
For the analysis of the optical properties, we point out that the textured structure induces photon coupling to enhance the light trapping capability, so the addition of textures is beneficial for the improvement of PV performance in both single junction and double junction cells. For the conformal PSK preparation of TSC involving a complex co-evaporation process, we realize that the quasi-conformal structure can achieve optical gain, while maintaining the simplicity advantage of the one-step solution method. Nevertheless, the relevant quasi-conformal structures mentioned in this review are theoretical models, sine and LSND cannot be implemented experimentally (only single-textured PSK with a maximum PCE = 27.4% has been achieved in the laboratory), so it is full of challenges and opportunities from structural design to experimental completion.
To address the effects caused by the albedo spectrum in the bifacial PSK/c-Si TSC, we present the CML calculation method, which allows the current mismatch to be fully considered. It is found by CML simulations that when the albedo is sufficient (albedo > 35%), the tandem PCE of c-Si with 25 μm thickness is not substantially different from that of 250 μm. Although this ultrathin c-Si scheme can effectively reduce the cost of solar cells, silver paste cost and equipment availability are still important factors restricting the industrialization of PSK/c-Si TSC. If these economic issues are resolved, the levelized cost of electricity for PSK/c-Si TSC will be lower, which will result in lower prices on the grid.
Focusing on the simulation part of EY, our analysis shows that the spectral variables are the essence of the constraints on EY except for the illumination time and the intrinsic PCE (AM1.5G, under current-matched conditions). For EY of bifacial PSK/c-Si TSC, the issue of optimal bandgap of PSK and the effect of effective albedo on current density need to be taken into account more. According to Ref. [41], although the 1.68 eV PSK is regarded as the optimal bandgap for monofacial case, the annual EY of 1.59 eV PSK (bifacial TSC) is more than 20% higher than that of 1.68 eV PSK (monofacial TSC) when the albedo exceeds 28%. In order to obtain the maximum EY, the current mismatch had to be handled before PSK/c-Si TSC preparation and module installation. Nonetheless, under outdoor conditions, the solar spectrum and effective albedo change all the time, which means that the current mismatch cannot be fundamentally eliminated, so application-based experimental testing cannot be limited to standard conditions either. The spectrum sharing of the sub-cell directly determines the current matching, so we can achieve the maximum utilization of the spectrum from three directions: (1) bandgap and thickness of PSK, (2) solar spectral variables, and (3) effective albedo. In summary, with the deepening of investigation, we believe that PSK/c-Si TSC can definitely lead the solar cell industrialization as a low-cost EY device in the future.
The industrial production of PSK/c-Si TSC cannot be separated from stability. For experimental investigations, Kim et al. [20], (2020) maintained 80% of the initial tandem PCE (20.7%) by using an anion-engineered 2D additive at the 3D PSK grain boundaries, even after 1000 h of continuous illumination. Further, Li et al. [141], (2021) achieved a great breakthrough in stability by constructing a gradient PSK thin layer, and the PCE declined by only absolute 1.41% over 10,000 h. On the theoretical level, while ion migration models are important tools for understanding the photovoltaic performance of planar PSK, simple models of single junction are no longer applicable to face the complex architectures and textured interfaces in the PSK/c-Si TSC. Hence, taking into account the configuration of the PSK/c-Si TSC and even the potential induced degradation (PID) of the Si solar cell is a natural choice for a proper understanding of PSK/c-Si TSC stability in the future.
Abbreviations
PSK:Perovskite;c-Si:Crystalline silicon;TSC:Tandem solar cell;PV:Photovoltaic;PERC:Passivated emitter and rear cell;TOPCon:Tunnel oxide passivated contact;SHJ:Si heterojunction;PCE:Power conversion efficiency;IBC:Interdigitated back contact;EY:Energy yield;RJ:Recombination junction;TJ:Tunnel junction;WKB :Wentzel-Kramers-Brillouin;PID:Potential induced degradation;FEM:Finite element method;MoM:Method of moments;FDTD:Finite difference time domain;TMM:Transfer matrix method;TDIE:Time domain integral eq.;CML:Current matching loss;TE:Transverse electric;TM:Transverse magnetic;MPP:Maximum power point;PL:Photoluminescence;HTL:Hole transport layer;AR:Anti-reflection;EQE:External quantum efficiency;TEX:Textured;SND:Substrate normal direction;LSND:Local surface normal direction;BIPV:Building integrated photovoltaic;APE:Average photon energy;SAT:Single-axis tracking
Funding
National Natural Science Foundation of China (No. 11834011).
Availability of data and materials
All data generated or analyzed during this study are included in this article.
Declarations
Ethics approval and consent to participate
Not applicable.
Consent for publication
Written informed consent for publication was obtained from all participants.
Competing interests
The authors declare no conflict of interest.
