
1 Introduction
As the world’s largest developing country and CO2 emitter, China recently announced its ambitious goal of combating climate change, that is, achieving carbon neutrality by 2060. The key to achieve this goal is to decarbonize its energy system. In 2020, carbon dioxide emissions from China’s energy consumption production accounted for 87% of total emissions [1]. In the same year, China’s non-fossil energy accounts for only 15.9% of total energy consumption [2]. According to the latest government policy, this proportion will increase to more than 80% in 2060 [3]. Renewable energy, primarily wind and solar, is anticipated to become the dominant electricity source [1,4,5,6].
In the past decade, the cost of onshore wind and photovoltaic (PV) power in China has decreased by 30% and 75%, respectively [2]. In 2021, China’s onshore wind and PV power can achieve subsidy-free grid parity [2]. The rapid decline in the cost of wind power and PV technologies has laid a solid foundation for energy transition. In the future, the technical costs of wind power and photovoltaic are likely continuing to decline. According to the forecast of the International Renewable Energy Agency, in 2030, the levelized cost of global photovoltaic, photothermal power, onshore wind power and offshore wind power will decrease by 58%, 35%, 55% and 25% respectively compared with 2018 [7].
By the end of 2020, the installed capacity of wind power and solar power in China was 280 million and 250 million kilowatts (kW), accounting for 34% and 31% of the world, respectively [2]. At the United Nations Climate Ambition Summit, President Xi Jinping proposed that the total installed capacity of wind and solar power in China will reach over 1.2 billion kW in 2030, more than double that of 2020. It is estimated that to achieve carbon neutrality, China’s installed capacity of new energy will exceed 6 billion kW in 2060, more than 10 times that of 2020 [6].
However, current policymakers are not clear about “can China’s wind and solar energy endowment support its energy transition?”. Many studies have conducted initial assessments of wind and solar resources within China as a necessary precursor to utilization [8,9,10,11,12,13,14,15,16,17,18]. Wind energy assessments primarily use reanalysis data sets and meteorological station observations [12,13,14,15]. However, wind speeds from reanalysis data sets are not usually validated against wind mast data, while meteorological stations only measure the near-surface wind speed (at 10 m), which needs to be adjusted to the wind turbine hub height (typically 80-100 m), creating large uncertainties. Solar energy assessments typically rely on solar irradiation observations from meteorological stations [16,17,18], but less than 100 irradiation stations are operational in China, too few to accurately represent regional solar characteristics. Interpolating this limited network over China as a whole inevitably introduces large uncertainties. Recently, however, high-quality wind profile data from the China Meteorological Administration (CMA) and solar irradiation data developed by the Chinese Academy of Sciences (CAS) have become available, allowing more precise assessments of potential wind and solar energy resources (See Table 1 for a detail review on the wind/solar datasets mainly used in previous studies).
Table 1 Overview of datasets used in previous main wind and solar energy assessments in China |
| Reference | Study period | Data sources | Spatial resolution | Time resolution | Wind speed height | Validation against wind masts | Validation against solar irradiation station | |
|---|---|---|---|---|---|---|---|---|
| Wind energy assessments | [12] | 2001-2010 | 200 sites from 3TIER (https://www.3tier.com/) | Site scale | Hourly | 100 m (onshore) | No | - |
| [13] | 1979-2015 | MEERA reanalysis/ (https://gmao.gsfc.nasa.gov/reanalysis/) | ~ 56 × 61 km | Hourly | 80 m (onshore), 120 m (offshore) | No | - | |
| [14] | 1980-2018 | MEERA-2 reanalysis (https://gmao.gsfc.nasa.gov/reanalysis/) | ~ 56 × 61 km | Hourly | 100 m (offshore) | No | - | |
| [15] | 1995-2016 | CMA WRF simulation | 3 × 3 km | Hourly | 100 m (onshore and offshore) | Yes | - | |
| This study | 1995-2016 | CMA WRF simulation | 3 × 3 km | Hourly | 100 m (onshore and offshore) | Yes | - | |
| Solar energy assessments | [16] | 2001-2010 | 200 sites from 3TIER (https://www.3tier.com/) | Site scale | Hourly | - | - | No |
| [17] | 2015-2016 | GEOS-5 FP (https://gmao.gsfc.nasa.gov/) | ~ 25 × 30 km | Hourly | - | - | No | |
| [18] | 2015 | ERA5-Land (https://cds.climate.copernicus.eu/) | ~ 10 × 10 km | Hourly | - | - | No | |
| This study | 2007-2014 | CAS Satellite-based model | 5 × 5 km | Hourly | - | - | Yes |
Note: ‘-’ indicates data not provided or not relevant |
By 2020, the single capacity of the mainstream onshore wind turbine in China has increased to 2.0 ~ 2.9 MW (the maximum is 5 MW), an increase of 76% compared with 2010. The single capacity of mainstream offshore wind farms has reached more than 5 MW (maximum 10 MW), an increase of 85% compared with 2010 [19]. The average conversion efficiency of mainstream single crystal cells produced on a large scale in China reached 22.8% in 2020, an increase of 62.9% compared with 2010 [20]. Rapid technological progress (i.e., the upsizing of wind turbines and the improvement of photovoltaic module efficiency) requires us to re-examine China’s wind and solar energy resource reserves. Under this background, based on the high spatial-temporal resolution and high-quality climate data and the mainstream wind turbines and PV modules, this study has carried out a refined assessment of the wind and PV power generation potential at the provincial scale in China, which considers the technical, policy, and economic constraints of renewable energy development.
2 Data and methodology
2.1 Wind power assessment
This study assesses the wind power by using the high spatial and temporal resolution database of wind energy resources developed by the National Climate Center of China Meteorological Administration. The horizontal resolution of the data is 3 km × 3 km, the time resolution is 1 h, and the time length is from 1995 to 2016 (Fig. 1A). The numerical simulation uses four-dimensional data assimilation technology to integrate the global atmospheric circulation mode lattice reanalysis data, sea surface temperature data, more than 2400 ground weather stations and more than 160 sounding meteorological stations. The comparation of the measured wind speed and numerical simulated wind speed based on the wind energy resources observation network of the China Meteorological Administration show that the relative error of 49% of the wind mast tests is less than 5%; 28% of the tests is 5 to 10%; 14.4% of the tests is 10 to 15%; 5.6% of the tests is 15-20%; the relative error of 3% of the wind tower is greater than 20%. Compared with commonly used global reanalysis data sets (such as MERRA-2 and ERA5), the data set has higher accuracy and quality [15].
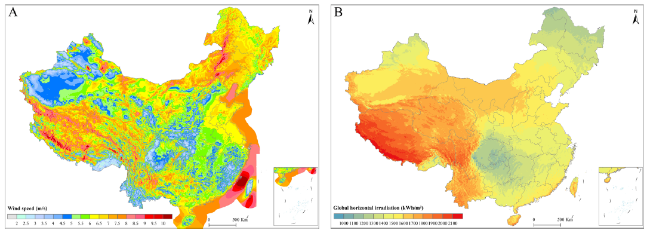
Fig. 1 A Spatial distribution of annual mean wind speed in 1995-2016 on land and offshore China at 100 m; B Spatial distribution of global horizontal irradiation in 2007-2014 on land China |
At present, to make full use of wind energy resources, wind turbine manufacturers have designed wind turbines suitable for different wind speed ranges. Wind turbine manufacturers recommend wind turbine owners and enterprises to select types of wind turbine suitable for their sites where the proposed wind farm is located according to wind conditions parameters in the region, for instance, annual average wind speed. Therefore, when assessing the technical potential of wind energy resources, it is necessary to select wind turbine types suitable for different wind speed grades when calculating the technical potential. This paper uses the latest types of wind turbines of Goldwind Technology Co., Ltd., which has a long-leading installed number in China [19], for follow-up analysis. Among them, four types of onshore wind turbines suitable for different wind speed ranges are selected and three types suitable for different sea areas are selected (Table 2; Fig. 2A) [21].
Table 2 Wind turbine types, parameters, and corresponding suitable area criteria |
| Turbine type | Rotor diameter (m) | Capacity (MW) | Suitable area criteria | |
|---|---|---|---|---|
| Onshore | GW150-3.0 | 150 | 3.0 | wind speed < 5.5 m/s |
| GW165-4.0 | 165 | 4.0 | 5.5 m/s ≤ wind speed < 7.5 m/s | |
| GW155-4.5 | 155 | 4.5 | 7.5 m/s ≤ wind speed < 9.2 m/s | |
| GW136-4.2 | 136 | 4.2 | wind speed ≥9.2 m/s | |
| Offshore | GW175-6 | 175 | 6 | Liaoning, Hebei, Tianjin, Shandong, Jiangsu, Shanghai |
| GW154-6.7 | 154 | 6.7 | Fujian | |
| GW175-8 | 175 | 8 | Zhejiang, Guangdong, Guangxi, Hainan | |
Note: 1 MW = 103 kW |
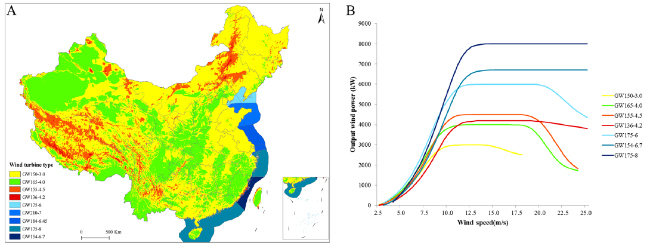
Fig. 2 A Spatial distribution of onshore and offshore wind turbine types; B Example generating power curves of wind turbines with a standard air density of 1.225 kg/m3 |
The theoretical wind power was calculated using hourly wind speed, air density, and specific wind turbine power curves (Fig. 2B). The actual wind power equals the theoretical wind power multiplied by a system efficiency coefficient, which usually ranges between 20% and 30% [22,23]; we used the average value (25%).
To identify areas suitable for onshore turbine siting, we filter data based on land use type, nature reservation areas, the distance to urban, slope, and annual utilization hours. Based on government polices [24,25] and turbine siting’s suitability, each land cover type is assigned a maximum utilization coefficient (Table 3) [11,21]. The land cover type data is obtained from Chinese Academy of Sciences (CAS), with a spatial resolution of 1 km [26]. Nature reservation areas are not allowed to install turbines without government authorization. The distribution of nature reserves is available from the United Nations Environmental Programme [27]. Areas within 500 m around the “urban areas” are also excluded to ensure the safe operation, low noise pollution, and little shadow flicker [28,29]. Areas with gentle slopes can install more wind turbines. Following current wind farm project’s experience, utilization coefficient is set to 4 levels according to the slope: Level I (slope < 3%), utilization factor is 1; Level II (slope ≥ 3% and < 6%), utilization factor is 0.5; Level III, (slope ≥ 6% and < 30%), utilization factor is 0.3; Level IV (slope ≥ 30%), utilization factor is 0 [11]. Slope data were derived from the Shuttle Radar Topography Mission (SRTM) Global Enhanced Slope Database with a spatial resolution of ~ 30 m. The minimum annual utilization hour required for exploitable land areas is set at 1800 h to ensure the economic costs, by consulting the Wind Energy Committee of the Chinese Renewable Energy Society [21].
Table 3 Utilization coefficients of land use type for onshore turbine siting |
| Land use type | Utilization coefficient |
|---|---|
| Water bodies, permanent wetlands, snow, ice, urban and built-up lands, closed forest | 0 |
| Shrublands | 0.2 |
| Croplands | 0.25 |
| Open forest and other forest | 0.65 |
| Grasslands | 0.8 |
| Barren or sparsely vegetated | 1 |
To determine the available offshore sites for installation, we filter the data according to the influencing factors such as sea area utilization type, nature reserve, distances to coastline, water depth and annual average wind speed. According to the planning and economic cost of offshore wind farm projects, we use the latest coastline dataset and set up a 200 km coastline buffer zone [30]. The water depth data comes from the latest General Bathymetric Chart of the Oceans with a spatial resolution of ~ 500 m [31]. We regard the sea area with water depth less than or equal to 50 m as near sea, and the sea area with water depth of 50-100 m as far-reaching sea. As wind turbines in coastal areas may interfere with fishing and leisure activities, wind turbines shall not be installed in sea areas less than 10 km offshore without government approval [32]. In addition, without the authorization of the government, wind turbines shall not be installed in nature reserves. Finally, a map is constructed based on the maximum utilization coefficient of each grid unit where the wind turbine is located, and the maximum utilization coefficient ranges from 0 to 1 (Fig. 3A).
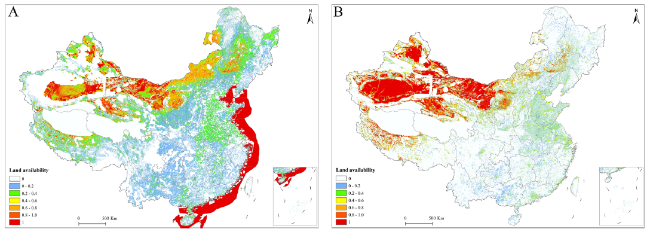
Fig. 3 Spatial distribution of the utilization coefficient for (A) turbine siting and (B) PV siting |
According to the available area of wind turbine sites and considering the actual situation of mountainous and plain terrain, this paper sets the distance between onshore turbines to be 3 D × 10 D, where D refers to the diameter of fan impeller (by consulting the Goldwind Technology Co., Ltd.). Considering factors such as reserving 20% of sea area as wind speed recovery zone and the wake being larger than that on land, this paper sets the distance between offshore turbines to be 5 D × 10 D [21,33].
2.2 PV power assessment
PV power is assessed using the solar irradiation data from the CAS, with a spatial resolution of 5 km and a time period of 2007-2014 (Fig. 1B). To produce this dataset, an artificial neural network (ANN)-based algorithm is built by combining Moderate Resolution Imaging Spectroradiometer (MODIS) cloud products and Multifunctional Transport Satellite (MTSAT) data to estimate cloud parameters (cloud mask, effective particle radius, and liquid/ice water path) from MTSAT imagery at the first. Then, the estimated cloud parameters and other information (such as aerosols, ozone, and precipitable water) are entered into a parameterization model to calculate horizontal solar irradiation. By independent validation against both experimental data and operational station data in China, the accuracy and quality of these data were determined to be comparable to or higher than two commonly used solar radiation products (GLASS and ISCCP-FD) with coarser spatial resolution [34].
Following previous work [17,35], the solar photovoltaic model used in this study considers the influence of ambient temperature, wind speed, optimum tilt, azimuth angel, and etc., on power output efficiency. Specifically, the hourly solar photovoltaic power output was calculated using the model modified from [36] as follows:
$ P_{p\nu}=\mathfrak{n}_{PV,STC}[1+\frac{\mu}{\mathfrak{n}_{PV,STC}}(T_{a}-T_{STC})+\frac{\mu}{\mathfrak{n}_{PV,STC}}\frac{9.5}{5.7+3.8\nu}\frac{(NOCT-20)}{800}\\(1-\mathfrak{n}_{PV,STC})\times G_{g,t}]\frac{G_{g,t}}{R_{STC}}\times A_{PV}\times K\times\alpha $
where Ppv is the power output from the PV system (W); ŋPV, STC is the efficiency of the PV module under standard test conditions (STC); μ is the temperature coefficient of the output power (~ 0.043%/°C); Ta is the ambient temperature (°C); TSTC is the standard test conditions temperature (25 °C); ν is the wind speed (m/s); NOCT is the nominal operating cell temperature (45 °C); APV is the PV array areas related to the PV array power peak (m2); Gg, t is the global solar irradiation on the titled surface (W/m2); RSTC is the solar light intensity under the standard test conditions, and its value is 1000 W/m2; K is the ratio of the optimal slope total irradiance to the global horizontal irradiance. The optimal slope total irradiance at 2461 ground stations in China was calculated using the Klein-Hay model [37,38], and the K at the 2461 ground stations are spatially interpolated to get each value at each pixel. α is the system efficiency coefficient, which takes the aging effect, shading, packing factor, ground reflectance loss, and etc., into account. The value is set as 0.8 according to the China PV industry development roadmap of 2018 [11,21,39]. The 3-hourly ambient temperature data is retrieved from ERA-interim reanalysis and interpolated to hourly scale. The hourly wind speed is obtained from NCC, CMA.
To identify areas suitable for PV siting, we use land use type, nature reservation areas, slope, and annual utilization hours as criteria to filter data. Based on government polices [40,41] and PV siting’s suitability, each land cover type is assigned a maximum utilization coefficient (Table 4) [21]. The land cover type data is also obtained from CAS. Concentrating PV are most suitable for siting in open and flat areas, while distributed PV are not limited by the slope [42]. We set 3% as the maximum permissible slope for concentrating PV siting. The minimum annual utilization hour required for exploitable land areas is set at 1000 h to ensure the economic costs, by consulting the Photovoltaic Committee of the Chinese Renewable Energy Society. Consequently, we construct a map that depicts the maximum utilization coefficient per grid cell for PV siting, ranging from 0 to 1 (Fig. 3B) [21]. The land use conversion factors usually have uncertainties depending on the technology and local condition. In this study, we use the average 30 MW/km2 for PV based on interview with solar project developers [16,21].
Table 4 Utilization coefficients of land use type for PV siting |
| Land use type | Utilization coefficient |
|---|---|
| Water bodies, permanent wetlands, snow, ice, forests, closed grasslands, croplands | 0 |
| Shrublands | 0.2 |
| urban and built-up lands | 0.5 |
| Sparse grasslands | 0.8 |
| Barren or sparsely vegetated | 1 |
3 Results
3.1 The technical potential of onshore wind power in China
Based on the high spatial-temporal resolution wind data and the latest types of wind turbines, this paper calculates the wind power generation, where the technical, policy and economic limiting factors of the development of wind energy resources are comprehensively considered. Through GIS analysis, the technical potential of onshore wind energy resources at 100 m in China is about 8.69 billion kW (Table 5). The spatial pattern of onshore wind power technical potential in China is basically the same as that of wind energy resource endowment. In terms of regions, the technical potential of onshore wind power in the “Three Northern” regions (Northeast, Northwest, and North China) accounts for 68.67% of the country’s total. While that in the Southern Middle East regions (Central China, East China, and South China) accounts for 31.33%. In terms of specific provinces, the largest potential of onshore wind power can be developed in West Inner Mongolia, higher than 2 billion kW, followed by Heilongjiang, East Inner Mongolia, Xinjiang, and Tibet. The technical potential of onshore wind power in these provinces (regions) is greater than 500 million kW, while that in Zhejiang, Hainan, Chongqing, Fujian, Taiwan, Shanghai, Beijing, and Hong Kong is small, less than 50 million kW.
Table 5 The wind and PV power potential and electricity demand in 2020 |
| Regional grid | Province | Installed capacity (million kW) | Power (109 kWh) | Electricity consumption (109 kWh) | ||||||
|---|---|---|---|---|---|---|---|---|---|---|
| Wind | Onshore wind | Offshore wind (Near/Far) | PV | Central PV | Distributed PV | Wind | PV | |||
| Northeast | East Inner Mongolia | 619 | 619 | 0 | 923 | 835 | 88 | 1744 | 1296 | 62.8 |
| Heilongjiang | 706 | 706 | 0 | 301 | 149 | 152 | 1937 | 394 | 101.4 | |
| Jilin | 304 | 304 | 0 | 356 | 243 | 113 | 861 | 466 | 80.5 | |
| Liaoning | 289 | 176 | 113 (80/33) | 191 | 17 | 174 | 777 | 238 | 242.3 | |
| Northwest | Gansu | 321 | 321 | 0 | 2758 | 2682 | 76 | 718 | 4128 | 137.6 |
| Ningxia | 82 | 82 | 0 | 282 | 253 | 29 | 241 | 391 | 103.8 | |
| Qinghai | 186 | 186 | 0 | 3914 | 3886 | 28 | 379 | 6491 | 74.2 | |
| Shaanxi | 165 | 165 | 0 | 372 | 298 | 75 | 448 | 458 | 174.1 | |
| Xinjiang | 618 | 618 | 0 | 21198 | 21054 | 144 | 1293 | 29265 | 299.8 | |
| North | Beijing | 0 | 0 | 0 | 61 | 2 | 59 | 0 | 72 | 114 |
| Hebei | 334 | 281 | 53 (53/0) | 338 | 59 | 279 | 988 | 587 | 393.4 | |
| Shandong | 596 | 296 | 300 (178/122) | 417 | 21 | 395 | 1636 | 552 | 694 | |
| Shanxi | 127 | 127 | 0 | 311 | 194 | 117 | 364 | 439 | 234.2 | |
| Tianjin | 15 | 11 | 4 (4/0) | 42 | 0 | 42 | 42 | 50 | 87.5 | |
| West Inner Mongolia | 2078 | 2078 | 0 | 8537 | 8395 | 142 | 5399 | 12871 | 327.1 | |
| Southeast | Chongqing | 43 | 43 | 0 | 22 | 1 | 21 | 108 | 3 | 118.7 |
| Guizhou | 109 | 109 | 0 | 104 | 76 | 28 | 296 | 105 | 158.6 | |
| Sichuan | 223 | 223 | 0 | 157 | 75 | 82 | 621 | 182 | 286.5 | |
| Tibet | 524 | 524 | 0 | 3332 | 3327 | 4 | 1375 | 6177 | 8.2 | |
| South | Guangdong | 677 | 141 | 536 (220/316) | 202 | 19 | 182 | 1977 | 257 | 692.6 |
| Guangxi | 250 | 181 | 69 (69/0) | 187 | 101 | 86 | 708 | 222 | 202.5 | |
| Hainan | 246 | 45 | 201 (41/160) | 29 | 10 | 19 | 563 | 33 | 36.2 | |
| Taiwan | 10 | 10 | 0 | 28 | 0 | 28 | / | / | / | |
| Xianggang | 0 | 0 | 0 | 3 | 0 | 3 | / | / | / | |
| Yunnan | 132 | 132 | 0 | 115 | 60 | 55 | 374 | 159 | 202.6 | |
| Central | Henan | 291 | 291 | 0 | 303 | 14 | 289 | 869 | 377 | 339.2 |
| Hubei | 206 | 206 | 0 | 157 | 33 | 124 | 558 | 188 | 214.4 | |
| Hunan | 174 | 174 | 0 | 91 | 9 | 83 | 462 | 96 | 192.9 | |
| Jiangxi | 152 | 152 | 0 | 97 | 27 | 70 | 423 | 109 | 162.7 | |
| East | Anhui | 225 | 225 | 0 | 233 | 11 | 222 | 679 | 280 | 242.8 |
| Fujian | 321 | 32 | 289 (159/130) | 91 | 18 | 73 | 957 | 102 | 248.3 | |
| Jiangsu | 441 | 177 | 264 (242/22) | 302 | 5 | 297 | 1200 | 372 | 637.4 | |
| Shanghai | 55 | 10 | 45 (36/9) | 38 | 0 | 37 | 150 | 51 | 157.6 | |
| Zhejiang | 429 | 50 | 379 (113/266) | 112 | 4 | 108 | 1163 | 121 | 483 | |
| National | 10948 | 8694 | 2254 | 45604 | 41878 | 3726 | 29308 | 66529 | 7511 | |
3.2 The technical potential of offshore wind power in China
The technical potential of offshore wind energy resources at 100 m in China is about 2.25 billion kW (Table 5). For specific provinces, Guangdong has the largest technically exploitable offshore wind power, 536 million kW, followed by Zhejiang, Shandong, Fujian, Jiangsu, and Hainan. The technical potential of offshore wind power in those provinces each is greater than 200 million kW, while those in Guangxi, Hebei, Shanghai, and Tianjin are less than 100 million kW. Divided by water depth (near sea: 5-50 m deep, far-reaching sea: 50-100 m deep), Jiangsu has the largest technical exploitation capacity of near sea wind power, 242 million kW, followed by Guangdong, Shandong, Fujian, and Zhejiang. The technical potential of near sea wind power in those provinces is greater than 100 million kW each. Guangdong province has the largest technical potential of far-reaching wind power, which is about 316 million kW. Next are Zhejiang, Hainan, Fujian, and Jiangsu. The technical potential of far-reaching offshore wind power in these two provinces is greater than 100 million kW.
3.3 The technical potential of centralized PV power in China
Based on the high spatial-temporal resolution solar data and the latest types of photovoltaic modules, this paper calculates the PV power generation, where the technical, policy and economic limiting factors of the development of solar energy resources are comprehensively considered. Through GIS analysis, the technical potential of land centralized photovoltaic power in China is about 41.88 billion kW (Table 5). The spatial pattern of the technical potential of China’s centralized photovoltaic power is basically the same as the spatial pattern of solar energy resource endowment. In terms of regions, the technical potential of centralized photovoltaic power in the “Three Northern” regions (Northeast, Northwest, and North China) accounts for 90.95% of the country’s total. Centralized photovoltaic power in the Southern Middle East (Central China, East China, and South China) accounts for only 9.05% of the country’s total. For specific provinces, Xinjiang has the largest potential of centralized photovoltaic power, higher than 20 billion kW, followed by West Inner Mongolia, Qinghai, Tibet, and Gansu. The technical potential of centralized photovoltaic power in these provinces is greater than 2 billion kW. Guangdong, Fujian, Liaoning, Henan, Anhui, Hainan, Hunan, Jiangsu, Zhejiang, Beijing, Chongqing, Tianjin, Shanghai, Taiwan, and Hong Kong have small technical potential of centralized PV power, less than 20 million kW.
3.4 Technical potential of distributed PV power in China
The technical potential of distributed PV power in China is about 3.73 billion kW (Table 5). In terms of regions, the technical potential of distributed photovoltaic power in the “Three Northern” regions (Northeast, Northwest, and North China) accounts for 51.34% of the country’s total, while that in the Southern Middle East Region (Central China, East China, and South China) accounts for 48.66%. In terms of specific provinces, Shandong has the largest technical potential of distributed PV power, close to 400 million kW, followed by Jiangsu, Henan, Hebei, and Anhui. The technical potential in those provinces each is larger than 200 million kW. The technical potential of distributed photovoltaic power in Tianjin, Shanghai, Ningxia, Qinghai, Guizhou, Taiwan, Chongqing, Hainan, Tibet, and Hong Kong is small, all less than 50 million kW.
3.5 Comparison with other studies
The relevant results of wind power generation potential in this study and the comparison with [12,13,14,15] are summarized in Table 6, and those studies also evaluate the wind power generation potential in China. These differences are attributable to wind speed data and analysis techniques, wind farm layout assumptions, turbine technologies, and physical constraints on available onshore and offshore sites. The results of wind capacity potential and power potential in this study are higher than Ref. [12], Ref. [13] and Ref. [15]. This is mainly because we have considered the technological advance of wind turbines and used the latest wind turbine types for power calculation. For example, in Ref. [12], Goldwind 2 MW wind turbine was applied for onshore power simulation, and Vestas 3 MW wind turbine was use for offshore power simulation. In Ref. [13], the wind power densities were calculated using 80 m hub height Sinovel 1.5 MW (onshore) and 120 m hub height Sinovel 5 MW (offshore) turbine power curves. In Ref. [15], Goldwind 2.0 MW, 2.2 MW, 2.5 MW, and 3.4 MW were applied for onshore power simulation, and Goldwind 6.45 MW, and 6.7 MW were use for offshore power simulation. And in this study, we use Goldwind 3.0 MW, 4.0 MW, 4.2 MW, and 4.5 MW (onshore) and Goldwind 6.0 MW, 6.7 MW, 8.0 MW (offshore). Another reason is that the threshold value of the limiting factor “the distance to urban aeras” is reduced from 3 km [15] to 500 m according to the latest policy of the National Energy Administration (which is entitled “Wind Power Deployment in Thousand Townships and 10-Thousand Villages Program”) [43] and the recommendations of the Wind Energy Committee of China Renewable Energy Society. Therefore, appropriate relaxation of these restrictions may be more in line with the actual situation. In addition, the spatial resolution (1/2°longitude by 2/3°latitude) of wind speed data used in Ref. [14] is coarse, which may overestimate the suitable area of offshore wind farms.
Table 6 Summary of relevant results of wind power generation in this study and comparison with other studies |
| Reference | Capacity potential (TW) | Power potential (PWh) | ||||
|---|---|---|---|---|---|---|
| Wind | Onshore wind | Offshore wind | Wind | Onshore wind | Offshore wind | |
| [12] | 1.3-2.27 | 0.83-1.8 | 0.47 | - | 1.24-2.64 | 0.81 |
| [13] | - | - | - | 13.1-39.5 | - | 1.5-5.6 |
| [14] | - | - | 3.4 | - | - | 11.85 |
| [15] | 4.3 | 3.9 | 0.4 | - | - | - |
| This study | 10.95 | 8.69 | 2.25 | 29.3 | 21.4 | 7.91 |
Note: ‘-’ indicates data not provided or not relevant. 1 TW = 109 kW. 1 PWh = 1012 kWh |
The relevant results of PV power generation potential in this study and the comparison with [16,17,18] are summarized in Table 7, and those studies also evaluate the PV power generation potential in China. These differences are attributable to solar irradiation data and analysis techniques, PV module technologies, and physical constraints on available PV sites. The PV capacity potential and power potential are in this study are closer to Ref. [16], but lower than Ref. [17,18]. This is mainly because we have considered stricter policy conditions. For example, in Ref. [17] the upper limit of the slope is set to 7%, in Ref. [18] it is set to 15%, and in this study, the upper limit is set to 3%. The main reason for this setting is that the land use requirements for PV power station projects are becoming more and more strict [44]. In addition, under the incentive of the new policy (known as “Promoting Countywide Distributed Photovoltaic Development”) [45], we assumed that distributed PV would usher in a broader space for development compare with Ref. [16].
Table 7 Summary of relevant results of PV power generation in this study and comparison with other studies |
| Reference | Capacity potential (TW) | Power potential (PWh) | ||||
|---|---|---|---|---|---|---|
| PV | Central PV | Distributed PV | PV | Central PV | Distributed PV | |
| [16] | 39.51 | 39.3 | 0.21 | 70.17 | 69.9 | 0.27 |
| [17] | 58.9 | - | - | 100.8 | - | - |
| [18] | 79.464 | - | - | 131.942 | - | - |
| This study | 45.6 | 41.9 | 3.7 | 66.5 | 62 | 4.5 |
Note: ‘-’ indicates data not provided or not relevant. 1 TW = 109 kW. 1 PWh = 1012 kWh |
4 Conclusions
Decarbonization of the energy system is the key to China’s goal of achieving carbon neutrality by 2060. However, the potential of wind and photovoltaic (PV) to power China remains unclear, hindering the holistic layout of the renewable energy development plan. Here, we used the wind and PV power generation potential assessment system based on the GIS method to investigate the wind and PV power generation potential in China. Firstly, the high spatial-temporal resolution climate data and the mainstream wind turbines and PV modules, were used to assess the theoretical wind and PV power generation. Then, the technical, policy and economic (i.e., theoretical power generation) constraints for wind and PV energy development were comprehensively considered to evaluate the wind and solar PV power generation potential of China in 2020. The results show that China is endowed with rich wind and solar energy resources. In terms of the national total volume, the technical potential of wind power and PV power in China is much greater than the installed capacity of scenery in carbon neutrality scenarios. It is estimated that wind and PV installed capacity in China will exceed 6 billion kW in 2060 to achieve carbon neutrality. Under the current technological level, the wind and PV installed capacity potential of China is about 56.55 billion kW, which is approximately 9 times of those required under the carbon neutral scenario. The wind and PV power generation potential of China is 95.84 PWh annually, 12.78 times the electricity demand of China in 2020.
Specifically, the technical potential of wind power at 100 m in China is about 10.95 billion kW, including 8.69 billion kW onshore wind power and 2.25 billion kW offshore wind power. The technical potential of PV power in China reaches about 45.6 billion kW, including 41.88 billion kW centralized PV and 3.73 billion kW distributed PV.
According to the above evaluation, by the end of 2020, the installed capacity of wind and solar power in China was only less than 1% of the technical potential, of which the installed capacity of wind power is 280 million kW, only less than 2.6% of the technical potential, and the installed capacity of PV is 250 million kW, only less than 0.6% of the technical potential [2].
China’s “Three Northern” region is rich in wind energy and solar energy resources. The total technical potential of onshore wind and PV power amounts to 50.57 billion kW, accounting for 87.12% of the country’s total (Fig. 4). In addition, the terrain in those regions is relatively flat, and it is recommended to build a large-scale new energy base in the area.
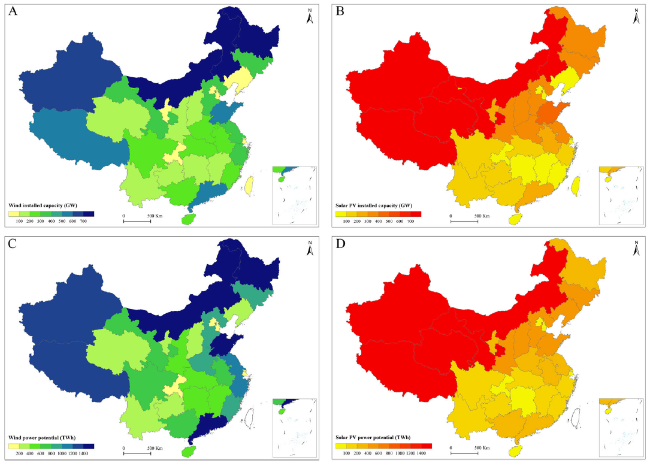
Fig. 4 The wind and PV capacity potential and power potential across mainland China. A The wind capacity potential across mainland China. B The PV capacity potential across mainland China. C The wind power across mainland China. D The PV power across mainland China |
Central and southeast China is abundant in wind and solar energy. The technical potential of onshore wind power and photovoltaic power in this area is 8.33 billion kW. The technical potential of distributed PV power is 1.81 billion kW, accounting for nearly half of the country’s total. At the same time, the region is close to the load center. It is recommended to give priority to the use of local distributed PV resource.
China’s offshore wind energy reserves are also very rich. The technical potential of offshore wind power at 100 m is about 2.25 billion kW, of which the technical potential of near sea wind energy resources is about 1.20 billion kW, and that of far-reaching wind energy resources is about 1.06 billion kW. The annual generated offshore wind power in China is 7.91 × 10¹² kWh, 2.04 times of the electricity consumption (3.88 × 10¹² kWh) in 11 coastal provinces in 2020.
Abbreviations
PV:Photovoltaic;IRENA:International Renewable Energy Agency;CMA:China Meteorological Administration;NCC:National Climate Center;WRF:Weather Research and Forecasting Model;GIS:Geographic Information Systems;MERRA-2:The Modern-Era Retrospective Analysis for Research and Applications, Version 2;ERA5:The European Centre for Medium-Range Weather Forecasts Reanalysis, Version 5;ANN:Artificial Neural Network;MODIS:Moderate Resolution Imaging Spectroradiometer;MTSAT:Multifunctional Transport Satellite;GLASS:Global Land Surface Satellite;CAS:Chinese Academy of Sciences;GEOS-FP5:Version 5 of the Goddard Earth Observing System Forward Processing;ISCCP-FD:International Satellite Cloud Climatology Project F-Series of Products;ν:The wind speed;P pv :The actual solar photovoltaic power output;P PV, STC :The rated power of the PV array under standard test conditions;η PV, STC :The efficiency of the PV array under standard test conditions;μ :The temperature coefficient of the output power;STC:The standard test conditions;T a :The ambient temperature;T STC :The standard test conditions temperature;ν:The wind speed;NOCT:The nominal operating cell temperature;A PV :The PV array areas (m2) related to the PV array power peak;G g, t :The global solar irradiation on the titled surface;R STC :The solar light intensity under standard test conditions;K :The ratio of the optimal slope total irradiance to the global horizontal irradiance;α :The system efficiency coefficient
Authors’ Contributions
QC, and YW, conceptualized the study; YW, and LZ performed the GIS analyses in this study; RC performed numerical calculations and experiments; YW wrote the first draft manuscript, QC, LZ, and RC revised it. The author(s) read and approved the final manuscript.
Funding
The authors gratefully acknowledge the research support of the National Key Research and Development Program of China (Grant No.2018YFC1509000), the National Natural Science Foundation of China (Grant No. 42175191), and the Second Tibetan Plateau Scientific Expedition and Research Program (Grant No. 2019QZKK1001).
Availability of data and materials
The wind profile data can be accessed from National Climate Center of China Meteorological Administration under reasonable request. The solar irradiation data can be accessed from Chinese Academy of Sciences under reasonable request.
Declarations
Ethics approval and consent to participate
Not applicable.
Consent for publication
Not applicable.
Competing interests
Authors declare no competing interests.
