Electrochemical kinetics experiments were carried out to study the electrocatalytic effect of a series of samples in sulfur reduction reaction and sulfur evolution reaction. Cyclic voltammetry (CV) measurements were performed at scanning rates of 0.1‒0.5 mV s
−1 (Fig. S16) to investigate the redox characteristics. During the discharge process, the two characteristic cathodic peaks could be attributed to the formation of soluble LiPSs (2.2‒2.3 V) and insoluble Li
2S
2/Li
2S (1.9‒2.1 V), respectively [
54]. Meanwhile, the anodic peak at 2.4 V corresponds to the decomposition of Li
2S during the charge process (
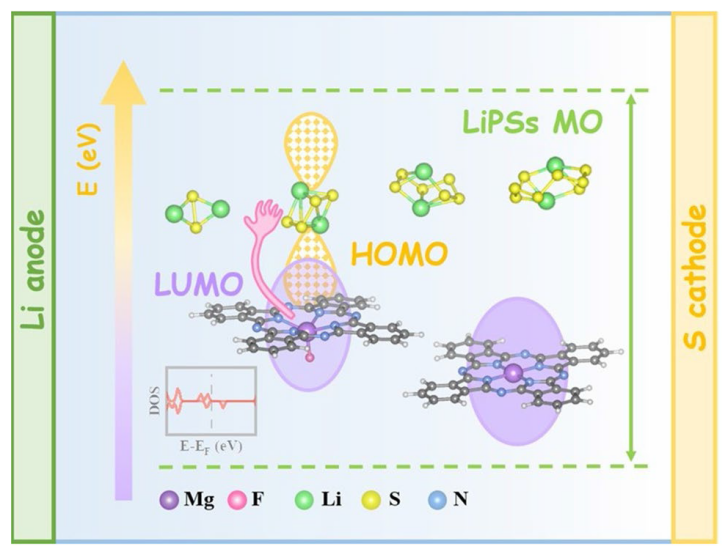
Fig. 3a). It can be seen that MgPc@FCNT shows the greater current response and lower polarization voltage than the other three catalysts due to the superior electrocatalytic activity of the unique Mg‒N
4F sites [
55]. The current densities for the cathodic and anodic peaks are linear with the square root of scanning rate, indicating the diffusion limiting process (Fig. S17). Therefore, the classical Randles Sevcik equation can be used to evaluate the diffusion characteristics of Li ions:
Ip = (2.69 × 10
5) n
1.5SD
0.5Cν
0.5, where
Ip is the current density of peak,
n is the number of charge transfer,
S is the electrode area,
D is the diffusion coefficient of Li ions,
C is the concentration of Li ions in the electrode, and
ν is the scan rate [
56]. MgPc@FCNT shows the highest Li ion diffusion coefficient for the three redox peaks (
Fig. 3b), which confirms that the axial coordination effect of electron-withdrawing group F promotes the LiPSs conversion in Li-S batteries. In addition, the Tafel slope corresponding to each peak can be calculated based on the linear sweep voltage (LSV) curve, which is an index to evaluate the catalytic activity [
57]. The smaller Tafel slope exhibits, the better catalytic ability achieves. The Tafel slope for MgPc@FCNT is smaller than other samples (
Figs. 3c and S18), indicating the best catalytic activity. During the process of Li
2S deposition, Li
2S
6 solution was used as electrolyte. After discharging to 2.06 V via galvanostatic method, potentiostatic method is operated at 2.05 V (
Figs. 3d and S19). The typical potentiostatic I-t curves may be separated into three regions by two exponential functions: the reduction of Li
2S
8 and Li
2S
6 (dark areas), and the precipitation of Li
2S (light area) [
58]. According to the integral area, the Li
2S deposition capacity for MgPc@FCNT (134.78 mAh g
−1) is significantly higher than that of MgPc@CNT (70.3 mAh g
−1). The higher Li
2S capacity suggests the improved kinetics in Li-S batteries. Therefore, this result confirms that MgPc@FCNT is the most advantageous in terms of reaction kinetics and catalytic activity for the reduction of LiPSs to Li
2S. The CV curves of the symmetrical cells were collected in Li
2S
6 electrolyte with a scanning rate of 1 mV s
−1. All cells show a pair of symmetrical redox peaks (
Fig. 3e). Compared with the MgPc@CNT, FCNT and CNT, MgPc@FCNT exhibits the strongest oxidation-reduction peaks, indicating the optimized electrochemical kinetics in Li-S batteries.


