HIGHLIGHTS
1 Introduction
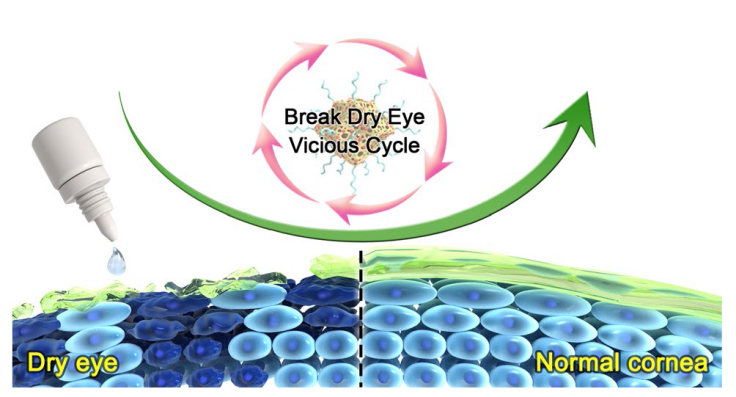
Scheme 1 Schematic diagram of the synthesis of dual-atom nanozyme and break the DED vicious cycle by inhibiting NLPR3 inflammasome activation |
2 Experimental and Methods
2.1 Preparation of DAN
2.2 In vitro Antioxidative Properties
2.3 In vitro Anti-Apoptotic Properties
2.4 In vitro Anti-Inflammatory Properties
2.5 Western Blot Analysis
2.6 In vivo Therapeutic Efficacy Assessment on DED
2.6.1 Animal Models of DED
2.6.2 Tear Secretion Assessment
2.6.3 Corneal Opacity and Fluorescein Staining
2.6.4 Histopathological Analysis
2.7 Statistical Analysis
3 Results and Discussion
3.1 Characterization of FeMn-DA/NC
Fig. 1 Synthetic procedure, morphology, and microstructure of FeMn-DA/NC. a Synthetic schematic diagram of FeMn-DA/NC. b, c Transmission electron microscope (TEM) image and d SAED image of FeMn-DA/NC. e Corresponding energy dispersive spectroscopy (EDS) mappings of FeMn-DA/NC, where C (red), N (green), O (yellow), Fe (cyan), and Mn (amaranth) were imaged under the STEM mode. f, g ac HAADF-STEM images of FeMn-DA/NC (isolated bright dots may be pairs of Fe and Mn single-atoms) |
Fig. 2 a XANES spectra of Fe K-edge of FeMn-DA/NC and reference samples. b EXAFS fitting result of Fe in FeMn-DA/NC at K space. c Fourier transform (FT) at Fe K-edge of FeMn-DA/NC and reference samples. d XANES spectra of Mn K-edge of FeMn-DA/NC and reference samples. e EXAFS fitting result of Fe in FeMn-DA/NC at K space. f FT at Mn K-edge of FeMn-DA/NC and reference samples. Wavelet transform of g Fe foil, h Fe2O3, i Fe in FeMn-DA/NC, j Mn foil, k MnO2, and l Mn in FeMn-DA/NC |
3.2 Cytotoxicity of DAN
3.3 Effect of DAN to Scavenge ROS Production under Hyperosmolarity
Fig. 3 In vitro antioxidant effect of DAN. HCE-2 cells were pre-treated with different concentration of DAN (1, 2, 4 and 8 μg mL−1) or NAC (10 mM) before exposure to hypertonic model (HOM) as described in the methods. a Total production of intracellular ROS was measured by DCFH-DA assay and b quantitative analysis of fluorescence intensity. Scale bar: 200 μm. c Mitochondria-specific ROS scavenging activity of DAN (2 μg mL−1) and d quantitative analysis of fluorescence intensity. Scale bar: 50 μm. e Enzyme activity analysis of SOD, CAT and GPX in hypertonic-stimulated HCE-2 cells pre-treated with or without DAN (2 μg mL.−1). f Immunofluorescence and g quantitative analysis of SOD1, CAT, GPX1 and HO-1 expression. Nuclei were stained with DAPI. Scale bar: 10 μm. Data are presented as mean ± SD. *p < 0.05, **p < 0.01, ***p < 0.001 and NS p > 0.05 |
3.4 In vitro Cell-protective Activities of DAN
Fig. 4 In vitro anti-apoptotic effect of DAN. a Immunofluorescent staining of 8-OHdG under hypertonic model or pre-treated with DAN (2 μg mL−1) in HCE-2 cells. Scale bar: 10 μm. b DAN (2 μg mL−1) treatment restores mitochondrial membrane potential impairment caused by hypertonicity. Scale bar: 50 μm. Quantitative analysis of c 8-OHdG and d JC-1(J-Monomer and J-Aggregate) fluorescent intensity according to the fluorescence results. Data are presented as mean ± SD. *p < 0.05, **p < 0.01, ***p < 0.001 and NS p > 0.05 |
3.5 Inhibiting NLRP3 Inflammasome Activation by Attenuating Oxidative Stress in vitro
Fig. 5 In vitro antioxidant and anti-inflammatory mechanisms of DAN. a Double immunofluorescent staining and b quantitative analysis of fluorescent intensity results showed the fluorescence intensity of NLRP3, ASC and Caspase-1 were significantly increased in HCE-2 cells under hypertonic conditions, which were completely suppressed by DAN (2 μg mL−1). c Immunofluorescence and d quantitative analysis of fluorescent intensity results showed that DAN inhibited the expressions of IL-1β, IL-18, IL-6, NF-κB P65 and P-NF-κB P65. Scale bar: 10 μm. e Schematic representation of the inhibitory mechanism of intracellular signaling pathways and the targets of DAN. f The protein expression of SOD1, CAT, GPX1, HO-1, NLRP3, ASC, Caspase-1, IL-1β, IL-18, IL-6, NF-κB P65 and P-NF-κB P65 in the cell lysates derived from HCE-2 cells were analyzed by western blotting and g densitometry analyses of the western blotting results. Data are presented as mean ± SD. *p < 0.05, **p < 0.01, ***p < 0.001 and NS p > 0.05 |
3.6 In vivo Therapeutic Effects on DED
Fig. 6 Therapeutic efficacy of DAN on BAC-induced mice model of DED. a Timeline of the establishment of dry eye mice model and drug administration. After instillation with 5 μL 0.2% w/v benzalkonium chloride twice per day for 7 days (defined as day 0), the mice were treated with 5 μL of 0.9% w/v saline, DAN (100 μg mL−1), and 0.05% CsA twice per day, respectively. The therapeutic effects were evaluated and recorded during the therapy process. b Optical, c slit-lamp and d corneal fluorescein-stained micrographs of mice eyes under different treatments. e Opacity scores, fluorescein staining scores and tear volume of the DED mice treated with different topical eye drop solutions. f Representative H&E staining images of the cornea and g quantitative analysis of the corneal epithelial thickness. Scale bar: 100 μm. h Representative conjunctival PAS staining images and i numbers of goblet cells in each field. Three stained sections of each mouse conjunctiva were counted for statistical analysis. Scale bar: 50 μm. Data are presented as mean ± SD. *p < 0.05, **p < 0.01, ***p < 0.001 and NS p > 0.05 |
3.7 In vivo Underlying Mechanisms
Fig. 7 In vivo antioxidant, anti-apoptotic, anti-inflammatory effect of DAN. a Evaluations and b, c quantitative analysis of fluorescent intensity of ROS, apoptosis (TUNEL), 8-OHdG, NLRP3, ASC, Caspase-1, IL-1β and IL-18 expression were determined by immunofluorescence staining on the corneal epithelium in the mice eyes after topical administration of saline, DAN, CsA for DED. Scale bar: 100 μm. d Schematic diagram of the in vivo therapeutic mechanism of DED using DAN to suppress inflammation and break vicious cycle by scavenging excess ROS. Data are presented as mean ± SD. **p < 0.01, ***p < 0.001 and NS p > 0.05 |


