HIGHLIGHTS
1 Introduction
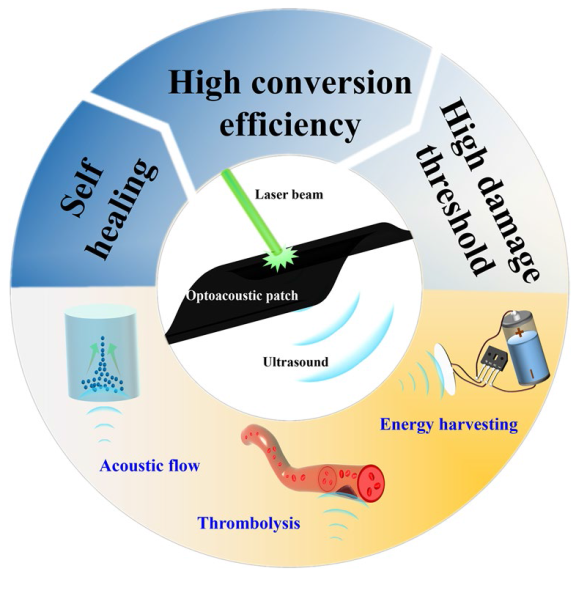
Fig. 1 Design, fabrication, and application of the self-healing optoacoustic patch. a Device preparation method. b Optoacoustic patch under 532 nm laser excitation. c Acoustic field distribution of the patch. Applications in d acoustic flow, e thrombolytic, and f wireless energy harvesting |
2 Experimental Section
2.1 Preparation of Self-healing Optoacoustic Patches
2.2 Device Performance Test
2.3 Acoustic Flow Experiment
2.4 Thrombolytic Experiment
2.5 Wireless Energy Harvesting Experiment
3 Results and Discussion
3.1 Fabrication and Characterization of the Self-healing Optoacoustic Patch
Fig. 2 Acoustic performance test of the self-healing optoacoustic patch. a Size/shape of the ordinary PDMS and self-healing PDMS (10.0 wt% CNT). b Comparison of thermogravimetric analysis between the self-healing PDMS and ordinary PDMS. c DSC test of the self-healing PDMS. d Peak sound pressure output of the optoacoustic device based on the self-healing PDMS and ordinary PDMS under different laser intensities. Points P1 and P2 represent the peak points of fitted curves. e Heat map of laser damage thresholds between the self-healing patch and ordinary device. The left patches are at the initial state, and the right are post-damage, on a scale bar of 50 μm. f Laser absorption in different CNT concentrations (0.0, 4.0, 5.0, 6.7, 8.3, and 10.0 wt%). g Changes of peak sound pressure at different excitation laser energies in various CNT concentrations. h Optoacoustic energy conversion efficiency in different CNT concentrations at 10 mJ pulse−1. i Optoacoustic energy conversion efficiency with 6.7 wt% of CNT at different excitation laser intensities |
3.2 Self-healing Performance of the Optoacoustic Patch
Fig. 3 Self-healing performance examination of the self-healing optoacoustic patch. The damage track after a cut and b self-healing. c Ultrasonic peak pressure and d output waveform before cut (initial state), after cut, and after self-healing at different input laser energy. Each experiment is repeated four times. The damage track after e burning and f self-healing. g Ultrasonic peak pressure and h output waveform before burning (initial state), after burning, and after self-healing. Each experiment is repeated four times. i Schematic diagram of self-healing process. j Peak sound pressure and center frequency after several times of cut/self-healing |
3.3 Acoustic Flow Application of the Self-healing Optoacoustic Patch
Fig. 4 Acoustic flow experiment of the self-healing optoacoustic patch. a Schematic diagram of experimental design. b Setup of the experiment. c Initial state. d-g Ink state change at 10th, 20th, 30th, and 40th s after laser irradiation. h Ink state after turning off the laser for 2 s. i-k Ink state change at 5th, 15th, and 21th s after turning on the laser again. l Ink state after turning off the laser again at 4th s |
3.4 Thrombolytic Application of the Self-healing Optoacoustic Patch
Fig. 5 Thrombolytic experiment of self-healing optoacoustic patch. a Schematic diagram of experimental design. b Setup of the experiment. c State changes of thin blood clots at the initial moment, 2th, 5th, 10th, 15th, and 20th minute of optoacoustic action. d Thin blood clot in its initial state and after 20 min of ultrasound treatment. e Normalized mass change curve of thin blood clots, in which the control group (red line) without ultrasound treatment and the experimental group (green line) with ultrasound treatment (n = 4). f Changes in the state of thick blood clots at the initial moment, 5th, 10th, 20th, 30th, and 40th minute of optoacoustic application. g Thick blood clot in its initial state and after 40 mins of ultrasound treatment. h Normalized mass change curve of thick blood clots, in which the control group (red line) without ultrasound treatment and the experimental group (green line) with ultrasound treatment (n = 4) |
3.5 Wireless Energy Harvesting of the Self-healing Optoacoustic Patch
Fig. 6 Wireless energy harvesting of the self-healing optoacoustic patch. a Schematic diagram of experimental design. b Setup of the experiment. c Open circuit voltage of wireless energy harvesting devices based on self-healing optoacoustic patches at different laser intensities. d Rectification output at 5 mJ pulse−1 laser intensity. e Oscilloscope readout (40 V) of wireless energy harvesting device. f Output voltage and output power of a wireless energy harvesting device based on self-healing optoacoustic patches at the load impedances of 47, 120, 510, 1, 5, 10, 51, 100, 510 kΩ, and 1 MΩ. Each experiment is repeated four times. g Charging voltage change of the 47 μF capacitor. The inset denotes the saturation voltage. h Setup of the lighting experiment. i Open circuit voltage of pure laser driven piezoelectric ceramics. j Open circuit voltage amplification of a piezoelectric ceramic driven at 20 mJ pulse−1 laser intensity. k Oscilloscope readout (7.1 V) of a pure laser driven piezoelectric ceramic |


