图/表 详细信息
Parkinson’s disease and gut microbiota: from clinical to mechanistic and therapeutic studies
Translational Neurodegeneration,
2023, 12(0):
59.
DOI: 10.1186/s40035-023-00392-8
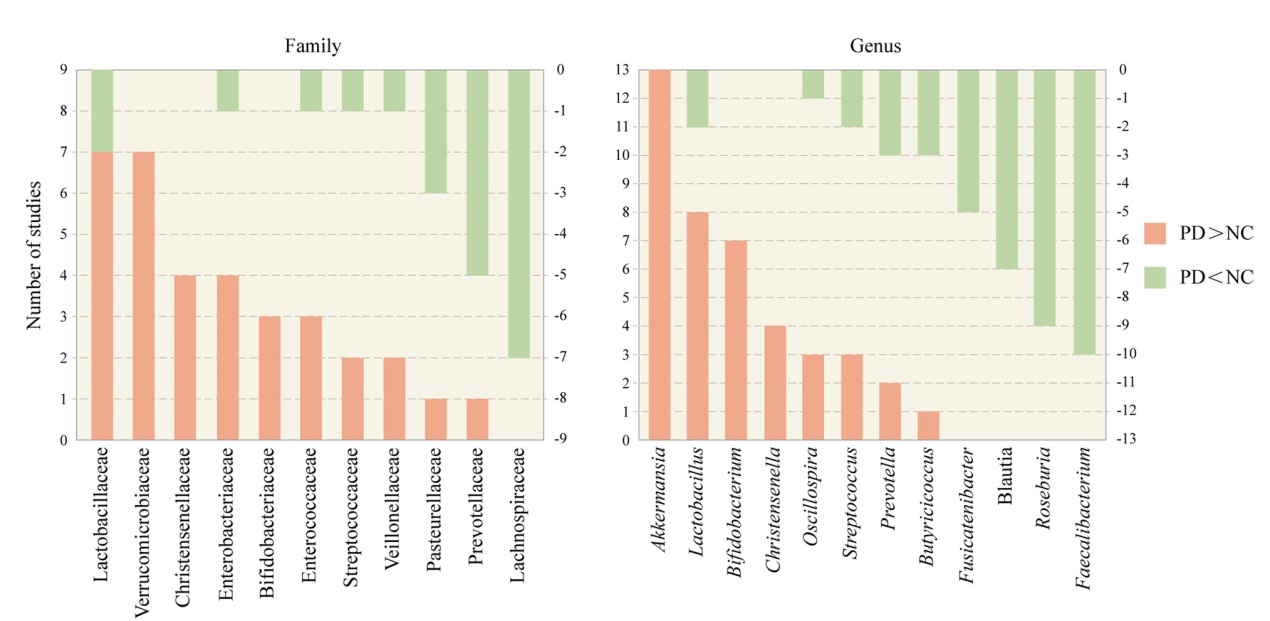
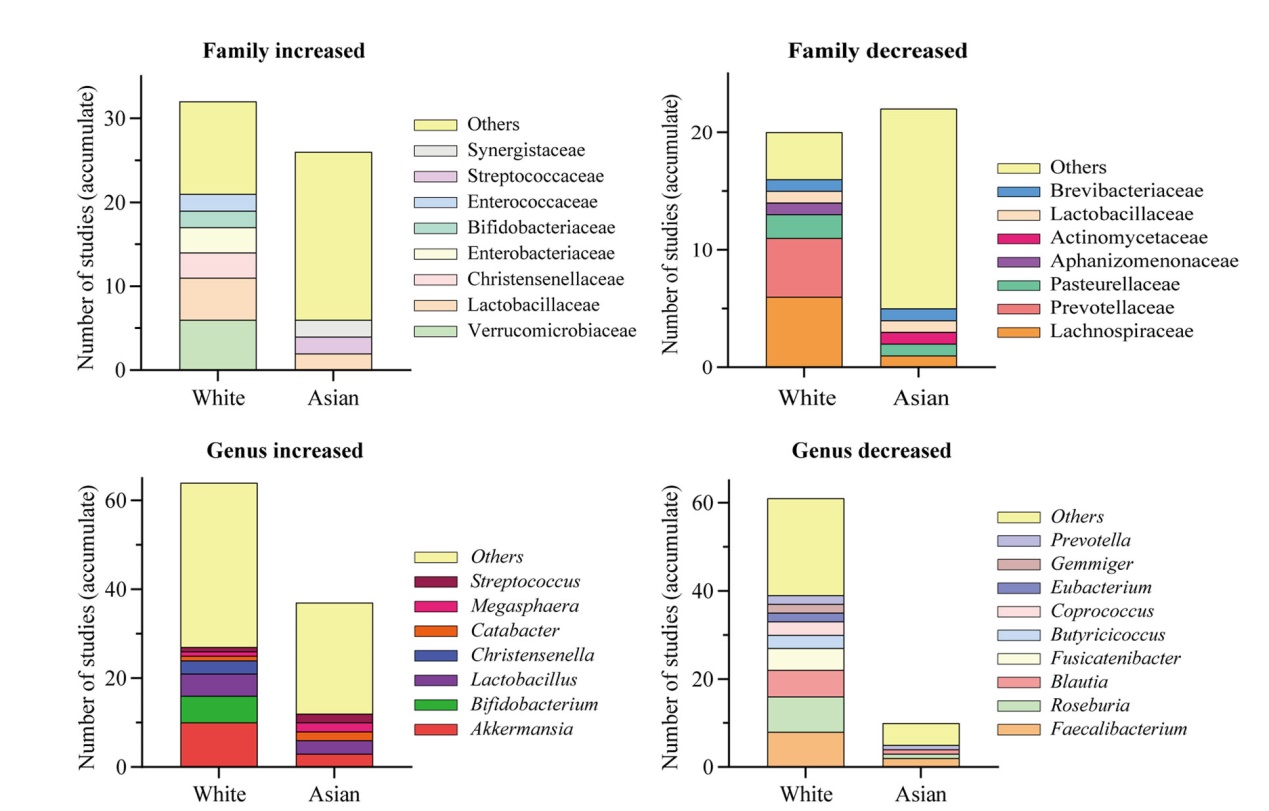
Fig. 1 The most commonly reported 11 families and 12 genera of gut microbiota that are different between the PD and the NC groups. Orange bars represent the number of studies in which PD had a higher abundance than NC. Cyan bars represent the number of studies in which PD had a lower abundance than NC. PD, Parkinson’s disease, NC, normal control
本文的其它图/表