HIGHLIGHTS
1 Introduction
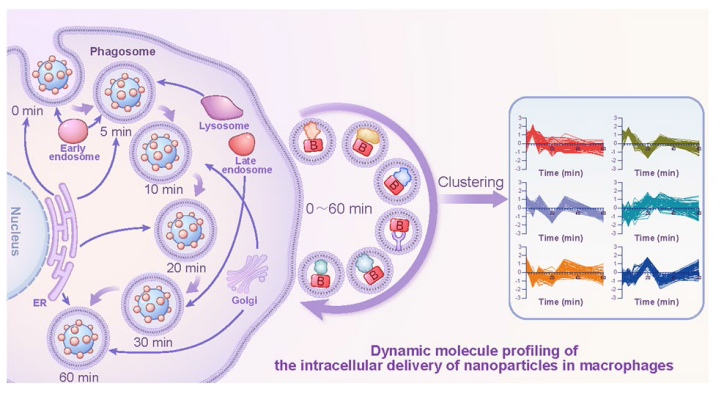
Fig. 1 Schematic diagram of the construction of HRP (+)-PNPs and schematic representation of dynamic molecular profiling of the intracellular delivery of nanoparticles in macrophages by enzyme-induced proximity labeling technology (nano-EPL) |
2 Methods and Materials
2.1 Materials
2.2 Preparation of PLGA Nanoparticles (PNPs), HRP (±)-PNPs, Cy5-PNPs, Ce6@PPNs@pEGFP and Ce6@PPNs@siRNA
2.3 Characterization of Nanoparticles
2.4 Spectrophotometric Assay of HRP Activity
2.5 Identification of the Labeling Reaction of HRP(+)-PNPs
2.6 Effect of pH/CTSB/Lipid Membrane on the Labeling Reaction of HRP(+)-PNPs
2.7 Pulse-Chase and Continuous Incubation Proximity Labeling
2.8 TEM Imaging of HRP (+)-PNPs Proximity Labeling in Cells
2.9 Colocalization of Biotinylated Proteins and Proteins-Interest
2.10 Colocalization of HRP (+)-PNPs and Subcellular Compartments
2.11 Confocal Imaging of Intracytoplasmic 70 kD FITC-Dextran, Fam-siRNA or eGFP after Photodynamic Destruction of Phagosome Membrane
2.12 Identification of Biotinylated Proteins Generated by Nano-EPL
2.13 Statistical Analysis
2.14 Data Availability
3 Results and Discussion
3.1 Enzyme-Induced Chemocatalysis in HRP (+)-PNPs Triggers the Proximity Labeling of Proteins
Fig. 2 Preparation and characterization of PNPs and HRP (±)-PNPs. a Schematic illustration of HRP (±)-PNPs preparation. b Particle size and zeta potential value of PNPs and HRP (±)-PNPs (n = 3). c TEM images of PNPs and HRP (±)-PNPs (scale bar, 0.1 μm). d Relative enzyme activity of HRP (−), HRP (±)-PNPs. e Schematic illustration of the labeling activity of HRP (+)-PNPs. g Coomassie staining and f western blot of BSA labeled by HRP. h Western blot of BSA labeled by HRP ( ±) incubated in PBS at various pH values (5.0-7.4). i Western blot of BSA labeled by HRP ( ±)-PNPs. BP-omitted, H2O2-omitted, and BSA-omitted groups were used as controls. j Silver staining analysis of BSA labeled by HRP (±)-PNPs incubated in PBS at various pH values (5.0-7.4). k Silver staining analysis of BSA labeled by HRP (+)-PNPs incubated with CTSB for 1 h. l Schematic illustration of the labeling activity of HRP (+)-PNPs within/outside of liposomes. m Western blot of BSA labeled by HRP (+)-PNPs within/outside liposomes |
3.2 Enzyme-Induced Chemocatalysis Enables the In Situ Labeling of Interacting Proteins During the Intracellular Delivery of HRP(+)-PNPs
Fig. 3 In situ labeling activity of interacting proteins during the intracellular delivery of HRP (+)-PNPs. a Schematic illustration of the two incubation methods. b Fluorescence images and c western blot and d Coomassie staining of intracellular proteins labeled by HRP (+)-PNPs through pulse-chase treatment. BP-omitted, H2O2-omitted, and BSA-omitted groups were used as controls (scale bar, 10 μm). e TEM analysis of proteins (as arrows show) labeled by HRP (+)-PNPs in phagosomes (scale bar, 0.5 μm). f Fluorescence images of intracellular proteins labeled by HRP (+)-PNPs through continuous incubation. BP-omitted, H2O2-omitted, and BSA-omitted groups were used as controls (scale bar, 10 μm) |
3.3 The Intracellular Delivery of HRP (+)-PNPs in Macrophages Is a Phagosome-Centered Process
Fig. 4 Phagosome-centered process during intracellular delivery of HRP(+)-PNPs. a Schematic illustration of the pulse-chase approach. b Fluorescence images and d quantitative image analysis of nanoparticles incubated with J774A.1 cells through pulse-chase treatment (scale bar, 10 μm). Nanoparticles (red), nuclei (blue), cytomembrane (white). c Fluorescence images and e quantitative image analysis of intracellular vesicles containing HRP(+)-PNPs at 5 time points (scale bar, 2 μm). Nanoparticles (red). f Florescence images of 70 kD dextran, h ER, i Golgi apparatus, j lysosome and HRP (+)-PNPs (scale bar, 2 μm). g Trend of colocalization assessed by regions between 70 kD dextran, k ER, l Golgi apparatus, m lysosome, and HRP (+)-PNPs over time (n = 50). n Schematic diagram of the fusion of phagosomes with different vesicles |
3.4 Nano-EPL Technology Achieves the Dynamic Molecular Profiling of Intracellular Delivery of HRP(+)-PNPs in Macrophages
Fig. 5 Dynamic molecule profiling of intracellular delivery of HRP (+)-PNPs in macrophages. a Schematic illustration of the proteomic experiment. b Fluorescence image and c western blot and d Coomassie staining of intracellular proteins labeled by HRP (+)-PNPs through the pulse-chase approach over time. (scale bar, 10 μm). e Manhattan plot for the true positive proteins at 6 time points. f LFQ intensity and g count of the true positive proteins of 6 time points. h Dynamic molecular mapping of intracellular delivery of nanoparticles |
3.5 Dynamic Molecule Profiling Based on Nano-EPL Technology Reveals a Detailed Organellar Participation Timeline During the Intracellular Delivery of HRP (+)-PNPs
Fig. 6 Proteomics analysis of the participating organelles. a Trend of proteins in each cluster after normalization. b The percentage of early endosomes (EEs), late endosomes (LEs), ER, Golgi apparatus, lysosome proteins, and enzymes in 10 clusters. c Trend of EEs, LEs, ER, Golgi apparatus, lysosome, and extracellular protein counts over time. Numbers in parentheses represent number of proteins. d Relative abundance trend of EEs, LEs, ER, Golgi apparatus, lysosome, and extracellular proteins over time |
Fig. 7 Detailed organellar participation timeline during the intracellular delivery of HRP(+)-PNPs. a Fluorescence images of GOLIM4, b ECM29, c STXBP2, d LAMP1 and biotinylated proteins (scale bar, 2 μm). Trend of colocalization assessed by regions and relative abundance between e GOLIM4, f ECM29, g STXBP2, h LAMP1 and biotinylated proteins over time (n = 50). i Schematic diagram of the dynamic subcellular organelles/phagosome fusion process during intracellular delivery of nanoparticles |
3.6 Engagement of Distinct Organelles Differentially Affects the Intracellular Delivery Efficiency of Gene Drug-Loaded Nanoparticles
Fig. 8 Intracellular delivery efficiency of gene drug-loaded nanoparticles. a Schematic illustration of Ce6@PPNs@siRNA and Ce6@PPNs@pEGFP preparation and functional steps. b Particle size and zeta potential value of PPNs, Ce6@PPNs, Ce6@PPNs@siRNA, and Ce6@PPNs@pEGFP (n = 3). c Schematic diagram of phagosome disruption caused by the photodynamic properties of Ce6@PPNs (660 nm, 200 mW cm−2, 30 s). d Fluorescence image analysis and e mean fluorescence intensity of intracytoplasmic 70 kD dextran after illumination. f Fluorescence images of cytoplasmic Fam-siRNA and g eGFP after photodynamic treatment at 5 time points (scale bar, 10 μm). Fam-siRNA and EGFP (Green). h Trend of mean fluorescence intensity of cytoplasmic Fam-siRNA and i eGFP after photodynamic treatment at 5 time points. j Schematic illustration of the optimum escape period |


