
1. Introduction
There are various pathways to superconductivity. These include unconventional routes such as gating [1], [2], [3], stacking [4], and twisting [5], and long-established techniques like intercalation [6], [7], [8], doping [9], [10], [11], and pressurization [12], [13], [14]. All methods reliably transform nonsuperconducting materials into superconductors. Pressurization has even successfully produced compounds with predicted signatures of high-temperature superconductivity [15], [16], [17].
A common characteristic of these established pathways is the generic dome-like phase diagram depicted in Fig. 1. Thus far, this hallmark feature has not been systematically linked to the chemistry or structure of superconductors. These diagrams typically illustrate superconductivity (i.e., measurable Tc) appearing within specific chemical (e.g., dopant concentration) or physical (e.g., hydrostatic pressure) control parameter values. Some also display monotonic suppression of magnetic order and/or structural transitions preceding the emergence of superconductivity [18], [19], while others allow the coexistence of these states [20], [21].
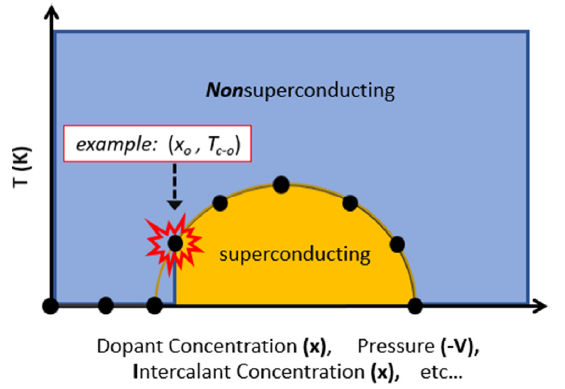
Fig. 1. Temperature versus atomic concentration x, pressurized unit cell volume V, and other control parameters, for a generic phase diagram depicting a nonsuperconducting region in blue and a dome-like superconducting region in gold. The highlighted onset point (xo, Tc−0) is defined as the minimum perturbation (e.g., atomic concentration) required for superconductivity's emergence. |
The often-serendipitous appearance of the superconducting region has long perplexed the materials science community. However, recent studies [22], [23] revealed the chemical boundary between the normal and superconducting state, as illustrated in Fig. 1, empirically follows Eq. (1) for intercalated superconductors. Notably, available data suggests the rule is independent of the possible emergence and coexistence of other quantum states (e.g., magnetism) with similar energy.
$ P_{\text {int. }-o} V=x_{o} N \kappa T_{c-o}$
The variables P, V, xo, N, κ, and Tc−o are the calculated intercalant pressure (:= Pint.−o ≈ 1 atm), unit cell volume, intercalant atomic concentration at the onset of superconductivity, number of intercalant valence electrons (:= Nint.; s and d electrons for all transition elements), Boltzmann constant, and critical temperature at the onset concentration, respectively. Since the investigated compounds have similar P, essentially, Eq. (1) implies that the calculated electron perturbation density (ρint.−o = xoN/V) for intercalates at the onset of superconductivity is inversely proportional to Tc−o. The appearance of a’critical pressure’ and its average value (∼1 atm) seem to be the only empirical feature shared among intercalated superconductors reported to date.
This report delves into the emergence of superconductivity from perturbative methods beyond intercalation. It specifically investigates near onset conditions in (1) elemental superconductors, (2) doped compounds, and (3) pressurized compounds. Therefore, only a subset of superconductors, including the most cited/investigated, are analyzed out of the thousands in existence to date. Methods used in this study do not apply to compounds like XTa2S5 [X = Mg, Ca, Sr, and Ba] [24], [25], [26], [27] or MgB2 [28] and Ba2Nb3S8I [29], which superconduct under isoelectronic conditions or without obvious perturbations (chemical or physical) from a nonsuperconducting state, respectively. Investigated compounds include iron pnictides, cuprates, bismuth sulfides, nickelates, oxyhydrides, fluorides, and many others. Results are compared to onset conditions reported for intercalated compounds [22], [23]. Comparisons involve the estimation of unit cell volumes (V) and onset perturbation densities (ρo) extracted from experimental data. Both parameters are then juxtaposed with onset transition temperatures (Tc−o). The onset perturbation density is defined as the minimum number of valence electrons (N) per formula unit per unit cell volume required for superconductivity to emerge from a nonsuperconducting compound. All data utilized in this manuscript have been sourced from previously reported experiments available on Google Scholar and are duly cited throughout the text.
2. Onset of elemental superconductivity
Empirical studies like those conducted by Matthias heavily influenced the direction of superconductivity research after the first superconductor was discovered in 1904 [30]. His work highlighted the importance of counting the total number of valence electrons a compound has per atom when attempting to predict new superconductors of particular structures or chemistries. Empirical rules regarding superconductivity evolving from particular synthesis pathways like intercalation, however, had not been discovered until recently, specifically in compounds of binary constituents and greater. This section now shifts focus to the onset of superconductivity in single-element compounds. To accomplish this, similar to the approach taken with intercalated compounds, we examine the nonsuperconducting/superconducting boundary within the periodic table of elements as a function of increasing electron number at standard temperature and pressure (STP). The landscape of known superconductors is vast and ever-growing. Nevertheless, it is important to underscore that unless a new element is discovered, the data set of single-element superconductors is uniquely complete as it represents 100% of superconductors known in their simplest chemical form to date.
Firstly, it is observed that a superconducting dome, akin to Fig. 1, is present in the periodic table of elements, as illustrated in Fig. 2. This depiction is constructed by initially considering group 1 elements Na, K, Rb, Cs, and Fr, arranged here by increasing period number and depicted in blue squares in Fig. 2. These elements, each having one valence electron in their unfilled shell, do not exhibit superconductivity at STP. Superconductivity becomes evident at STP in Al, Ti, Zr, La, and Th, represented by gold squares with red borders in Fig. 2, only when 2 to 3 electrons are added to their unfilled shells and nucleons are adjusted accordingly. These elements signify the onset of superconductivity in shells n = 3 to n = 7, marking the initial boundary separating superconductors and nonsuperconductors as electrons increase from N = 1. Beyond this boundary and beneath the “dome” of superconductors shown in Fig. 2, nearly all elemental superconductors that exist at STP, excluding lithium and beryllium, are situated.

Fig. 2. Periodic table highlighting the onset of superconductivity in elements. The thick red borderline represents the boundary between nonsuperconducting elements and the onset of superconductivity within shells 3-7. Aluminum, Titanium, Zirconium, Lanthanum, and Thorium are the first elements to show superconductivity at STP as a function of increasing electron number in shells 3-7, respectively. They are shown in gold squares. Blue squares indicate elements showing no superconductivity at STP. White squares depict unspecified transport properties unless covered by the “Dome” of superconductors encapsulating most elements exhibiting superconductivity at STP. |
Calculated perturbation densities, ρelem.#−o = Nelem//V, for all 5 onset elements are shown in Table 1 and Fig. 3 (blue circles). The subscript “#” represents period number. Like intercalated systems (Fig. 3 − red circles), the distance correlation coefficient [31], [32] for onset elements is high at dCor(Tc−o,ρelem.−o) =.76. For intercalates, dCor(Tc−o, ρint.−o) =.62. All distance coefficient calculations in this report were carried out with an in-house, self-designed, LabView VI utilizing algorithms reported by Szekely et al. [31].
Table 1. A list of nine elements which superconduct at STP. Bolded elements Al, Ti, Zr, La, and Th represent the onset of superconductivity in periods 3-7 (i.e., asterisked pressures). Elements V, Nb, Hf, and Pa are superconductors closest to onset in periods 4-7. Aluminum is the only superconductor at STP within n = 3. |
| Period (n) | [ref.] Element | Tc (K) | $ V\left(\dot{A}^{3}\right) $ | Nelem. | $ \rho_{\text {elem. }}\left(\frac{N_{\text {elem. }}}{\dot{A}^{3}}\right) $ | P (atm) |
|---|---|---|---|---|---|---|
| 3 | [33] Al | 1.175 | 66.32 | 3 | 0.045 | 7.2* |
| 4 | [34] Ti | 0.4 | 35.33 | 4 | 0.113 | 6.2* |
| 4 | [35] V | 5.4 | 27.82 | 5 | 0.179 | 132.2 |
| 5 | [36] Zr | 0.61 | 46.56 | 4 | 0.0853 | 7.1* |
| 5 | [36] Nb | 9.25 | 36.07 | 5 | 0.138 | 174.7 |
| 6 | [37], [38] La (α-β) | 4.88-6.3 | 150.29 | 3 | 0.019-0.025 | 13.3-16.3* |
| 6 | [37] Hf | 0.128 | 44.53 | 4 | 0.09 | 1.6 |
| 7 | [37] Th | 1.38 | 131.42 | 4 | 0.03 | 5.7* |
| 7 | [39] Pa | 1.4 | 48.92 | 4 | 0.081 | 15.6 |

Fig. 3. Onset perturbation density, ρo, versus transition temperature, Tc−o. |
A pressure Pelem.#−o (Eq. (2)) can be assigned to onset elements. For example, the pressure for Aluminum is Pelem.3−o = 7.2 atm, where N = Nelem. = 3, V = 66.32 Å3, and Tc−o = 1.175 K. Pressure estimates for onset elements and others are noted in Table 1. The average is 7.9 atm, as opposed to 1.3 atm for intercalated compounds. Arriving at the precise value of 1 atm for intercalates relies on the resolution and precision of the experimental data used in the analysis. Pressure estimates for elements wildly deviate from one another immediately beyond onset as shown in Table 1. See Table S1 in the supporting information section for similar analyses conducted on all superconductors located under the “dome” of superconductivity in Fig. 2.
$ P_{\text {elem.\#-o }} V=N \kappa T_{c-o}$
Distance correlation coefficients for the relationship between Tc−o and Vo in onset elements and intercalates are shown in Fig. 4. They are.82 and.62, respectively. These values suggest Tc−o and Vo are highly correlated in onset elements and intercalates. Bear in mind, the periodic table also allows an examination of offset conditions. Transition temperatures in this scenario oscillate with unit cell volume (see supporting information), unlike monotonous Tc−o(V). For intercalates, phase diagrams typically possess incomplete superconducting domes due to limitations in sample stability or synthesis methods. Therefore, offset conditions are not compared in this report.

Fig. 4. Transition temperature, Tc−o, versus onset volume, Vo. Plot (a) depicts onset elements as blue squares with a distance correlation coefficient of.82 indicated. Dashed black line serves as a guide to the eye at n = −1 for Tc−o ∝ V n; it is not a fit of the data. Plot (b) depicts intercalates [6], [11], [22] as red triangles with a distance correlation coefficient of.62 indicated. Dashed black line serves as a guide to the eye at n = −1 for Tc−o ∝ V n; it is not a fit of the data. |
3. Doping-induced superconductivity (non-isoelectronic)
An alternate route to chemically induce superconductivity is doping by single-element substitution. For instance, Yang et al. illustrated this with semimetallic IrTe2 through intercalation and palladium doping. [11] The resultant compounds, PdxIrTe2 and Ir1−xPdxTe2, with xo equal to 0.02 and 0.03, respectively, provide unique insights into the initiation of superconductivity specific to the processes of doping and intercalation, given that the host and control parameter remain consistent in both cases.
Based on reported resistance measurements, both compounds exhibit onset transition temperatures of Tc−o ≈ 2.5 K. Pd0.02IrTe2, the intercalate, displays a narrower transition width. Yang et al. also demonstrated that the superconductivity in PdxIrTe2 and Ir1−xPdxTe2 competes with density waves in a manner reminiscent of a quantum critical point. The calculated intercalation perturbation density ρint.−o for Pdxo IrTe2 is depicted in Fig. 3. The pressure inferred from Eq. (1) is approximately ∼1 atm.
To search for correlated behavior in doping-induced superconductors we define a perturbation density in non-isoelectronically doped compounds as ρdop.−o = xo|ΔN|/V. The variable |ΔN| represents the difference in the number of outer electrons between elements under exchange. For Ir1−xPdxTe2 and most other compounds the value of |ΔN| is 1. An example compound having |ΔN| = 2 is SmFe1−xNixAsO [40]. The density is 4.14·1026 electrons/m3 for Ir1−xPdxTe2 and it is plotted against Tc−o shown in Fig. 5 along with 70 other doped superconductors [9], [10], [11], [40], [41], [42], [43], [44], [45], [46], [47], [48], [49], [50], [51], [52], [53], [54], [55], [56], [57], [58], [59], [60], [61], [62], [63], [64], [65], [66], [67], [68], [69], [70], [71], [72], [73], [74], [75], [76], [77], [78], [79], [80], [81], [82], [83], [84], [85], [86], [87], [88], [89], [90], [91], [92], [93], [94], [95], [96], [97], [98], [99], [100]. Unlike onset elements and intercalates, most of these materials exhibit both magnet and structural transitions near Tc. Therefore, the data are sorted into two categories. Grey squares represent sixteen compounds which do not show structural transitions (STR) near Tc; all but two do not show magnetic transitions. Black squares represent fifty-six compounds which show structural transitions near Tc; all but four also show magnetic transitions.

Fig. 5. Onset volumetric electron density, ρdop.−o, versus transition temperature, Tc−o. |
The average density is 3·1026 electrons/m3 and nearly independent of Tc−o. The latter point is emphasized by the distance correlation coefficient, dCor(Tc−o, ρdop.−o) =.29. It is even more evident in the histogram binned to 1·1026 electrons/m3 shown in Fig. 6. The histogram is centered at ∼3·1026 electrons/m3 and skewed to the right. Though a constant perturbation density is unexpected, its average value is reminiscent of current densities typically estimated via Hall measurements of the normal state in the vicinity of superconductivity. [101], [102], [103].

Fig. 6. Frequency of doped superconductors versus calculated onset valence electron density. Data from 71 doped superconductors (see Table S2 in supporting information) are displayed. Grey squares indicate doped superconductors which do show structural transitions, black squares indicate those which do not show structural transitions. Bin size is of width 1·1026 electrons/m3. The peak value of the gaussian fit is shown to be ρdop.−o = 3·1026 electrons/m3. |
Notice correlations with temperature differ between ρint.−o and ρdop.−o. The variable ρint.−o is inversely proportional to Tc−o. If this correlation is also casual, it would imply the relevant itinerate electrons undergo a diffusive-type transport at the onset of intercalate superconductivity. This behavior mimics the typical transport behavior associated with intercalated systems like lithium-ion batteries [104], for example. The variable ρdop.−o is weakly correlated to Tc−o. If causal, it implies a more non-diffusive (e.g., ballistic) type transport at the onset of superconductivity in doped compounds for the assumed itinerant relevant electrons. These correlations and interpretation are supported by Yang et al.'s transport data for Pd0.02IrTe2 and Ir0.97Pd0.03Te2 where it is evident that the intercalated compound's electrical resistance shows a greater temperature dependence during its transition to superconductivity. Also, according to their phase diagram, data above onset suggests doped compounds are less affected by changes in electron density like our empirical result show in Fig. 5 for onset conditions. From their data, Tc in the doped remains nearly constant and persists well above onset (x > 0.09). For the intercalated, with similar perturbation, Tc peaks at x = 0.03 then quickly diminishes to almost non-existent at x = 0.1. This reveals the intimate connection between electron number density and Tc, like what is shown in Fig. 3 for onset intercalates. Summarized data comparing doping to intercalation are tabulated within Table S4 in supporting information.
Preceding sections have alluded to an ever-present critical pressure at the onset of superconductivity as a function of emergence pathways. Its origin was attributed to either the manifestation of Charles's law (T ∝ V) or the observation that onset perturbation densities are inversely proportional to onset transition temperatures. On the contrary, neither of these situations appear relevant for doped compounds. Consequently, a similar ideal gas-like interpretation of critical pressure in doped superconductors, if it exists, seems unlikely. If a non-diffusive critical pressure is to be assigned to the assumed itinerant onset electrons of doping-induced superconductors (i.e., Pdop.−o), it would likely arise from the degeneracy pressure (i.e., Pdeg. = Pdop.−o) created by these electrons, as shown in Eq. (3). The constants me and ħ represent the electron mass and reduced Planck's constant, respectively. This implies a perturbation density of ρdop.−o = 3·1026 electrons/m3 results in a critical pressure of Pdop.−o ≈ 36 atm.
$ P_{\text {deg. }}=\frac{\hbar^{2}}{5 m_{e}}\left(3 \pi^{2}\right)^{\frac{2}{3}}\left(\rho_{\text {dop.-o }}\right)^{\frac{5}{3}}$
A way to uncover evidence of this presumed critical pressure is to examine the interface superconductivity of heterostructures formed by these compounds. Given Eqs. (3), (1), the equation for Tc at the interface of an underdoped compound and an “onset” intercalated compound can be deduced. The condition xo|ΔN| = xoNint.−o leads to a simple formula for Tc expressed in Eq. (4). This is intriguing as a Tc of approximately 29 K and/or its functional dependence on sample differences are not implausible attributes of unstrained interface superconductivity. [105], [106] Eq. (5) illustrates the deduced Tc for the interface of an underdoped compound and an onset element. To date, the specific scenarios required for testing Eqs. (4) and (5) have not been reported.
$ T_{\text {dop. }- \text { int. }}^{\text {intefface }}=\mathbf{2 9} \mathbf{K}\left(\frac{V_{\text {int.-o }}}{V_{\text {dop.-o }}}\right) $
$ T_{\text {dop.- } \text { lem. }}^{\text {interfer }}=145 \mathrm{~K}\left(\frac{V_{\text {elem.-o }}}{V_{\text {dop.-o }}}\right)$
4. Discussion
The culmination of these results suggests high-temperature superconductivity favors dilute systems (i.e., ρo ∝ T−1) and large unit cell volumes (i.e., Tc−o ∝ Vo) at the genesis of superconductivity. It also reveals a minimum real space density in many compounds displaying doping-induced superconductivity. It is important to note that these findings pertain to a section of the phase diagram requiring the least amount of chemical resources (i.e., onset) for the emergence of superconductivity. Therefore, this information may be crucial for the engineering of future low-cost high-temperature superconductors with less reliance on serendipity. Refer to empirical relationships summarized in Table 2.
Table 2. Summary of empirical equations at the onset of superconductivity in intercalates, single-elements, and doped compounds. |
| Synthesis Technique | Empirical Observation (1 K < Tc < 40 K) | Critical Pressure (1 K < Tc < 40 K) |
|---|---|---|
| Intercalation | $ \rho_{\text {int,-o }} \propto T_{\mathrm{c}-0}^{-1} $ | ∼1.3 atm |
| Single Elements | $ \rho_{\text {elem.-0 }} \propto T_{c-0}^{-1} $ | ∼6.5 atm* |
| Doping | $ \rho_{\text {dop }-0} \approx \text { constant } $ | ∼36 atm** |
*For shells n≥3, La: 13.3 atm. **If related to Fermi/degeneracy pressure. |
As previously mentioned, pressurization is another pathway to superconductivity. Its effects are often likened to the “chemical pressure” associated with intercalation, for example [107], [108], [109]. Preliminary data we have observed in nearly 60 compounds [18], [19], [12], [13], [14], [15], [16], [110], [111], [112], [113], [114], [115], [116], [117], [118], [119], [120], [121], [122], [123], [124], [125], [126], [127], [128], [129], [130], [131], [132], [133], [134], [135], [136], [137], [138], [139], [140], [141], [142], [143], [144], [145], [146], [147], [148], [149], [150], [151], [152], [153], [154], [155], [156], [157], [158], [159], [160], [161], [162], [163], [164], [165], [166], [167] (see Table S3 in supporting information) also lend credence to this well-accepted idea concerning the relationship between Tc−o and Vo. Fig. 7 depicts data from compounds showing only a superconducting transition when cooled after pressurization, i.e., those possessing no magnetic ordering and no structural transitions. The distance correlation coefficient in this case is highly correlated at dCor(Vo, Tc−o) =.8. More work is needed to elucidate effects like magnetism on onset conditions in pressurized compounds; see Fig. S1 in supporting information for further analysis.

Fig. 7. Onset transition temperature, Tc−o, versus onset unit cell volume, Vo for 20 pressure-induced superconductors (see Table S3 in supporting information). A distance correlation coefficient of dCor(Vo, Tc−o) =.8 is indicated. Dashed line indicates n = 1 as a guide to the eye for Tc−o ∝ Von; it is not a fit of the data. |
5. Conclusion
Correlated behavior has been identified near the onset of superconductivity in systematically tuned compounds with nuanced considersations of V, N, and Tc. In addition to contributing to fundamental research efforts, the author aims for this investigation to aid in refining the physical and chemical phase space explored by the scientistific community in their quest for new and innovative superconductors.
Funding
The National High Magnetic Field Laboratory is supported by the National Science Foundation through NSF/DMR-2128556, NSF/DMR-1644779, and the State of Florida.
CRediT authorship contribution statement
Shermane M. Benjamin: Conceptualization, Data curation, Formal analysis, Investigation, Methodology, Project administration, Supervision, Validation, Visualization, Writing - original draft, Writing - review & editing.
Declaration of competing interest
The authors declare that they have no known competing financial interests or personal relationships that could have appeared to influence the work reported in this paper.
Acknowledgements
The author sincerely thanks P.M. Eugenio, J. Jaroszynski, T. Murphy, M. Ozerov, M. Lee, B. Casas, D. Chichinadze, R. Baumbach, L. Balicas, C. Moir, D. Graf, E.S. Choi, and L. Nelson for many useful discussions. The author also expresses their gratitude to the reviewers and editor for their comments and critiques toward significantly improving the manuscript.
Appendix A. Supplementary material
Supplementary material to this article can be found online at https://doi.org/10.1016/j.supcon.2024.100098.
