Please wait a minute...
IMAGE/TABLE DETAILS
Analysis of risk factors for poor prognosis in patients with hospital-acquired bacterial meningitis and establishment of nomogram prediction model
YANG Mei, LIAO Qi'an, TAN Quanhui, LI Tingting, ZHANG Yi, CHEN Jie, TANG Zhenghao
Journal of Diagnostics Concepts & Practice    2025, 24 (04): 441-448.   DOI: 10.16150/j.1671-2870.2025.04.011
Abstract   (27 HTML2 PDF(pc) (719KB)(4)  

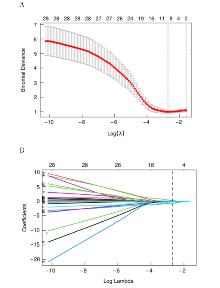
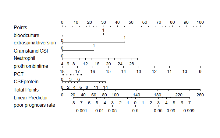
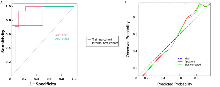
Objective To explore the risk factors for poor prognosis in patients with hospital-acquired bacterial me-ningitis (HABM) and to establish a nomogram model to predict its occurrence. Methods A total of 110 patients with HABM admitted to Shanghai Sixth People's Hospital Affiliated to Shanghai Jiao Tong University School of Medicine from January 1, 2013 to December 31, 2020 were consecutively enrolled. Based on survival status at discharge, they were divided into a death group (n=22) and a survival group (n=88). Subsequently, 110 patients were randomly divided into a training cohort (n=77) and a validation cohort (n=33). The least absolute shrinkage and selection operator (LASSO) regression and multivariate logistic regression were used to identify risk factors for poor prognosis in patients with HABM. A nomogram model was constructed based on these risk factors. The area under the curve (AUC) of the receiver operating characteristic (ROC) curve was used to evaluate the model discrimination, and the calibration curve was used to evaluate the internal consistency of the model. Results Based on the LASSO regression, seven factors were identified: gram-positive staining of microorga-nisms in cerebro-spinal fluid (CSF) culture, elevated neutrophil count on routine blood tests, elevated procalcitonin, elevated CSF protein, decreased prothrombin time, positive blood culture, and history of lumbar drainage. A nomogram prediction model for poor prognosis in HABM patients was established. The areas under the ROC curves for the training cohort and the validation cohort were 0.931 and 0.862, respectively. The calibration plots demonstrated that the calibration curves showed good agreement with the ideal curves, indicating an excellent goodness of fit. Conclusions The risk factor-based nomogram model established in this study demonstrates good predictability, consistency, and clinical applicability for predicting mortality in hospitalized HABM patients, supporting clinicians in the preliminary assessment of the risk of poor prognosis.


Characteristics Death group
(n=22)
Survival group
(n=88)
P-value Characteristics Death group
(n=22)
Survival group
(n=88)
P value
Age(years) 61 ± 11 55 ± 13 0.057 Antithrombin Ⅲ activity(%) 65 ± 25 89 ± 16 <0.001
Sex(%) 0.483 More than two surgeries(%) 0.212
Female 9 (40.9%) 29 (33.0%) No 13 (59.1%) 64 (72.7%)
Male 13 (59.1%) 59 (67.0%) Yes 9 (40.9%) 24 (27.3%)
Admission GCS 7.9 ± 4.0 9.3 ± 3.7 0.073 blood culture(%)) 0.001
Gram stain of CSF microbial[n(%)] 0.01 No 11 (50.0%) 73 (83.0%)
Negetive 13 (59.1%) 26 (29.5%) Yes 11 (50.0%) 15 (17.0%)
Positive 9 (40.9%) 62 (70.5%) GCS on the day of culture 7.5 ± 3.3 9.4 ± 3.5 0.018
CSF Chloride(mmol/L) 120 ± 17 119 ± 16 0.988 Surgical incision length greater than 10 cm(%) 0.19
CSF Sugar(mmol/L) 2.26 ± 2.13 3.50 ± 2.14 0.02 No 12 (54.5%) 61 (69.3%)
CSF protein(mmol/L) 5.6 ± 5.3 4.2 ± 12.8 0.023 Yes 10 (45.5%) 27 (30.7%)
CSF WBC>10(× 106/L) 0.273 Surgical time greater than 4 h(%) 0.529
<100 12 (54.5%) 59 (67.0%) No 17 (77.3%) 74 (84.1%)
>100 10 (45.5%) 29 (33.0%) Yes 5 (22.7%) 14 (15.9%)
CSF RBC[n(%)] 0.775 Tracheal intubation/incision greater than 7 days(%) 0.021
Little 11 (50.0%) 47 (53.4%) No 3 (13.6%) 35 (39.8%)
Many 11 (50.0%) 41 (46.6%) Yes 19 (86.4%) 53 (60.2%)
WBC(× 109/L) 14.7 ± 7.2 11.7 ± 5.9 0.07 Fever(%) 0.306
Neutrophil(× 109/L) 12.7 ± 6.7 10.6 ± 15.1 0.037 No 5 (22.7%) 30 (34.1%)
RBC(× 1012/L) 3.41 ± 0.57 3.66 ± 0.82 0.199 Yes 17 (77.3%) 58 (65.9%)
PLT(× 109/L) 226 ± 137 278 ± 107 0.019 External ventricular drainage greater than 7 days(%) 0.151
Neutrophil percentage(%) 84 ± 8 77 ± 9 <0.001 No 9 (40.9%) 51 (58.0%)
Lymphocytes(× 109/L) 1.07 ± 0.56 1.31 ± 0.59 0.087 Yes 13 (59.1%) 37 (42.0%)
Monocytes(× 109/L) 0.76 ± 0.42 0.81 ± 0.53 0.994 CSF leakage(%) 0.684
Average platelet volume(fL) 11.41 ± 1.62 10.52 ± 1.09 0.02 No 21 (95.5%) 80 (90.9%)
Platelet mean width(fL) 15.19 ± 3.80 13.77 ± 11.10 0.005 Yes 1 (4.5%) 8 (9.1%)
Plateletcrit(%) 0.25 ± 0.13 0.29 ± 0.11 0.087 Extraspinal diversion(%) 0.049
Albumin (g/L) 33.2 ± 5.3 36.3 ± 4.8 0.002 No 18 (81.8%) 84 (95.5%)
Albumin to globulin ratio 1.48 ± 0.41 1.51 ± 0.36 0.403 Yes 4 (18.2%) 4 (4.5%)
CRP(mg/L) 79 ± 38 56 ± 47 0.003 V-P shunting(%) 0.755
Procalcitonin(ng/mL) 1.40 ± 1.83 0.32 ± 0.38 <0.001 No 18 (81.8%) 74 (84.1%)
D-D(mg/L) 4.1 ± 4.3 4.1 ± 4.1 0.799 Yes 4 (18.2%) 14 (15.9%)
PT(s) 14.19 ± 2.06 12.26 ± 1.31 <0.001 Diplopneumonia(%) 0.09
INR 1.69 ± 2.10 1.07 ± 0.12 <0.001 No 3 (13.6%) 28 (31.8%)
APTT(s) 38 ± 15 29 ± 7 0.003 Yes 19 (86.4%) 60 (68.2%)
Fibrinogen(g/L) 3.97 ± 1.54 4.00 ± 2.14 0.893 Deep vein cannulation(%) 0.017
Prothrombin time(s) 16.84 ± 2.28 16.30 ± 1.85 0.168 No 2 (9.1%) 31 (35.2%)
FDP(mg/L) 13 ± 12 13 ± 11 0.751 Yes 20 (90.9%) 57 (64.8%)
Table 1 Comparison of basic data between the survival group and death group
Other Images/Table from this Article