China Alzheimer Report 2024
WANG Gang, QI Jinlei, LIU Xinya, REN Rujing, LIN Shaohui, HU Yisong, LI Haixia, XIE Xinyi, WANG Jintao, LI Jianping, ZHU Yikang, GAO Mengyi, YANG Junjie, WANG Yiran, JING Yurong, GENG Jieli, ZHI Nan, CAO Wenwei, XU Qun, YU Xiaoping, ZHU Yuan, ZHOU Ying, WANG Lin, GAO Chao, LI Binyin, CHEN Shengdi, YUAN Fang, DOU Ronghua, LIU Xiaoyun, LI Xuena, YIN Yafu, CHANG Yan, XU Gang, XIN Jiawei, ZHONG Yanting, LI Chunbo, WANG Ying, ZHOU Maigeng, CHEN Xiaochun, representing the China Alzheimer's Disease Report Writing Group
Journal of Diagnostics Concepts & Practice
2024, 23 (
03):
219-256.
DOI: 10.16150/j.1671-2870.2024.03.001
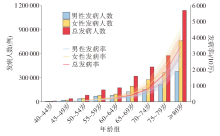
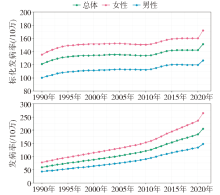
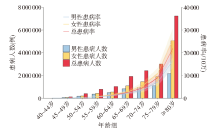
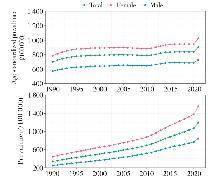
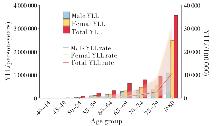
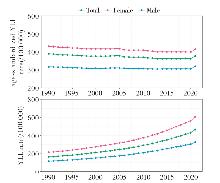
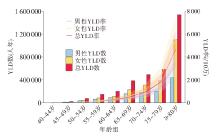
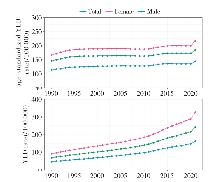
With the sustained growth of economy and significant changes in social demographics, the issue of elderly-related diseases has increasingly drawn particular attention. Alzheimer's disease (AD),as a representative neurodegenerative diseases has become a major challenge, affecting the health and quality of life among the elderly population severely. In recent years, the incidence, prevalence, and mortality rate of AD have increased in China, imposing substantial economic burdens on families, society, and the entire healthcare system. To proactively address this challenge and respond to the national 'Healthy China Action' initiative, leading experts from Renji Hospital, Shanghai Jiao Tong University School of Medicine,and Chinese Center for Disease Control and Prevention Chronic Non-communicable Disease Control Center, Fudan University School of Public Health, Shanghai Mental Health Center, Ruijin Hospital,Shanghai Jiao Tong University School of Medicine, Fujian Medical University, and other authoritative institutions, have jointly authored the 'China Alzheimer Disease Report 2024'. Building upon previous editions of 2021, 2022, and 2023, this report updates epidemiological data on AD in China, thoroughly analyzes the latest economic burdens of the disease, and comprehensively evaluates the current status of AD diagnosis and treatment services, as well as the allocation of public health resources in our country. The release of the 'China Alzheimer Disease Report 2024' not only reflects China's progress and efforts in AD research and prevention, but also underscores the heightened social concern for elderly health issues. It aims to provide scientific and technical guidance and robust data support for the prevention, diagnosis, and treatment of AD, offering a professional basis for the government and relevant departments to formulate targeted health policies and intervention measures. Furthermore, it serves as a platform for promoting academic exchanges and cooperation in this field domestically and internationally. Through the dissemination and application of this report, we anticipate it will not only serve as a reference for professionals but also enhance public awareness of AD, promote active participation across various sectors of society, and jointly advance the development of elderly health care in China, empowering us towards achieving 'healthy aging'.