
Highlight
• Introduced a new microfluidic device to apply shear stress to cells with viscous sheath for combined high-speed fluorescence imaging and deformability cytometry
• Characterized how cell deformability depends on nuclear structure in health and models of activated cells
Introduction
In recent decades, tools measuring the mechanical properties of cells have grown in sophistication and diversity [1]. Cell mechanical phenotypes are the culmination of intracellular components such as the cytoskeleton and nucleus. As these components reorganize or change form or function, the cell’s mechanical properties can change with them. These changes have been related to changes in cell cycle [2], leukocyte activation [3], cancer malignancy [4], and cell differentiation [5,6], among many others. A variety of tools have been used to probe cells’ response to force, such as atomic force microscopy (AFM) [7], micropipette aspiration [8], or optical tweezers [9], but all these methods can be labor intensive, affected by user variability, and do not scale well. Recently, several microfluidics methods have been developed that allow cells to be measured robustly, and at higher throughput [2,5,10]. Higher throughput methods enable more cells to be measured, providing a more complete picture of cell heterogeneity or rare subpopulations. Higher throughput methods are also suitable for rapid diagnostic devices, such as the recently introduced IntelliSep sepsis diagnostic test, which relies on deformability cytometry. Although all these methods aim to measure the mechanical properties, they vary widely in implementation, applied stress, time scales, and quantification of deformation [11]. These methods quantify cell deformation in a way that considers a cell to be a uniform elastic object, without isolating nuclear contributions, or identifying local deformation.
As a major component of the cell, the nucleus has been found to alter overall deformability via chromatin reorganization [12,13], nuclear envelope alteration [12⇓-14], and cell cycle progression [2,15,16]. The nucleus’s mechanical properties have also taken a more active role in the cell’s function by facilitating cell migration [14,17,18] and genomic architecture reorganization [19,20].
Massive nuclear reorganization also occurs in neutrophils when generating neutrophil extracellular traps (NETs) [21]. Neutrophils are a vital part of the innate immune system. In the defense against pathogens, neutrophils were long thought to attack invading organisms via phagocytosis or release of antimicrobials from their granules. However, a third role has recently been discovered, whereby neutrophils release NETs [22]. NETs are comprised of the neutrophil’s decondensed chromatin, embedded with cytosolic and granule proteins. These NETs are intended to trap and neutralize pathogens including bacteria, fungi, viruses, and parasites [21]. During the process of creating NETs, or NETosis, the neutrophil’s chromatin decondenses, the nuclear envelope breaks down, and the chromatin mixes with the cell’s antimicrobials before being released into the extracellular environment. This process normally results in the death of the neutrophil, although there is a form of non-lytic NETosis where the NETs are released, and the chromatin-less cells remain intact. Despite the advantages of NETs in an immune response, NETs have been implicated in various autoimmune diseases including rheumatoid arthritis, psoriasis, and gout [23], as well as infertility and preeclampsia during pregnancy [24], and in the development of sepsis [25⇓-27].
NETosis induces large structural changes in neutrophils within hours. This has been observed in vitro by inducing NETosis with phorbol myristate acetate (PMA) and utilizing fluorescence microscopy to observe the chromatin decondense and pervade the cell before rupturing [28]. NETosis has also been characterized using imaging flow cytometry, utilizing PMA or lipopolysaccharide (LPS) to induce NETosis [29]. In addition to staining and characterizing the nuclear structure, this work also stained myeloperoxidase (MPO), a key biomarker of NETosis, which is normally compartmentalized in the neutrophil granules, but is co-located with DNA by the end of NETosis. Due to the massive structural reorganization needed to produce NETs, we believe that neutrophils undergoing NETosis should have significant changes in deformability, which should be measurable with a high-throughput deformability cytometry technique. This has not been specifically measured or reported. The nuclear composition in neutrophil-like cells has previously been shown to impact the cells’ deformability, and ability to pass through small spaces [14], which indicates that chromatin decondensing or nuclear envelope breakdown in NETosis should have a significant impact on cell deformability. Identifying NETosing cells in flow may be valuable to potentially assess patients with abnormal immune activation, sepsis, or assessing the efficacy of autoimmune treatments.
However, high-throughput cell deformability methods have been unable to directly include nuclear information. Many of these nuclear findings have been extracted by experiments carefully designed to alter or isolate nuclear changes. A real-time fluorescence and deformability cytometry technique has been recently developed, which is only able to provide fluorescence pulse information [16,30]. This method has been able to identify nuclear envelope breakdown and distinguish between anaphase and metaphase cells with proper staining. Fluorescence images of nuclear structure have not been utilized in high throughout deformability methods due to the incompatibility of the time needed to integrate fluorescence images, and the speed at which cells are often flowing through the microchannels. With high resolution information of nuclear structure, we can understand how nuclear structure contributes to overall cell mechanical properties and use it to identify cell types.
To overcome these challenges, we have developed fluorescence imaging deformability cytometry (FI-DC), which uses sensitive photomultiplier tubes (PMTs) to image fluorescence channels while flowing at 0.5 m · s−1. This method utilizes fluorescence imaging using radiofrequencytagged emission (FIRE) [31], which generates images by integrating a line of pixels across the channel of a microfluidic device. We combine this imaging with a shear flow deformability method [2] that features a tunable sheath flow geometry that allows us to increase cell deformation by altering stream viscosities. When used with appropriate nuclear or other intracellular stains, this platform allows us to directly combine intracellular imaging with cell deformation. Using this system we observe that PMA-stimulated neutrophils have a more round nuclear structure and increased deformability relative to unstimulated neutrophils.
Results
Fluorescence imaging deformability cytometry (FI-DC) platform
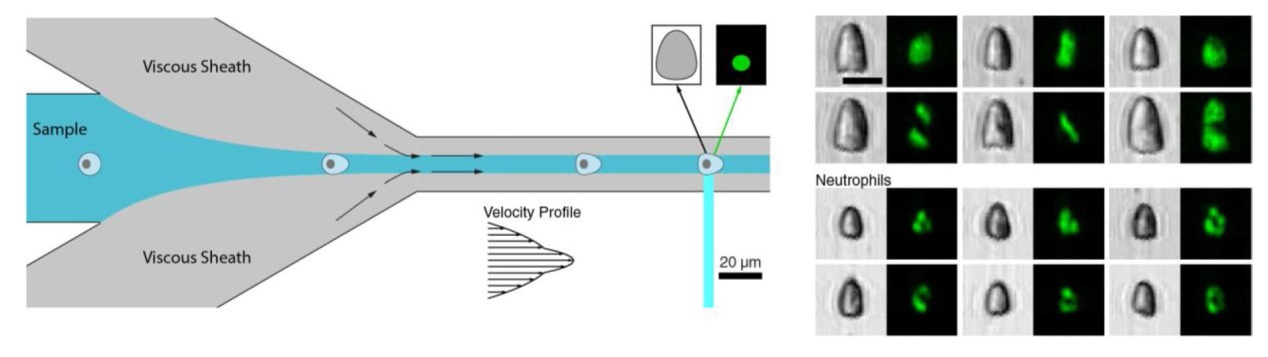
We have developed FI-DC, a platform for deforming cells in flow, while delivering simultaneous brightfield and fluorescence images. FI-DC is the first deformability method of its kind that can operate at modest flow velocities (0.5 m · s−1) while delivering images that reveal both the shape and size of the cells, in addition to internal cellular structure. Here we demonstrate its capability by providing spatial information about nuclear structure, which had not yet been realized by high throughput deformability techniques. This is achieved by combining a shear flow deformability method [2] with fast fluorescence and brightfield imaging using FIRE [31] (Fig. 1a). We use a microfluidic device that has a center sample inlet, flanked by two additional inlets to provide sheath co-flows. A similar method has recently been used to probe cell and spheroid mechanics [32]. The streams join in a straight channel, with cross section 25 μm × 30 μm, where the cells are deformed into a bullet shape and imaged. 10 μm fluorescent beads are added to the cell sample to monitor flow speeds. The center sample stream contains cells suspended in 1.5% w/v alginate in PBS, and the sheath flows are 5.0% w/v alginate in water. The viscosity in the sample stream serves to increase the average shear stress experienced by the cells. Creating a viscosity mismatch between the sample and sheath flows pinches the velocity profile in the center of the channel (Fig. 1a inset), creating a higher velocity gradient, and higher shear stress.

Fig. 1 FI-DC schematic and analysis overview. a Cells flow through a microfluidic device with viscous sheath flows that create a pinched velocity profile (inset). After deforming, cells are interrogated in the straight channel via FIRE, producing brightfield and fluorescence images. b Jurkat and neutrophil images demonstrating varied deformed shapes and nuclear structure. c Cells and nuclei are segmented from images using U-Net neural networks. Curvature is measured from extracted boundaries, which is integrated to yield a scale-invariant bending factor, which we use for cell deformability. Chromatin content is calculated as the ratio of nuclear and cell area. d Cell area, cell deformability, and chromatin content capture fundamental features of Jurkat cell populations (n = 10,031). Unlabeled scale bars are 10 μm |
FIRE provides rich, multimodal images of cells in flow. FIRE acts as a type of line scan imaging system, constructing images as the cells flow past the interrogation region of the microfluidic channel. The interrogation region is exposed with a 488 nm laser and emitted and scattered light are reconstructed to create fluorescence, brightfield, and darkfield images. Here, we use brightfield and fluorescence channel [emission filter: 529 nm; width: 28 nm] images to measure deformed cells and their stained nuclear structure (Fig. 1b). Fluorescence images can reveal nucleus size, location, or cell cycle, all of which might affect cell mechanical properties. FIRE images can be acquired by setting side scatter or fluorescence thresholds, which provides initial filtering of debris, and allows for long, continuous acquisition of sparse samples. With a sufficient cell concentration, FIRE can provide up to hundreds of cell events per second.
FIRE images are automatically analyzed to extract cell and nucleus morphology measures. Exported FIRE images are first filtered by a neural network to remove images with multiple cells, debris, dead cells, or partial cells. Remaining cells may be undergoing mitosis and exhibit a single condensed metaphase plane or two localized condensed chromatin regions associated with separated sister chromatids (Fig. 1b). Cells and nuclei are segmented from brightfield and green fluorescence images, respectively, using U-Net neural networks [33], which excel at segmenting biological images (Fig. 1c). To avoid the pixelation effects from measuring the segmented objects directly, we extract smoothed contours first. We can then calculate standard morphology measurements such as cell area, perimeter, aspect ratio, and solidity.
Previous hydrodynamic deformability methods have measured cell deformability as deviations from circularity. This has been achieved by measuring the cell aspect ratio [5], or by measuring the cell’s circularity [2]. Both measures reflect some information about changes in a cell’s shape, but we believe that there is some information lost about the local changes in deformation. Therefore, we calculate local curvature of the extracted cell and nucleus boundaries and use this to calculate a unit-less scale-invariant bending energy to describe the entire object [34,35]. In this paper we will refer to this measurement as the bending factor as it is not a physical measure of energy. The bending factor gives us local information about deformation of the cell and gives us a scale-invariant measure that describes how a cell deviates from circularity. According to this scale-invariant bending factor, a circle would have a value of 4π, which is the minimum possible value. The bending factor for sections along the boundaries can also be calculated, accumulating curvature measurements for any region. The bending factor is calculated for both cells and nuclei, and we use the cell membrane bending factor as our definition of cell deformability - defining the ability to change shape under fluid dynamic shear induced in the microfluidic device. The green fluorescence FIRE images give us information about the size and location of stained chromatin in the cells. We can leverage this information first by calculating the ratio of the chromatin area and cell area, which we refer to as chromatin content. Cell area, cell deformability, and chromatin comprise the most useful features in our analysis (Fig. 1d).
Deformation characterization
Deformation of cells in FI-DC is controlled by altering the viscosity of the sample and sheath streams, while maintaining constant volumetric flow rate. Here we demonstrate the change in deformation of suspension Jurkat cells by adjusting the sample stream viscosity, as well as the differential of the sample and sheath viscosities (Fig. 2a). As an illustration, we show cells in the following sample:sheath configurations: PBS:PBS (indigo), PBS: 2.0% w/v alginate (violet), and 1.5% w/v alginate:5.0% w/v alginate (orange). As both the sample stream and sheath streams increase in viscosity, the shear stress on the cells increases, changing the cell shape from that of a circle, to a bullet. To estimate the stress experienced by the cells, we model the channel in 3D in COMSOL, and calculate the average shear stress in the fluid of a 10 μm × 10 μm lumen in the center of the channel. PBS:PBS has a calculated 0.03 kPa shear stress, PBS: 2.0% w/v alginate has a calculated 0.53 kPa shear stress, and 1.5% w/v alginate:5.0% w/v alginate has a calculated 1.33 kPa shear stress. Using the most extreme flow condition shown here, this gives us ∼44-fold increase in estimated shear stress over a PBS filled channel. The differences in cell shape seen by eye are also evident when comparing cell deformability (Fig. 2b). Using the bending factor as the measurement for cell deformability, the 1.5% w/v alginate:5.0% w/v alginate condition gives us a clear separation from the largely undeformed cells in PBS:PBS, leading us to use this condition for the rest of the following work.

Fig. 2 FI-DC features tunable deformation and reveals nuclear and membrane details. a Increasing the sample stream viscosity and the ratio of sample:sheath viscosity increases visible deformation. b Bending factor as a form of cell deformability captures the change in shape visible in images (n ≥ 11,700 for all groups). c Nuclear images of Jurkat cells reveal a subpopulation with reduced chromatin content (n = 9,730). d This reduced chromatin content subpopulation features a higher cell size and deformability than the rest of the cell population. e When comparing cells of similar size (blue box with 5 μm2 width in Fig. 2d), there is not a noticeable difference in cell deformability (n = 1,783). f Jurkats of similar size with low (yellow) and high (blue) cell deformability are selected for comparison (n = 10,031). g These cells do not exhibit noticeably different levels of chromatin content (blue n = 96; yellow n = 99). h Median shapes of cells in these populations reveal the high cell deformability cells are deformed more in the lower (back) corners of the cell. i Differences in the deformation of sections of the cell quantitatively demonstrate the sections of the cell responsible for overall cell deformability differences. Unlabeled scale bars are 10 μm |
Revealed nuclear structure heterogeneity
FIRE’s fluorescence images allow us to discover nuclear heterogeneity in Jurkat cells. Without these fluorescence intracellular images, we may only analyze cells by area and deformability. But by measuring the chromatin area per cell, we can see a subpopulation in Jurkat cells that exhibits reduced chromatin area for similarly sized cells (Fig. 2c). This reduced chromatin content subpopulation is rare (1.9%) and has a larger cell size and increased cell deformability than the rest of the Jurkat sample. However, when normalizing for size differences by comparing cells in a narrow size range (blue box with 5 μm2 width in Fig. 2d), we do not see a significant difference in deformability of the low chromatin content cells (Fig. 2e).
Investigating differences in cell deformability
FI-DC’s images also enable us to eliminate or isolate factors that contribute to similarly sized cells deforming differently. When comparing the mechanical properties of cells, it is useful to understand how cells of a similar size may deform differently. This may be true when comparing different cell types or treatments, or even the natural spread within the same population. We select a sampling of approximately 100 cells at low and high deformability for the same cell area range (57.8 μm2—62.8 μm2), while excluding outlier cells with high deformability (Fig. 2f). These cell groups do not have noticeably different levels of chromatin content, indicating that the difference in deformation may not be due to nuclear structure (Fig. 2g). Utilizing the shared polar coordinate system of the cell boundaries, we calculate median cell shapes for each of the groups (Fig. 2h). These median cell shapes indicate that the group of higher deforming cells have more pronounced corners at the base of the bullet shape, as well as some negative curvature in between the corners. This observation is demonstrated quantitatively by dividing the cells into thirds (gray lines) and calculating the bending factor for each section (Fig. 2i). This analysis illustrates that there is some increased deformation at the front of the cell (Sect. 0), but that the back thirds (Sect. 1 & Sect. 2) have a much higher bending factor. This, along with the chromatin content suggests that the difference in deformation may be due to differences in the membrane rigidity or cytoskeleton associated with the outer cell membrane, rather than due to nuclear effects. Similar spread in deformability may be visible with other imaging methods or deformability calculations, but FI-DC can give more insight into the local changes that may contribute to deformation differences.
Neutrophil extracellular traps
We use FI-DC to study changes associated with NETosis in neutrophils. We induce NETosis in neutrophils from two healthy human donors by stimulating in vitro with 2 nM PMA for 1.5h and comparing to a dimethyl sulfoxide (DMSO) vehicle control. We chose 1.5h because at longer time points (3h or greater) we observed that cells remained sticky and attached to the culture vessel, likely because of the extruded chromatin accompanying NETosis of these cells. The loss of membrane integrity, associated optical contrast, and aggregates that formed at this later time point prevented us from obtaining useful measurements of cells. In both donors, we observe a decrease in chromatin content, with an increase in cell deformability (Fig. 3a). Cell and nuclear traces from five cells from the center of the cell distributions illustrate the changes in the cells. The cells appear to have grown, and become more bullet shaped, indicating that with PMA treatment, the chromatin area has remained the same, and the measured chromatin content has changed only due to the cell size change. The nuclear bending factor of the PMA-treated neutrophils shows a trend towards lower values, which is loosely correlated with chromatin content (Fig. 3b). We do not use the nuclear bending factor as a measure of nuclear deformation, but instead to describe its shape. In this case, the lower nuclear bending factor indicates the nuclei have become less lobular and are becoming rounder. Finally, while both cell deformability and nuclear bending factor have changed with PMA stimulation, the two measures do not appear to be correlated (Fig. 3c).

Fig. 3 FI-DC reveals changes in NETosing neutrophil deformation and structure. a Stimulated neutrophils from two donors have increased cell deformability and reduced chromatin content. Traces from 5 cells from each condition reveal cells have increased in size (n ≥ 21,700 for all groups). b The nuclear bending factor of stimulated neutrophils is slightly lower, as the cells begin the NETosis process. c There is no visible correlation between cell deformability and the shape of nuclear structure (nuclear bending factor) |
Stimulation of neutrophils with PMA results in marked increases in cell area and cell deformability (Fig. 4a) in both blood donors. The PMA-treated distributions have a clear shift in their region of highest density, but it is clear via the density contours that there remains a portion of the distributions co-located with the untreated neutrophils, indicating that not all neutrophils are stimulated equally. To compare how the mechanical properties of similarly sized cells compare, we have previously developed a measure of relative deformability [11]. Relative deformability normalizes the median deformability of treated cells within a narrow size range by the median deformability of control cells. This normalization allows us to compare values more confidently between experiments, and across platforms. Selecting a narrow size range, we can see that there is a clear shift in cell deformability of the PMA-treated neutrophils, and that all distributions are strongly skewed (Fig. 4b). Rather than converting thousands of cell measurements into a single value of relative deformability, or risk taking the median of a complex distribution, we construct relative deformability distributions instead.

Fig. 4 NETosing neutrophils have increased cell deformability. a NETosing neutrophils demonstrate a noticeable increase in cell size and deformability (n ≥ 21,700 for all groups). b The cell deformability of neutrophils from a narrow size range is compared, which illustrates a small shift in deformability over this small size range (n ≥ 4,600 for all groups). c Distributions of cell deformability are normalized, which also show an increase in treated neutrophils. Bayesian analysis indicates that there is a significant change in the distributions’ means when modeled as t-distributions |
Relative deformability distributions normalize entire deformability distributions, not just measures of central tendencies. We calculate relative deformability distributions by a bootstrapping method where we randomly sample pairs of values from each treatment group and corresponding control group and divide them. Sampling is limited by the group with fewer observations (Fig. 4c). In this way, we also get a more complete understanding of the control distribution, which is normalized against itself, instead of simply having a relative deformability of 1. Sampling in this way, we can still observe a shift in the PMA-treated neutrophils. Additionally, because of the resampling, the relative deformability distributions are roughly t-distributed, making them easier to model and compare. These distributions are compared and modeled with Bayesian inference (See Supp Fig. S1 for model structure) and 94% Credible Intervals (94%CI) of the posteriors are reported [36]. The treatment means are significantly greater than the control means (calculated as the difference) for both Donor 1 (median = 0.064, 94% CI [0.057,0.072]) and Donor 2 (median = 0.043, 94% CI [0.034,0.053]). The treatment scale parameters σ are significantly greater than the control scale parameters (calculated as the difference) for both Donor 1 (median = 0.012, 94% CI [0.0058,0.018]) and Donor 2 (median = 0.0084, 94% CI [0.00065,0.016]). The normality parameter ν is shared across models (median = 3.61, 94% CI [3.45,3.78]) and indicates the distributions are more likely to be t-distributed rather than normally distributed. We believe this calculation of a relative deformability distribution is a more accurate and richer metric for changes in deformability.
NETosing neutrophil classification
With this platform we not only want to measure NETosing neutrophils and their distributions but detect them in flow as well. We perform random forest classification on the treated and untreated neutrophils by pooling the measured cells from both donors. These cells are split into training (n = 67,530) and test (n = 22,510) sets. The classifier is trained using features calculated from the brightfield and fluorescence images, and achieves 85% classification accuracy, with untreated and treated precision values of 84% and 86% respectively and recall values of 88% and 82% respectively. We note that this performance takes into account that it is likely that not all cells in the PMA-treated group are undergoing NETosis at the same stage. We perform permutation importance tests that reveal the cell area is by far the most useful feature to classify treated neutrophils, followed by cell deformability (See Supp Fig. S2a for list of features and relative importance). Due to the noticeable change in cell size following PMA stimulation, we construct a new classifier, excluding features relating to cell size including cell area, cell length, cell width, cell perimeter, and chromatin content. This classifier has decreased performance, but not by much, as it has a classification accuracy of 79.7%. This classifier has untreated and treated precision values of 80% and 79% respectively and recall values of 82% and 77% respectively. Permutation tests reveal that this classifier’s most useful features are overall cell deformability, followed by the bending factor of the two back corners of the cell, and then the bending factor of the front of the cell (See Supp Fig. S2b for list of features and relative importance). These results are consistent with the higher deformability Jurkat cells which experienced more deformation in the back corners (Fig. 2h). These classification results indicate that fractions of the treated population that may comprise NETosing neutrophils can be identified in FI-DC, not only due to their increase in size, but due to their deformation as well.
Discussion
Here we have presented FI-DC, a platform that enables fluorescence imaging combined with high throughput cell deformability in flow. This technology enables morphological cell measurements to be combined with intracellular information, such as nuclear structure. Additionally, we have proposed a new method to quantify the deformation of hydrodynamically deformed cells, by calculating local curvature along the cell perimeter, which can be integrated into a summary bending factor. These measurements allow us finer insight into how cells may deform locally. Using this platform, we have been able to identify Jurkat subpopulations by nuclear structure and characterize the change in mechanical properties of NETosing neutrophils. Finally, we developed a new measure to compare changes in deformability by generating relative deformability distributions.
Deformability methods can be characterized by how they deform cells, and how that deformation is measured. Except for AFM-based methods [7], many deformability cytometry platforms measure the entire deformation of the cell. This is even though the cell is comprised of multiple components including the actin cortex and nucleus, and all regions of a cell may not experience the same stresses and strains. To that end, we have calculated the curvature of the cell perimeter, which gives us local information about the shape of the cell membrane. This type of analysis can help explain the difference in the shape of cells with different deformability. By itself, understanding the magnitude and sign of curvature is valuable. But the curvature can be summarized via the scale-invariant bending factor, which quantifies how the cell deviates from a perfectly undeformed circle. Additionally, the bending factor can be calculated for sections along the cell perimeter, giving a standardized, midlevel quantification between overall bending factor and curvature. These measurement techniques can be applied to any image-based deformability platform, although it requires sufficiently smooth and accurate cell boundaries.
Using this platform, we investigated the natural variation in mechanical properties of Jurkat cells. FI-DC allowed us to identify cells with varying chromatin content, which would have been missed with non-fluorescence imaging. The identified cells with reduced chromatin content had increased cell size and cell deformability, although we were unable to determine if the increase in deformability was independent of the size change. Given the larger cell size these images may represent cells in later stages of the cell cycle in which chromatin condenses, such as during the formation of the metaphase plate. Using the capability to measure chromatin content and local cell membrane deformation, we were able to determine that cells of similar size with different levels of deformation do not differ in their chromatin content, but in how the cytoskeletal cortex is likely deforming.
We further demonstrated the capabilities of the FI-DC by measuring neutrophils in early stages of undergoing NETosis. In NETosis, the neutrophil’s chromatin decondenses and is released extracellularly. We expected that at early stages during this process that we would be able to witness the visible spread of chromatin in the cell, as well as a change in mechanical properties. While we observed an increase in deformability over control cells, we did not witness the change in nuclear structure, likely because the timescale for nuclear membrane dissolution to chromatin ejection is rapid and difficult to capture in the early snapshot we interrogate. When we looked at longer times after PMA dosing (> 3h) we observed gross changes in neutrophil structure, which became very sticky to the culture vessels and were not usable for the suspended FI-DC measurements. Other inducers of NETosis, such as calcium ionophores, could be used in the future to induce NETosis to better link mechanical properties to various stages of this process.
In addition to measuring the change in mechanical properties in flow, we would like to be able to identify and eventually sort cells based on these properties, which may provide further utility in studying NETosing neutrophils. Using features calculated from the brightfield and FITC images, we developed a random forest classifier that was able to classify untreated and treated neutrophils with 85% accuracy. This classifier identified the large change in cell area of PMA-treated neutrophils as the most useful feature in classification. When excluding cell size-related features, we were still able to achieve a classification accuracy of almost 80%, with cell deformability and the bending factor of the back region of the cell being most important. More accurate classification may be possible with a neural network, but in our experiments, the cell populations were run through FI-DC separately, which could induce some batch effects in images. Finally, we aimed to classify cells that came from treated and untreated samples. But that does not address whether cells were NETosing. A more useful classifier would predict which cells are actively NETosing. NETosis status could perhaps be indicated by nuclear changes or staining for MPO [29]. In our case, we were unable to find a suitable fluorescent biomarker probe that did not require fixing or permeabilizing the neutrophils.
In the future, we would like to more completely characterize the NETosing landscape. This would entail measuring neutrophils that have been stimulated for different durations, with different PMA doses. We believe that with the dose and duration used here, the neutrophils have only just begun to undergo internal changes, and have not yet decondensed their chromatin, or broken down the nuclear envelope. One challenge we face in this regard is handling and preserving cells undergoing NETosis. This process makes them especially sticky and fragile, and we cannot fix the cells as some other imaging studies have done.
We also discuss the capabilities of our platform for future use. We have demonstrated the effect that fluid viscosity has on our ability to deform cells.
This type of shear flow deformability cytometry may be capable of deforming the nucleus, although that was not shown here [11]. It may be possible to achieve these higher levels of deformation by further increasing the viscosity of solutions, or by increasing the duration of time that the cells are being deformed. Furthermore, we can demonstrate our ability to differentiate cells in different stages of the cell cycle using the nuclear fluorescence images of FIDC. Cells in different cell stages have been shown to deform differently [2], but this required chemically synchronizing cells. With FI-DC, intricately designed experiments to ensure synchronized cells would become less necessary. Beyond imaging and characterizing nuclear structure, FI-DC may be leveraged to stain for other biomarkers or intracellular components, which will create a more complete understanding of cell identity and its resulting mechanical properties.
Materials and methods
Alginate solution preparation
Alginate solutions were prepared by dissolving sodium alginate in deionized water (sheath) or sterile PBS (sample). The solutions were stirred overnight at room temperature on a stir plate until visibly dissolved. Sample stream alginate solutions were prepared at 2 × concentration in order to reach proper concentration when added to cell solution.
Cells and treatment
The Jurkat cell line was cultured in ATCC-modified RPMI 1640 medium (Gibco) with 1% penicillin/streptomycin (Gibco), 1% 1 M HEPES buffer and 10% heat-inactivated FBS (Gibco). Cells were grown at 37 °C, with 5% CO2, at densities between 105 and 106 cells · mL−1 with subculturing every second day.
Neutrophil isolation
Neutrophils were isolated as previously described [37], and cultured in ATCC-modified RPMI 1640 medium (Gibco) with 1% penicillin/streptomycin (Gibco), 1% 1 M HEPES buffer and 2% heat-inactivated FBS (Gibco). Cells were cultured at 37 °C, with 5% CO2 in non-tissue treated well plates on an orbital shaker at densities between 5 × 10⁵ and 106 cells · mL−1.
Neutrophil stimulation
Neutrophils were stimulated at 2 nM PMA using 2 M PMA solution prepared in DMSO at 1:1,000 dilution. Unstimulated cells receive equivalent vehicle control of DMSO at 1:1,000 dilution. After stimulation and incubation on an orbital shaker in the incubator, neutrophils were collected following vigorous pipetting, followed by a PBS wash step. Cells were spun at 400 g for 5min and resuspended in 325 μL 1% BSA PBS solution. Cells were stained with 1 μL Syto16 nuclear stain and incubated on the orbital shaker in the incubator for 10 min. The solution was spiked with 3 μL of 10 μm fluorescent beads and 325 μL alginate solution was added to achieve a final alginate concentration. The solution was gravity filtered with a pre-wet 20 μm cell strainer before being loaded into a 1 mL syringe.
Device design and operation
Soft lithography was used to fabricate polydimethylsiloxane (PDMS) devices which were bonded to glass slides. The device has one sample inlet and two sheath flow inlets that meet and flow together through a straight channel. The straight channel has a width of 25 μm and height of 30 μm. The sample stream was injected via syringe pump at 10 μL · min−1, and each of the sheath flow were injected at 5 μL · min−1. Cells were imaged via FIRE in the middle of the straight channel section. The FIRE equipment was operated with a 488 nm laser operating at 80 mW with a FITC (529/28 nm) bandpass filter. The transmitted light was measured using a photodiode to generate brightfield images while side scattered light was collected with a PMT to generate darkfield images. Image capture was triggered by a sufficiently low fluorescence signal threshold to capture any object with fluorescence in the FITC channel. All generated images have a pixel pitch of 0.25 μm per pixel. Devices were cleaned after each use by running 800 μL dilute bleach followed by 800 μL PBS through the tubing and device between each sample. Images are analyzed by custom Python scripts.
Cell image classification with neural network
A neural network was trained to distinguish clean images of single cells from debris, dead cells, doublets, etc. A VGG16 architecture pretrained on ImageNet [38] was finetuned on 48,000 FIRE images using Keras and TensorFlow2. Results were human verified and corrected to ensure only single, live cell images were analyzed.
Cell segmentation with U-Net
Segmentation of cells and nuclear structure, from brightfield and FITC images, respectively was performed by a U-Net neural network [33]. The brightfield and FITC image neural networks were trained on 560 and 275 FIRE cell images, respectively. We filled in holes and performed small morphological opening and closing on cell binary images.
Contour extraction and smoothing
Boundaries of cells and nuclei were extracted from binary masks. Boundaries were smoothed to remove pixelation effects by first downsampling so that all vertices are 1.5 pixels widths apart, followed by local regression. Standard shape measurements are extracted from the boundaries including cell area, width, length, and perimeter.
Calculation of bending factor
For easy comparison, all cell and nucleus boundaries were converted to polar coordinates and interpolated to 120 points (3° apart). Curvature along the arc length parametrized boundaries (κ(s)) was calculated at each point according to [34]:
$\kappa(s)=\frac{x(s)^{\prime} y(s)^{\prime \prime}-y(s)^{\prime} x(s)^{\prime \prime}}{\left(x(s)^{\prime 2}+y(s)^{\prime 2}\right)^{3 / 2}}$
The scale-invariant bending factor (known as scale-invariant bending energy in other fields) was calculated from the curvature along the boundaries and allowed for comparison of similar shapes of different size, where P is the perimeter along the boundary [35]:
$B=P \int_{0}^{P} \kappa(s)^{2} d s$
Finally, the bending factor of a portion of the boundary from a to b can be calculated as well:
$B_{a b}=P \int_{a}^{b} \kappa(s)^{2} d s$
Bayesian inference
Bayesian inference is conducted with PyMC [39] and No U-Turn Markov chain Monte Carlo (MCMC) Sampler [40] to model relative deformability distributions as a t-distribution (See Supp Fig. S1 for model structure). Posterior distributions of the mean and scale parameters are compared within Donors, to assess the changes due to PMA treatment.
Supplementary Information The online version contains supplementary material available at https://doi.org/10.1007/s44258-023-00008-w.
Acknowledgements The authors acknowledge the use of the UCLA Nanofabrication Laboratory (NanoLab) for microfluidic device fabrication.
Authors’ contributions H.E.M. and D.D. designed the study. H.E.M. conducted experiments along with J.L., B.G.Y., and T.B. H.E.M performed data analysis with the help of T.B. and other authors. H.E.M. and D.D. wrote the manuscript with review by all authors.
Funding This work is supported by ImPACT Program of the Council of Science, Technology and Innovation (Cabinet office, Government of Japan) and the Presidential Early Career Award for Scientists and Engineers to D.D. (N00014-16-1-2997).
Availability of data and materials Materials and data are available on request to the authors.
Declarations
Ethics approval and consent to participate Not applicable
Consent to participate Not applicable
Consent for publication Not applicable
Competing interests Author Dino Di Carlo is a member of the Executive Editors-in-Chief for Med-X. The paper was handled by another Editor and has undergone a rigorous peer review process. Author Dino Di Carlo was not involved in the journal's peer review of, or decisions related to, this manuscript.
D.D. and the Regents of the University of California have financial interests in Cytovale Inc., which is commercializing deformability cytometry technology.
Open Access This article is licensed under a Creative Commons Attribution 4.0 International License, which permits use, sharing, adaptation, distribution and reproduction in any medium or format, as long as you give appropriate credit to the original author(s) and the source, provide a link to the Creative Commons licence, and indicate if changes were made. The images or other third party material in this article are included in the article's Creative Commons licence, unless indicated otherwise in a credit line to the material. If material is not included in the article's Creative Commons licence and your intended use is not permitted by statutory regulation or exceeds the permitted use, you will need to obtain permission directly from the copyright holder. To view a copy of this licence, visit http://creativecommons.org/licenses/by/4.0/.
Publisher’s Note Springer Nature remains neutral with regard to jurisdictional claims in published maps and institutional affiliations.
