诊断学理论与实践 ›› 2020, Vol. 19 ›› Issue (03): 314-318.doi: 10.16150/j.1671-2870.2020.03.020
于一飞, 王之倩, 李敏, 柳俊, 詹维伟( )
)
收稿日期:2020-02-13
出版日期:2020-06-25
发布日期:2020-06-25
通讯作者:
詹维伟
E-mail:shanghairuijin@126.com
YU Yifei, WANG Zhiqian, LI Min, LIU Jun, ZHAN Weiwei()
Received:2020-02-13
Online:2020-06-25
Published:2020-06-25
Contact:
ZHAN Weiwei
E-mail:shanghairuijin@126.com
摘要:
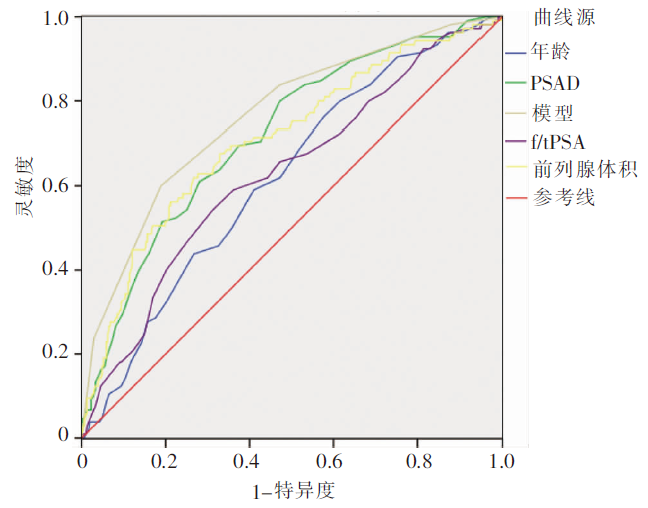
目的: 自建评分法评估前列腺特异性抗原(prostate specific antigen,PSA)值处在灰区(PSA值灰区)的前列腺疾病患者为前列腺癌的风险度,并验证其诊断价值。方法: 2017年4月至2019年11月期间,回顾性分析在我院行超声引导下经会阴前列腺穿刺活检的412例PSA值处于灰区(4~10 μg/L)前列腺疾病患者的资料,应用U检验及卡方检验比较良、恶性前列腺疾病组间的年龄、前列腺体积、血清学指标 、PSA密度(prostate specific antigen density, PSAD)及直肠腔内超声(transrectal ultrasonography, TRUS)影像学表现差异,绘制受试者操作特征(receiver operating characteristic,ROC)曲线,确定有效参数曲线下面积最大时的临界值,建立PSA值灰区前列腺疾病患者恶性风险度评分,以前列腺穿刺活检为标准,绘制ROC曲线评估其诊断效能。结果: 良、恶性前列腺疾病组间,年龄、前列腺体积、游离/总前列腺特异性抗原比值(free/total prostate specific antigen ratio,f/t PSA)、PSAD及TRUS检出可疑结节方面差异均有统计学意义(P均<0.05)。应用年龄、前列腺体积、f/t PSA、PSAD及TRUS影像表现建立PSA值灰区前列腺疾病患者恶性风险度评分,总分0~5分患者的前列腺癌风险分别为3.12%、9.57%、18.02%、30.48%、53.45%及100%,采用该评分法(>2.5分)在PSA值灰区患者中诊断前列腺癌的ROC曲线下面积为0.759,灵敏度为71.41%,特异度为67.39%,优于其他单项指标。结论: 本研究新建立的前列腺疾病恶性风险度评分能有效评估PSA值处于灰区患者的前列腺癌风险。
中图分类号:
于一飞, 王之倩, 李敏, 柳俊, 詹维伟. 自建评分法评估前列腺特异性抗原值在灰区者的前列腺癌风险[J]. 诊断学理论与实践, 2020, 19(03): 314-318.
YU Yifei, WANG Zhiqian, LI Min, LIU Jun, ZHAN Weiwei. A self-established scoring method for risk stratification of prostate cancer in subjects with gray zone PSA[J]. Journal of Diagnostics Concepts & Practice, 2020, 19(03): 314-318.
表1
良性与恶性组间年龄、血清学指标及超声参数
| 指标 | 良性(n=307) | 恶性(n=105) | P值 |
|---|---|---|---|
| 年龄(岁) | 65.59±8.02 | 68.65±7.20 | 0.01 |
| 前列腺体积(mL) | 48.48±18.17 | 36.93±16.45 | <0.01 |
| PSA(μg/L) | 7.05 | 7.50 | 0.52 |
| fPSA(μg/L) | 1.27 | 1.16 | 0.32 |
| PSAD(ng/mL2) | 0.15 | 0.23 | <0.01 |
| f/t PSA | 0.19 | 0.15 | <0.01 |
表2
良、恶性组TRUS影像表现
| 表现 | 良性(n) | 恶性(n) | 合计(n) | P值 | χ2值 |
|---|---|---|---|---|---|
| TRUS阴性 | 195 | 55 | 250 | ||
| TRUS阳性 | 112 | 50 | 162 | 0.04 | 4.07 |
| 合计 | 307 | 105 | 412 |
表3
评分结果及恶性率
| 评分 | 良性(n) | 恶性(n) | 合计(n) | 恶性率(%) |
|---|---|---|---|---|
| 0分 | 31 | 1 | 32 | 3.12 |
| 1分 | 85 | 9 | 94 | 9.57 |
| 2分 | 91 | 20 | 111 | 18.02 |
| 3分 | 73 | 32 | 105 | 30.48 |
| 4分 | 27 | 31 | 58 | 53.45 |
| 5分 | 0 | 12 | 12 | 100 |
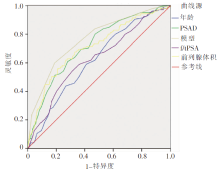
图1
前列腺疾病恶性风险度评分及各项风险因素的ROC曲线
| [1] |
Siegel RL, Miller KD, Jemal A. Cancer statistics, 2017[J]. CA Cancer J Clin, 2017, 67(1):7-30.
doi: 10.3322/caac.21387 URL |
| [2] | 韩苏军, 张思维, 陈万青, 等. 中国前列腺癌发病现状和流行趋势分析[J]. 临床肿瘤杂志, 2013, 18(4):330-334. |
| [3] | 吴健民. PSA检测前列腺癌临床应用的建议[J]. 诊断学理论与实践, 2005, 4(3):181-184. |
| [4] | 那彦群, 叶章群, 孙颖浩, 等. 中国泌尿外科疾病诊断治疗指南手册(2014版)[M]//前列腺癌诊断与治疗指南. 北京: 人民卫生出版社, 2014:61-81. |
| [5] |
Smith DS, Humphrey PA, Catalona WJ. The early detection of prostate carcinoma with prostate specific antigen: The Washington University experience[J]. Cancer, 1997, 80(9):1852-1856.
pmid: 9351559 |
| [6] |
Lee SJ. Infection after transrectal ultrasound-guided prostate biopsy[J]. Korean J Urol, 2015, 56(5):346-350.
doi: 10.4111/kju.2015.56.5.346 URL |
| [7] |
Huang GL, Kang CH, Lee WC, et al. Comparisons of cancer detection rate and complications between transrectal and transperineal prostate biopsy approaches - a single center preliminary study[J]. BMC Urol, 2019, 19(1):101.
doi: 10.1186/s12894-019-0539-4 URL |
| [8] |
Bray F, Ferlay J, Soerjomataram I, et al. Global cancer statistics 2018: GLOBOCAN estimates of incidence and mortality worldwide for 36 cancers in 185 countries[J]. CA Cancer J Clin, 2018, 68(6):394-424.
doi: 10.3322/caac.21492 URL |
| [9] |
Thompson IM, Goodman PJ, Tangen CM, et al. The influence of finasteride on the development of prostate cancer[J]. N Engl J Med, 2003, 349(3):215-224.
doi: 10.1056/NEJMoa030660 URL |
| [10] |
Filella X, Albaladejo MD, Allué JA, et al. Prostate cancer screening: Guidelines review and laboratory issues[J]. Clin Chem Lab Med, 2019, 57(10):1474-1487.
doi: 10.1515/cclm-2018-1252 pmid: 31120856 |
| [11] | Catalona WJ, Richie JP, Ahmann FR, et al. Comparison of digital rectal examination and serum prostate specific antigen in the early detection of prostate cancer: Results of a multicenter clinical trial of 6,630 men[J]. J Urol, 2017, 197(2S):S200-S207. |
| [12] |
Jiang CY, Shen PF, Wang C, et al. Comparison of diagnostic efficacy between transrectal and transperineal prostate biopsy: A propensity score-matched study[J]. Asian J Androl, 2019, 21(6):612-617.
doi: 10.4103/aja.aja_16_19 URL |
| [13] | 陈彪, 陈立军, 麦海星, 等. 经会阴前列腺饱和分层穿刺在前列腺特异性抗原灰区患者中诊断前列腺癌的临床研究[J]. 中华临床医师杂志(电子版), 2013, 7(6):2404-2406. |
| [14] |
Ouzaid I, Yates DR, Hupertan V, et al. A direct compa-rison of the diagnostic accuracy of three prostate cancer nomograms designed to predict the likelihood of a positive initial transrectal biopsy[J]. Prostate, 2012, 72(11):1200-1206.
doi: 10.1002/pros.22470 pmid: 22213470 |
| [15] |
Liu J, Wang ZQ, Li M, et al. Establishment of two new predictive models for prostate cancer to determine whether to require prostate biopsy when the PSA level is in the diagnostic gray zone(4-10) ng ml(-1)[J]. Asian J Androl, 2020, 22(2):213-216.
doi: 10.4103/aja.aja_46_19 URL |
| [16] |
Wang L, Wang XF, Zhao WF, et al. Surface-projection-based transperineal cognitive fusion targeted biopsy of the prostate: an original technique with a good cancer detection rate[J]. BMC Urol, 2019, 19(1):107.
doi: 10.1186/s12894-019-0535-8 pmid: 31684917 |
| [17] | Gorin MA, Meyer AR, Zimmerman M, et al. Transpe-rineal prostate biopsy with cognitive magnetic resonance imaging/biplanar ultrasound fusion: description of technique and early results[J/OL]. World J Urol, 2019-11-02[2020-02-13]. https://pubmed.ncbi.nlm.nih.gov/31679065/. |
| [18] | Sönmez G, Tombul T, Demirta T, et al. A comparative study: Has MRI-guided fusion prostate biopsy changed the prostate-specific antigen gray-zone range?[J]. Cureus, 2019, 11(12):e6329. |
| [1] | 施霞, 马鑫, 王珍燕, 张晖, 刘少军. 32例人类免疫缺陷病毒感染合并慢性肾病患者的临床病理特征及随访结果分析[J]. 诊断学理论与实践, 2022, 21(04): 437-443. |
| [2] | 王文涵, 夏蜀珺, 詹维伟. 长链非编码RNA ENST00000489676在超声评估甲状腺乳头状癌颈部淋巴结转移中的应用[J]. 诊断学理论与实践, 2022, 21(04): 514-519. |
| [3] | 上海交通大学医学院附属瑞金医院肺小结节诊治和管理学科群专家组. 肺结节活检术风险管理瑞金专家共识[J]. 诊断学理论与实践, 2022, 21(01): 22-31. |
| [4] | 周建桥, 詹维伟. 2020年中国超声甲状腺影像报告和数据系统(C-TIRADS)指南解读[J]. 诊断学理论与实践, 2020, 19(04): 350-353. |
| [5] | 王星, 汪蓉晖, 张桂萍, 董屹婕, 周伟, 詹维伟. 10 388个甲状腺结节行超声引导下细针抽吸活检的甲状腺癌各亚型诊断准确率的10年研究[J]. 诊断学理论与实践, 2020, 19(04): 359-363. |
| [6] | 洪贵平, 陈晓炎, 周剑平, 陈巍, 项轶, 周敏, 李庆云. 超声引导下经支气管针吸活检在老年患者肺门及纵隔病变中的诊断价值及漏诊分析[J]. 诊断学理论与实践, 2020, 19(04): 397-401. |
| [7] | 郭艳, 葛娟娟, 陈晨, 尹吉明, 王小龙, 陈家庚, 杜燕伟, 段园园, 凡雪霖, 郑磊, 王西勇, 詹维伟, 张璐. 细针穿刺活检联合RJ-TIRADS在诊断老年甲状腺结节良恶性中的价值[J]. 诊断学理论与实践, 2020, 19(03): 286-291. |
| [8] | 叶成林, 姚永华, 陈真, 贾麟. 骨髓活检塑胶包埋在以单纯血小板减少为表现的骨髓增生异常综合征诊断中的应用价值[J]. 诊断学理论与实践, 2020, 19(02): 177-181. |
| [9] | 王涛, 邓玉, 赵萍, 于宝华, 王翔, 王朝夫. 基于癌症基因图谱挖掘前列腺癌不同Gleason分级癌组织相关基因分析[J]. 诊断学理论与实践, 2018, 17(06): 694-700. |
| [10] | 李芹芹, 叶廷军, 毛敏静. 甲状腺细针穿刺细胞学检查与甲状腺影像报告和数据系统分级对照分析[J]. 诊断学理论与实践, 2017, 16(06): 607-611. |
| [11] | 金晶晶, 肖立, 顾晏, 殷于磊. 肾活检免疫组织化学法与免疫荧光直接法染色结果比较[J]. 诊断学理论与实践, 2017, 16(01): 79-83. |
| [12] | 浦杰, 石军, 陈真, 姚永华, 浦权,. 骨髓活检标本乙二醇-甲基丙烯酸酯塑胶包埋切片免疫组织化学检测的研究[J]. 诊断学理论与实践, 2016, 15(03): 312-316. |
| [13] | 董振阳, 贾高臻, 高旭, 许传亮, 杨成华,. 前列腺癌肿瘤标志物的研究现况及进展[J]. 诊断学理论与实践, 2016, 15(02): 195-198. |
| [14] | 陈克敏, 黄蔚, 吴志远,. 肝脏病变活检的临床应用[J]. 诊断学理论与实践, 2015, 14(04): 301-303. |
| [15] | 刘晶晶, 陈克敏,. CT引导下经皮穿刺活检术在体部小病灶中的应用价值[J]. 诊断学理论与实践, 2015, 14(03): 275-278. |
| 阅读次数 | ||||||
|
全文 |
|
|||||
|
摘要 |
|
|||||