Journal of Diagnostics Concepts & Practice ›› 2019, Vol. 18 ›› Issue (03): 278-285.doi: 10.16150/j.1671-2870.2019.03.007
• Original articles • Previous Articles Next Articles
ZHU Lan1, GU Shengjia1, CHEN Chihua1, CAO Qiqi1, ZHOU Xiaoyue2, YAN Fuhua1, MIN Jihua1( )
)
Received:2019-04-17
Online:2019-06-25
Published:2019-06-25
Contact:
MIN Jihua
E-mail:mjh40471@rjh.com.cn
CLC Number:
ZHU Lan, GU Shengjia, CHEN Chihua, CAO Qiqi, ZHOU Xiaoyue, YAN Fuhua, MIN Jihua. The value of myocardial deformation analysis based on deformable registration algorithm in the diagnosis and prediction of prognosis of hypertrophic cardiomyopathy[J]. Journal of Diagnostics Concepts & Practice, 2019, 18(03): 278-285.
| 分组 | 对照组 | HCM组 | P值 |
|---|---|---|---|
| 男性(n) | 18(78.26%) | 18(78.26%) | / |
| 年龄(岁) | 50.26±8.66 | 50.70±14.18 | 0.901 |
| 身高(cm) | 167.65±4.42 | 166.57±7.15 | 0.539 |
| 体重(kg) | 65.83±65.57 | 72.17±15.00 | 0.067 |
| 心率(次/分) | 65.78±7.66 | 65.61±8.94 | 0.944 |
| BSA(m2) | 1.71±0.09 | 1.79±0.22 | 0.141 |
| EDV(mL) | 109.53±20.58 | 131.08±25.93 | 0.003 |
| EDVI(mL/m2) | 63.92±11.26 | 73.81±14.02 | 0.011 |
| ESV(mL) | 45.59±13.81 | 55.55±14.86 | 0.023 |
| ESVI(mL/m2) | 26.60±7.82 | 31.31±8.66 | 0.049 |
| EDM(g) | 82.08±17.62 | 195.57±87.64 | <0.001 |
| EDMI(g/m2) | 47.73±8.88 | 109.74±17.54 | <0.001 |
| ESM(g) | 82.63±18.73 | 194.78±16.89 | <0.001 |
| ESMI(g/m2) | 48.02±9.40 | 109.15±16.38 | <0.001 |
| SV(mL) | 63.94±9.09 | 75.53±16.17 | 0.004 |
| LVEF(%) | 59.06±6.25 | 58.00±7.86 | 0.614 |
| 部位 | 组别 | 径向应变 | 环向应变 | 纵向应变 | |||||
|---|---|---|---|---|---|---|---|---|---|
| 峰值(%) | 率比值 | 峰值(%) | 率比值 | 峰值(%) | 率比值 | ||||
| 整体 | 对照组 | 29.08±5.87 | 3.42±0.67 | -15.43±1.43 | 2.67±1.45 | -12.92±1.85 | 2.28±0.55 | ||
| HCM组 | 23.77±10.14 | 1.73±0.55 | -11.15±3.55 | 1.45±0.90 | -8.16±4.34 | 1.18±0.54 | |||
| P值 | 0.037 | <0.001 | <0.001 | <0.001 | <0.001 | <0.001 | |||
| 基底部 | 对照组 | 38.33±9.02 | 3.34±0.69 | -17.15±2.53 | 2.78±0.76 | -22.90±3.34 | 2.16±0.68 | ||
| HCM组 | 23.81±11.42 | 1.66±0.99 | -11.88±3.60 | 1.67±1.36 | -15.34±5.85 | 1.41±0.79 | |||
| P值 | <0.001 | <0.001 | <0.001 | <0.001 | <0.001 | <0.001 | |||
| 中部 | 对照组 | 38.25±8.08 | 3.73±1.04 | -16.64±2.37 | 3.51±1.18 | -20.41±3.31 | 3.05±1.28 | ||
| HCM组 | 24.29±10.90 | 1.65±0.90 | -11.70±4.86 | 1.65±1.39 | -14.28±6.39 | 1.43±0.76 | |||
| P值 | <0.001 | <0.001 | <0.001 | <0.001 | <0.001 | <0.001 | |||
| 心尖部 | 对照组 | 37.97±7.74 | 3.61±1.04 | -17.45±2.49 | 3.15±1.25 | -20.48±3.90 | 2.54±1.10 | ||
| HCM组 | 27.34±10.37 | 1.95±1.15 | -15.11±6.93 | 1.98±1.44 | -16.35±6.82 | 1.78±1.06 | |||
| P值 | <0.001 | <0.001 | 0.139 | 0.005 | 0.016 | 0.02 | |||
| 部位 | LGE分组 | 例数(n) | 径向应变(%) | P值 | 环向应变(%) | 纵向应变(%) | P值 | ||
|---|---|---|---|---|---|---|---|---|---|
| 基底部 | HCM组 | + | 16 | 18.44±8.37 | <0.001a) | -10.09±2.03 | <0.001a) | -13.61±4.17 | <0.001a) |
| - | 7 | 36.07±7.15 | <0.001b) | -15.98±3.00 | <0.001b) | -20.02±3.83 | <0.001b) | ||
| 对照组 | 23 | 38.33±9.02 | 0.538c) | -17.15±2.53 | 0.310c) | -22.90±3.34 | 0.080c) | ||
| P值 | <0.001 | <0.001 | <0.001 | ||||||
| 中部 | HCM组 | + | 16 | 18.86±5.99 | <0.001b) | -9.40±3.21 | <0.001a) | -13.26±5.66 | 0.003a) |
| - | 7 | 36.70±9.35 | <0.001b) | -16.94±3.83 | <0.001b) | -19.35±3.13 | <0.001b) | ||
| 对照组 | 23 | 38.25±8.08 | 0.633c) | -16.64±2.37 | 0.839c) | -20.41±3.31 | 0.566c) | ||
| P值 | 0.002 | <0.001 | <0.001 | ||||||
| 心尖部 | HCM组 | + | 10 | 17.5±5.22 | <0.001b) | -9.79±2.47 | <0.001a) | -10.41±3.57 | <0.001a) |
| - | 13 | 34.91±5.84 | <0.001b) | -19.2±6.45 | <0.001b) | -20.92±4.87 | <0.001b) | ||
| 对照组 | 23 | 37.97±7.74 | 0.118c) | -16.28±5.28 | 0.215c) | -20.48±3.90 | 0.772c) | ||
| P值 | <0.001 | <0.001 | <0.001 |
| 部位 | 分组 | LGE | 例数 | 径向比值 | P值 | 环向比值 | P值 | 纵向比值 | P值 |
|---|---|---|---|---|---|---|---|---|---|
| 基底部 | HCM | + | 16 | 1.13±0.47 | <0.001a) | 0.90±0.49 | <0.001a) | 0.98±0.36 | <0.001a) |
| - | 7 | 2.87±0.79 | <0.001b) | 3.40±1.05 | <0.001b) | 2.41±0.55 | <0.001b) | ||
| 对照组 | 23 | 3.73±1.04 | 0.155c) | 2.78±0.76 | 0.049c) | 2.16±0.68 | 0.317c) | ||
| P值 | 0.001 | <0.001 | <0.001 | ||||||
| 中部 | HCM | + | 16 | 1.17±0.49 | <0.001a) | 0.96±0.58 | <0.001a) | 1.03±0.39 | 0.004a) |
| - | 7 | 2.75±0.56 | <0.001b) | 3.23±1.44 | <0.001b) | 2.36±0.54 | <0.001b) | ||
| 对照组 | 23 | 3.45±1.13 | 0.007c) | 3.51±1.18 | 0.896c) | 3.05±1.28 | 0.103c) | ||
| P值 | <0.001 | <0.001 | <0.001 | ||||||
| 心尖部 | HCM | + | 10 | 1.13±0.36 | <0.001a) | 2.59±1.15 | <0.001a) | 3.61±1.04 | <0.001a) |
| - | 13 | 2.59±1.15 | <0.001b) | 2.38±1.83 | <0.001b) | 3.15±1.25 | <0.001b) | ||
| 对照组 | 23 | 3.61±1.04 | 0.008c) | 3.15±1.25 | 0.426c) | 2.54±1.10 | 0.817c) | ||
| P值 | <0.001 | <0.001 | <0.001 |
| 部位 | LGE | 例数 | 心肌最大厚度(mm) | P值 |
|---|---|---|---|---|
| 基底部 | LGE (+) | 16 | 15.21±4.02 | 0.012 |
| LGE (-) | 7 | 21.48±5.36 | ||
| 中部 | LGE (+) | 16 | 17.83±3.27 | 0.336 |
| LGE (-) | 7 | 16.07±5.26 | ||
| 心尖部 | LGE (+) | 10 | 12.37±4.39 | 0.007 |
| LGE (-) | 13 | 17.58±3.90 |
| 参数 | 基底部心肌厚度 [(19.57±5.72) mm] | 中部心肌厚度 [(17.30±3.94) mm] | 心尖部心肌厚度 [(14.64±4.87) mm] | 整体心肌厚度 [(17.17±5.23) mm] | |||||||
|---|---|---|---|---|---|---|---|---|---|---|---|
| r值 | P值 | r值 | P值 | r值 | P值 | r值 | P值 | ||||
| PRS | -0.454 | 0.029 | -0.348 | 0.103 | -0.410 | 0.052 | -0.422 | <0.001 | |||
| PCS | 0.513 | 0.012 | 0.350 | 0.101 | 0.413 | 0.05 | 0.446 | <0.001 | |||
| PLS | 0.408 | 0.054 | 0.363 | 0.089 | 0.588 | 0.003 | -0.498 | <0.001 | |||
| REL | -0.662 | 0.001 | -0.222 | 0.309 | -0.453 | 0.030 | -0.540 | <0.001 | |||
| CEL | -0.582 | 0.004 | -0.448 | 0.032 | -0.604 | 0.002 | 0.449 | <0.001 | |||
| LEL | -0.398 | 0.06 | -0.471 | 0.023 | -0.586 | 0.003 | -0.504 | <0.001 | |||
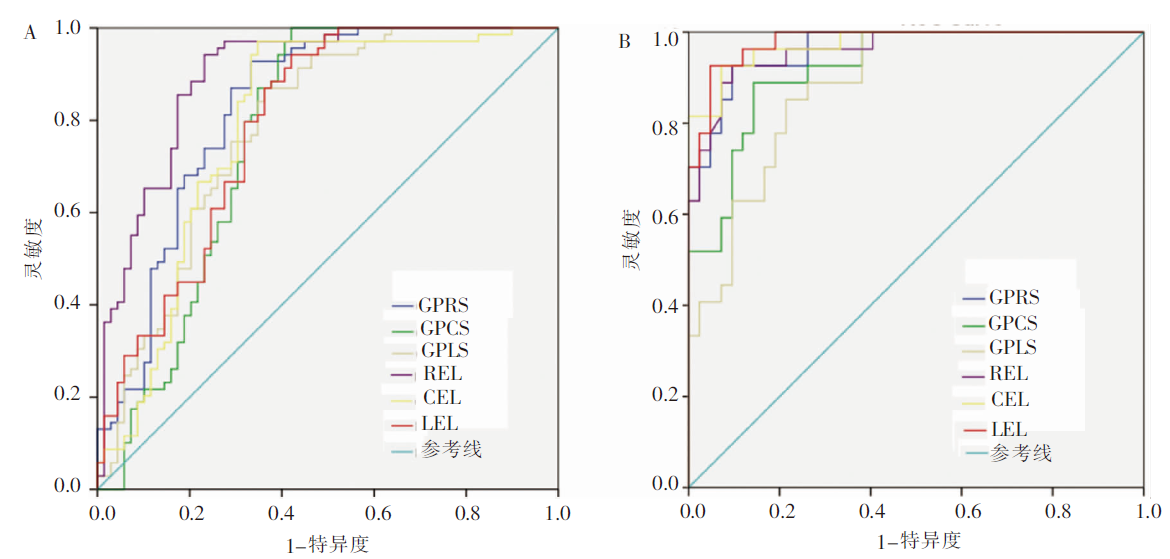
| 参数 | 特异度(%) | 灵敏度(%) | 最佳临界值 | 曲线下面积 | P值 | |
|---|---|---|---|---|---|---|
| GPRS | LGE(+)与LGE(-) | 92.59 | 90.48 | ≤25.96 | 0.965(0.890,0.994) | <0.001 |
| HCM与对照组 | 95.65 | 47.83 | ≤28.31 | 0.686(0.533,0.815) | <0.001 | |
| GPCS | LGE(+)与LGE(-) | 88.89 | 85.71 | >-11.46 | 0.922(0.832,0.973) | <0.001 |
| HCM与对照组 | 91.3 | 86.96 | >-12.44 | 0.905(0.782,0.972) | <0.001 | |
| GPLS | LGE(+)与LGE(-) | 85.19 | 78.57 | >-17.38 | 0.884(0.784,0.948) | <0.001 |
| HCM与对照组 | 100 | 78.26 | >-17.46 | 0.921(0.802,0.980) | <0.001 | |
| REL | LGE(+)与LGE(-) | 92.59 | 90.48 | ≤2.00 | 0.962(0.885,0.993) | <0.001 |
| HCM与对照组 | 100 | 86.96 | ≤2.26 | 0.972(0.874,0.999) | <0.001 | |
| CEL | LGE(+)与LGE(-) | 100 | 69.57 | ≤2.12 | 0.871(0.740,0.952) | <0.001 |
| HCM与对照组 | 92.59 | 92.86 | ≤1.67 | 0.974(0.904,0.997) | <0.001 | |
| LEL | LGE(+)与LGE(-) | 92.59 | 95.24 | ≤1.57 | 0.980(0.913,0.999) | <0.001 |
| HCM与对照组 | 86.96 | 86.96 | ≤1.46 | 0.917(0.797,0.978) | <0.001 |
| [1] |
Maron BJ, Maron MS. Hypertrophic cardiomyopathy[J]. Lancet, 2013, 381(9862):242-255.
doi: 10.1016/S0140-6736(12)60397-3 URL |
| [2] | Maron BJ. Hypertrophic cardiomyopathy: a systematic review[J]. JAMA, 2002, 287(10):1308-1320. |
| [3] |
Basso C, Thiene G, Corrado D, et al. Hypertrophic cardiomyopathy and sudden death in the young: pathologic evidence of myocardial ischemia[J]. Hum Pathol, 2000, 31(8):988-998.
pmid: 10987261 |
| [4] |
Gersh BJ, Maron BJ, Bonow RO, et al. 2011 ACCF/AHA guideline for the diagnosis and treatment of hypertrophic cardiomyopathy: executive summary: a report of the American College of Cardiology Foundation/American Heart Association Task Force on Practice Guidelines[J]. J Am Coll Cardiol, 2011, 58(25):2703-2738.
doi: 10.1016/j.jacc.2011.10.825 URL |
| [5] |
Authors/Task Force members, Elliott PM, Anastasakis A, et al. 2014 ESC Guidelines on diagnosis and management of hypertrophic cardiomyopathy: the Task Force for the Diagnosis and Management of Hypertrophic Cardiomyopathy of the European Society of Cardiology (ESC)[J]. Eur Heart J, 2014, 35(39):2733-2779.
doi: 10.1093/eurheartj/ehu284 pmid: 25173338 |
| [6] |
Ismail TF, Jabbour A, Gulati A, et al. Role of late gadolinium enhancement cardiovascular magnetic resonance in the risk stratification of hypertrophic cardiomyo-pathy[J]. Heart, 2014, 100(23):1851-1858.
doi: 10.1136/heartjnl-2013-305471 URL |
| [7] | 王辉, 晏子旭, 姜红, 等. 心脏磁共振应变分析在临床前期心尖肥厚型心肌病中的应用[J]. 中国医学影像学杂志, 2019, 27(1):1-5. |
| [8] | 李雪莲, 黄为, 高见书, 等. 延迟增强磁共振成像预测肥厚型心肌病心肌纤维化与不良终点事件相关性的Meta分析[J]. 临床放射学杂志, 2018, 37(11):1824-1829. |
| [9] | 李元程, 王杰, 陈玉成. 肥厚型心肌病基因型与磁共振表型的关联性研究进展[J]. 心血管病学进展, 2019, 40(2):157-161. |
| [10] | 桑银保. 磁共振成像对肥厚性心肌病诊断及临床意义的探讨研究[J]. 大家健康(下旬版), 2015, 9(9):71-72. |
| [11] |
O'Hanlon R, Grasso A, Roughton M, et al. Prognostic significance of myocardial fibrosis in hypertrophic cardiomyopathy[J]. J Am Coll Cardiol, 2010, 56(11):867-874.
doi: 10.1016/j.jacc.2010.05.010 pmid: 20688032 |
| [12] |
Kraigher-Krainer E, Shah AM, Gupta DK, et al. Impaired systolic function by strain imaging in heart failure with preserved ejection fraction[J]. J Am Coll Cardiol, 2014, 63(5):447-456.
doi: 10.1016/j.jacc.2013.09.052 pmid: 24184245 |
| [13] | Macron L, Redheuil A, Ashrafpoor G, et al. Global circumferential left ventricular strain impairment in hypertrophic cardiomyopathy: comparison to left ventricular hypertrophy and late gadolinium enhancement[J]. J of Cardiovasc Magn Reson, 2013, 15(S1). |
| [14] |
Orwat S, Kempny A, Diller GP, et al. Cardiac magnetic resonance feature tracking: a novel method to assess myocardial strain. Comparison with echocardiographic speckle tracking in healthy volunteers and in patients with left ventricular hypertrophy[J]. Kardiol Pol, 2014, 72(4):363-371.
doi: 10.5603/KP.a2013.0319 URL |
| [15] |
Haland TF, Almaas VM, Hasselberg NE, et al. Strain echocardiography is related to fibrosis and ventricular arrhythmias in hypertrophic cardiomyopathy[J]. Eur Heart J Cardiovasc Imaging, 2016, 17(6):613-621.
doi: 10.1093/ehjci/jew005 pmid: 26873460 |
| [16] |
Gao H, Allan A, McComb C, et al. Left ventricular strain and its pattern estimated from cine CMR and validation with DENSE[J]. Phys Med Biol, 2014, 59(13):3637-3656.
doi: 10.1088/0031-9155/59/13/3637 URL |
| [17] |
Wang J, Li W, Sun J, et al. Improved segmental myocardial strain reproducibility using deformable registration algorithms compared with feature tracking cardiac MRI and speckle tracking echocardiography[J]. J Magn Reson Imaging, 2018, 48(2):404-414.
doi: 10.1002/jmri.25937 pmid: 29283466 |
| [18] | Meng L, Lin K, Collins J, et al. Automated Description of Regional Left Ventricular Motion in Patients With Cardiac Amyloidosis: A Quantitative Study Using Heart Deformation Analysis[J]. Am J Roentgenol, 2017, 209(2):W57-W63. |
| [19] | 陈炎, 陈亚蓓, 陶荣芳. 欧洲心脏病学会2014年肥厚性心肌病诊断管理指南要点介绍[J]. 中国实用内科杂志, 2015, 35(S1):170-172. |
| [20] |
Nucifora G, Muser D, Gianfagna P, et al. Systolic and diastolic myocardial mechanics in hypertrophic cardiomyopathy and their link to the extent of hypertrophy, replacement fibrosis and interstitial fibrosis[J]. Int J Cardiovasc Imaging, 2015, 31(8):1603-1610.
doi: 10.1007/s10554-015-0720-0 pmid: 26210792 |
| [21] |
Hinojar R, Fernández-Golfín C, González-Gómez A, et al. Prognostic implications of global myocardial mechanics in hypertrophic cardiomyopathy by cardiovascular magnetic resonance feature tracking. Relations to left ventricular hypertrophy and fibrosis[J]. Int J Cardiol, 2017, 249:467-472.
doi: S0167-5273(17)30710-6 pmid: 29121751 |
| [22] |
Popescu BA, Ro?ca M. Imaging of myocardial fibrosis in hypertrophic cardiomyopathy: what is the gold standard?[J]. Heart, 2014, 100(8):605-606.
doi: 10.1136/heartjnl-2013-305359 pmid: 24459293 |
| [23] |
Germans T, Rüssel IK, Gütte MJ, et al. How do hypertrophic cardiomyopathy mutations affect myocardial function in carriers with normal wall thickness? Assessment with cardiovascular magnetic resonance[J]. J Cardiovasc Magn Reson, 2010, 12:13.
doi: 10.1186/1532-429X-12-13 URL |
| [24] | Kino A, Carr J, Bonow R, et al. Association of Left Ventricular Wall Thickness and Myocardial Fibrosis/Scar with Adverse Events in Hypertrophic Cardiomyopathy: Interaction of Maximal Wall Thickness and Late Gadolinium Enhancement by Cardiac Magnetic Resonance[C]. J Am College Cardiol, 2012, 59(13):. |
| [25] |
Bogarapu S, Puchalski MD, Everitt MD, et al. Novel Cardiac Magnetic Resonance Feature Tracking (CMR-FT) Analysis for Detection of Myocardial Fibrosis in Pediatric Hypertrophic Cardiomyopathy[J]. Pediatr Cardiol, 2016, 37(4):663-673.
doi: 10.1007/s00246-015-1329-8 URL |
| [26] |
Reant P, Mirabel M, Lloyd G, et al. Global longitudinal strain is associated with heart failure outcomes in hypertrophic cardiomyopathy[J]. Heart, 2016, 102(10):741-747.
doi: 10.1136/heartjnl-2015-308576 URL |
| [1] | LIU Peng, YAN Fuhua, QIN Le, XIAO Ruijie. Study on correlation of cardiac magnetic resonance strain rate parameters of left ventricular diastolic function with risk of sudden death in hypertrophic cardiomyopathy [J]. Journal of Diagnostics Concepts & Practice, 2022, 21(03): 317-325. |
| Viewed | ||||||
|
Full text |
|
|||||
|
Abstract |
|
|||||