
Highlight
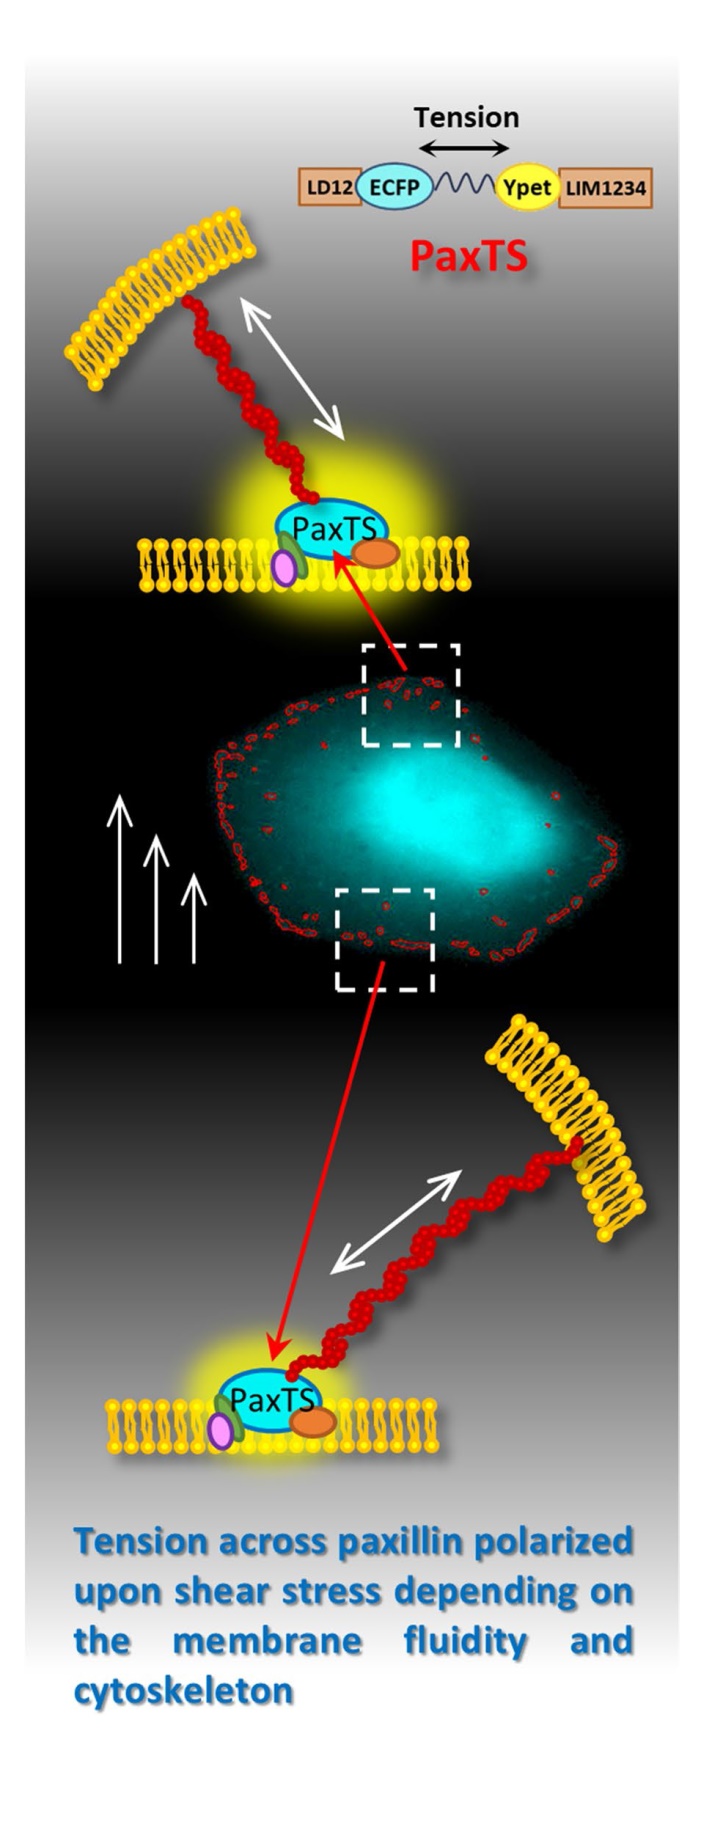
• Tension across paxillin polarized upon shear stress depending on the cytoskeleton and membrane fluidity.
Introduction
Focal adhesions (FAs) experience the tensile force due to they locate on the mechanical interface between the cell and the extracellular matrix (ECM) [1]. Paxillin is a central component of FAs, composed of five leucine-rich LD domains (LD1-LD5), four cystein-histidine-enriched LIM domains, and a proline-rich region anchoring SH3- containing proteins to build connections between the FAs on the plasma membrane and cytoskeleton [2⇓-4]. The structure coupling the plasma membrane to the cytoskeleton allows paxillin to provide docking sites for several FA-associated proteins, which participate in establishing or mediating cell polarity [5,6]. For example, paxillin recruits guanine nucleotide exchange factors (GEFs) and GTPase-activating proteins (GAPs), which are regulators of the polarity establisher Rho GTPases, along with specific effector proteins to FAs [7,8]; phosphorylated paxillin on Tyr serves as a scaffold for the recruitment of Src and focal adhesion kinase (FAK) which distribute polarized upon shear stress [9,10]. In addition, paxillin in FAs displays polarity in its phosphorylation level when exposed to laminar flow [11]. It implies that paxillin is related to cell polarity closely.
Evidence shows that the cell polarity upon shear stress is very rapid, and therefore it is believed to be directly related to stress transfer through the cytoskeleton [12⇓-14]. However, the shear stress mainly applied to the upper surface of the cell, which resulted in the direct cellular responses occurring on the plasma membrane, such as the spatially heterogeneous fluidity [15]. It posed an issue of where the cytoskeleton transmit the mechanically spatial information in the plasma membrane to and enable the polarity-related proteins receive the information. Using PaxTS constructed by ourselves, a tension measuring biosensor based on fluorescence resonance energy transfer (FRET) converting the tension across paxillin to FRET ratio, has proved that paxillin endures tension in a static state and the tension decreases as a reaction to shear stress depending on the plasma membrane fluidity and cytoskeleton [16]. It offers a hypothesis that FAs are the transduce station where polarity-related proteins obtained the mechanically spatial guidance from the cytoskeleton, in which paxillin plays a significant role. However, whether paxillin show mechanical features spatialtemproally still remains unclear.
PaxTS is a DNA-encoded biosensor which detects the tension across paxillin by inserting a tension sensor module between the LD motifs and LIM motifs of paxillin. It allows recording the dynamics of tension across paxillin via time continuous FRET images [16]. Hence, processing these images to obtain the spatial-temporal characteristics of the tension across paxillin becomes a crucial issue. It contains multiple sub-problems, including detecting refined cell boundary, segmenting and tracking FAs between frames of the dynamic images, describing the morphological characteristicsand of FAs, and defining upstream/downstream to identify polarity according to the flow direction. Some previous studies have proposed methods to detect the cell body and identify FAs [17,18]. However, the existing methods fail to handle the issues when the intensity distribution is uneven, or the grayscale is narrow, leading to errors, such as mistaking the background for the cell body and the cytoplasm for the FAs. Meanwhile, there are no proper approaches for the definition of upstream/downstream from the view of image processing, especially for FAs, which is the most fundamental concept in polarity analysis. Generally, it lacks a reliable tool to analyze the dynamic FRET images and obtain polarity information of the tension across paxillin. This study utilized the DNA-encoded FRET biosensor named PaxTS to directly observe the tension across paxillin in living cells upon shear stress, developed an analysis package with Matlab to quantify the spatialtemproal features of tension across paxillin in FAs, and finally explored the mechanism of paxillin performed polarized distribution of tension with the location of FAs upon shear stress. The results indicated that the package visualized the spatiotemporal map of tension across paxillin accurately and associated the morphological characteristics of FAs with the tension. Paxillin displayed polarity distribution along the flow direction when exposed to laminar flow, and the polarity could be abolished by enhancing membrane fluidity and destroying the cytoskeleton. It demonstrated that the mechanical load applied on the upper surface of cells with clear direction could induce the tension polarity occurred basal layer of cells via the plasma membrane and cytoskeleton, implying the paxillin was a potential participant to active the shear stress induced-cell polarity by providing a spatiotemporal tension guide to signaling molecules.
Results
Monitoring and quantifying FA sites map the tension distribution across paxillin
PaxTS was transfected into U-2 OS cells and expressed to visualize the spatiotemporal dynamic behaviors of tension across paxillin upon shear stress in this work. The tension sensor module in PaxTS consisted of a pair of fluorescent proteins which were linked by a nano-sparing and allowed fluorescence resonance energy transfer (FRET). Once the tension sensor module endured stress, the distance between the fluorescent proteins changed due to the strain of nano-spring and further altered the FRET ratio to measure the stress. Thus, with PaxTS, a decreased tension across paxillin manifests as an increase of FRET ratio (Fig. 1A). The fluorescent images were captured simultaneously at each time point from two channels of ECFP and FRET, and analyzed through a multistage images analysis pipeline. Briefly, the images from ECFP channel were chosen to determine the boundary of cells and locate FA sites. After pretreatment, the analysis package detected the cell edge through Otsu's method with an adaptive detection threshold and enhanced images with a high-pass filter. Subsequently, an algorithm utilizing k-means clustering, an unsupervised learning method, further processed the images to identify and segment FA sites. The local averaged FRET ratio indicated the tension across paxillin at each FA site. Tracking FA sites dynamically frame by frame exhibited the dynamic changes of tension (see Materials and methods). Figure 1B showes an example of the segmentation results.

Fig. 1 FAs were identified and classified to observe the relationship between FRET ratio and FA area or orientation relative to the closest edge of the ventral membrane. A The sturcutre of PaxTS. When the tension across paxillin increased, the force stretched the nano-spring to increase the distance between ECFP/Ypet, which decreased the FRET ratio. B The segmentation result of FAs and the partial enlarged images of tracking results. Scale bar: 20 μm. C The scatter diagram of FRET ratio vs. FAs area (n = 12). D The box plot of FRET ratio of ‘pointing' FAs and ‘parallel' FAs (n = 8, p = 0.4985) |
In general, the segmentation algorithm with k-means clustering successfully identified the FAs in each frame regardless of the background fluorescence intensity (Expanded View Fig. 1). The dynamic progress of FAs was tracked before and after shear stress application with all the FA sites identified. The FAs were placed into ‘pointing' and ‘parallel' based on the angle between the long axis of a signle FA and its closest ventral membrane edge, and identified as ‘downstream' and ‘upstream' according to the incident angle between the flow direction and its closest ventral membrane fragment. The detailed definitions of ‘pointing/parallel' and ‘upstream/downstream' can be found in “Materials and methods” section. Figure 1C provides a sketch to display the characterization of FAs as ‘pointing/parallel' and ‘downstream/ upstream', respectively.
The tension across paxillin has no relationship with either area or orientation of FAs
As one of the large scaffold proteins in FAs, the inherent features of FAs could affect the tension across paxillin upon shear stress. An quantitative analysis method can verify whether the tension across paxillin correlates with the characteristics of FAs. Here, the results showed that the tension across paxillin has no correlation with FA area in a static state (r = -0.0548, Fig. 1C). In addition, FAs were divided into ‘pointing' and ‘parallel' two categories according to the angle between the long axis of FA and the closest ventral membrane edge. The FA was classified as ‘pointing' when the angle was 90 ± 45°. Otherwise, the FA was classified as ‘parallel' (Expanded View Fig. 2). The results indicated no differences between ‘pointing' FAs and ‘parallel' FAs, implying that the tension across paxillin had no relationship with the orientation of FAs (p = 0.4985, Fig. 1D).

Fig. 2 Tension across paxillin showed polarity upon shear stress. A The live-cell images (ECFP channel) and corresponding FAs maps indicated the distribution of tension across paxillin. The white arrows showed the direction of shear stress application. Scale bar: 20 μm. B The partial enlargement images of Region U1 (upstream region) and Region D1 (downstream region). C The time series of FRET ratio upon shear stress (n = 7). Red arrow represented shear stress applied at zero time. D The box plot of FRET ratio in upstream regions and downstream regions (p = 0.0019). * represented there was an obvious difference compared to upstream |
There existed polarity of tension across paxillin when exposed to shear stress
Since paxillin is recognized to provide spatial information for the shear stress-induced cell polarity through the tension distribution, it is essential to study the spatiotemporal characteristics of tension across paxillin under shear stress. According to the mechanism of PaxTS, a higher FRET ratio signified a lower tension. FAs were detected and segmented by the analysis package and divided into upstream and downstream based on the incident angle, which mainly considering the shear stress direction and the boundary of the cell body. The tension across paxillin was visualized as the FRET ratio on those FA sites (Fig. 2A, B). In U-2 OS cells, the FRET ratio of both upstream and downstream increased upon 20 dyn/ cm2 of shear stress stimulation for 10 min, which conformed to the previous work (Fig. 2C). The results also suggested that the shear stress-induced tension decrease across paxillin appeared in a polarized manner with a higher tension concentrated at the upstream FA sites (p = 0.0019, Fig. 2D).
The membrane fluidity affected the polarized distribution of tension across paxillin upon shear stress
It has been reported that changing membrane fluidity can affect the shear stress-induced tension decreasing across paxillin and the fluidity itself shows polarity upon shear stress. Thus, whether the fluidity of the plasma membrane plays a role in regulating the polarized tension distribution across paxillin under shear stress application was examined in the next stage of experiments. Cells expressing PaxTS were pretreated with 0.1 mmol/l of Cholesterol (CHO) for 3 h to reduce the membrane fluidity before exposure to shear stress. An interesting phenomenon occurred as the FRET ratio of upstream was higher than downstream. It suggested an inverse polarized distribution across paxillin under shear stress application compared to the control group (Fig. 3A, D), when the fluidity of plasma membrane was decreased (p = 0.0008, Fig. 3B, D, E). However, the pretreatment with 45 mmol/l benzol alcohol (BA) for 15 min to enhance the fluidity of plasma membrane inhibited the difference of FRET ratio between upstream and downstream obviously (p = 0.9853, Fig. 3C-E). These results suggested that the membrane fluidity participated in regulating shear stress-induced tension polarity across paxillin.

Fig. 3 The distribution of tension across paxillin upon shear stress was affected by membrane fluidity. A The live-cell images (ECFP channel) and corresponding FAs maps upon 20 dyn/cm2 of shear stress without drug application. The white arrows showed the direction of shear stress application. Scale bar: 20 μm. Scale bar: 20 μm. B, C The live-cell images (ECFP channel) and corresponding FAs maps under 20 dyn/cm2 of shear stress with 0.1 mmol/L of Cholesterol (CHO) or 45 mmol/L benzol alcohol (BA). The arrows showed the direction of shear stress application. The white arrows showed the direction of shear stress application. Scale bar: 20 μm. D The partial enlargement images of Region U1-U3 (upstream region) and Region D1-D3 (downstream region). E The box plot of FRET ratio in upstream regions and downstream regions of control group, CHO group (n = 6, p = 0.0008) and BA group (n = 5, p = 0.9853). * represented there was an obvious difference compared to upstream |
The integrity of cytoskeleton was essential in maintaining the polarity of tension across paxillin under flow
Cytoskeleton functions as the structure to provide mechanical support to maintain the cell shape and transmitting force directly. Besides, the integrity of the cytoskeleton plays a critical role in mediating the tension across paxillin under laminar flow application. In this work, the pretreatment of nocodazole (NOCO) on 1 μmol/l destroyed the microtubules, and the incubation of Cytochalasin D (CytoD) on 2 μmol/l for 1 h undermined the microfilaments. Both NOCO and CytoD treatment abolished the difference of FRET ratio between upstream and downstream, which demonstrated that the polarized distribution of tension across paxillin upon shear stress was inhibited when any component of cytoskeleton was destroyed (pNOCO=0.8540, pCytoD = 0.6743, Fig. 4A-C, E, F). Similarly, eliminating the contractility of myosin with the inhibitor of myosin light chain kinase (MLCK) ML-7 at 5 μmol/l treating for 1 h resulted in an inhibition of tension polarity across paxillin under stress application (p = 0.0061, Fig. 4A, D-F). All the results proved that the polarity of tension across paxillin upon shear stress depended on the cytoskeletal integrity and intracellular actomyosin contractility.

Fig. 4 The distribution of tension across paxillin upon shear stress was affected by cytoskeleton. A The live-cell images (ECFP channel) and corresponding FAs maps upon 20 dyn/cm2 of shear stress without drug application. The white arrows showed the direction of shear stress application. Scale bar: 20 μm. B-D The live-cell images (ECFP channel) and corresponding FAs maps under 20 dyn/cm2 of shear stress with 5 μmol/l of ML-7, 2 μmol/l of Cytochalasin D (CytoD) and 1 μmol/l of nocodazole (NOCO) respectively. The arrows showed the direction of shear stress application. Scale bar: 20 μm. E The partial enlargement images of Region U1-U4 (upstream region) and Region D1-D4 (downstream region). F The box plot of FRET ratio in upstream regions and downstream regions of control group and ML-7 group (n = 7, p = 0.0061), CytoD group (n = 6, n = 0.6743) and NOCO group (n = 5, n = 0.8540). * represented there was an obvious difference compared to upstream |
Discussion
Mechanical signals being transmitted to the interior of the cell can induce a variety of cell responses, including cell migration. To answer the question of how the force is transduced from extracellular environment to intracellular responses, different mechanisms which involve biochemical signaling and direct force transmission have been proposed [19,20]. It is widely accepted that the transduction depending on biochemical signaling is usually on the time scales of minutes to hours, while the activation of cell polarity is more rapid [13]. Therefore, the most likely scenario of polarity establishment upon extracellular mechanical force is the direct force transmission by cytoskeleton. However, whether other structures or proteins participate in cell polarity establishing based on direct force transmission through cytoskeleton is still unclear.
FAs, one of the best described mechanosensitive modules, contribute to the sense and adaptation of cells to the mechanical properties of surroundings [21]. Among the numerous FA components, paxillin endures tension and colocalizes with tension highly [22]. The tension is affected by shear stress, implying that paxillin is a potential participant in the direct transmission pathway of force in cells. In this work, the FRET-based molecular tension biosensor, PaxTS, measured and mapped spatiotemporally through dynamic FRET images and proposed a software package to excavate the polarity information hidden in the images to offer insight into intracellular processes. It utilized a two-step segmentation combining Otsu's method with a high-pass filter to obtain a refined cell edge when the fluorescence intensity is uneven around the cell profile. The package also proposed a new algorithm based on k-means clustering to identify and track FAs. It avoided omitting a part of FAs or mistaking some cytoplasm pixels as FA caused by the water algorithm, the most popular method in FA identification for now when the grayscale of an image was narrow, and the gray difference the foreground (FAs) and background (the cytoplasm) was little [17,23,24]. After monitoring the tension across paxillin on single FA, the analysis package further quantified the FA characteristics and identified the upstream/downstream according to the incident angle, emphasizing the role of shear stress direction in cell polarity analysis.
Previous studies have demonstrated that FA characteristics affect paxillin in different manners. For example, paxillin is more dynamic at the FAs which are located close to membrane edge than the FAs positioned further inwards, while the orientation of FAs has no significant alteration in paxillin dynamics [25]. In addition to location and orientation, the FAs size and adhesion strength were closely related to the mobility of paxillin [26]. The FAs turnover further mediated the nuclear transport of paxillin [27]. Our results showed that neither FA size nor orientation significantly altered the tension across paxillin. The morphology changes of FAs occurring is a slow process in which the observations usually last from dozens of minutes to hours. The shear stress application for 10 min was too short for these changes to occur. It implied that FA characteristics did not contribute to the tension endured by paxillin, in the early stage of shear stress application. The mechanical properties of paxillin likely depended more on its structure which connected ECM and the cytoskeleton bi-directionally. The extracellular mechanical signal can transfer to FAs rapidly dependent on the direct transmission of intracellular force, in which paxillin participated [16]. Thus, the tension endured by FAs should be the balance between the force generated by cytoskeleton contractility and the force that cells require for adhesion, not simply decided by the traction force. Our results further proved that the shear stress induced-decline of tension across paxillin was asymmetrical in space. The tension across paxillin from those FA sites on the upstream region of the cell along the shear stress direction was higher than the downstream region, showing a polarized tension distribution. The polarity may be related to the pattern of shear stress applied on cells.
Cells are three-dimensional structures that are thicker near the cell nucleus than the periphery. The cortex, a contractile network of both branched and unbranched actin filaments and myosin, underlies the membrane and forms a close connection with membrane [28]. When cells are exposed to laminar flow, the upper surface of the plasma membrane can be divided into two parts. The side directly facing the flow is named as the upstream region, and the opposite side is called the downstream region. The impact of shear stress on upstream and downstream is different, such as the fluidity difference between upstream and downstream regions [15]. A higher fluidity promotes the relative movement between phospholipid molecules and the lipid rafts by which actin filaments were anchored [29,30]. Lipid rafts with different motility stretched the actin filaments unevenly and transit uneven force in space to paxillin, and thus a polarity of tension across paxillin was resulted in.
Since the membrane fluidity possibly plays an important role in the shear stress induced-tension polarity across paxillin, how fluidity affects the polarized distribution was probed by increasing or decreasing fluidity with drug application. Our results showed that the polarity of tension across paxillin was eliminated by increasing membrane fluidity and reversed by decreasing the fluidity. In the case of high fluidity, the lateral movement of phospholipid molecules is increased, contributing to dispersing the force applied on the local plasma membrane to the whole upper membrane and making it more homogenized. Relatively, the motion of lipid rafts was nor fully free, due to being anchored by actin filaments. When the membrane fluidity increased, the motion ability of lipid rafts was saturated in the upstream and downstream regions. Thus, the stretching endured by the cytoskeleton was relatively uniform, eliminating the polarity of tension across paxillin. In the case of low fluidity, the local force dispersing on the upper surface is inefficient and insufficient, owing to the inhibited movement of phospholipid molecules and lipid rafts. However, supplement cholesterol decreased the cell stiffness [31], leading to more significant cell deformation upon shear stress. Although there is no direct evidence, the upstream region facing the flow is likely to experience more significant deformation than the downstream region. The low fluidity was inefficient in dispersing the force caused by more drastic deformation to the nearby membrane, resulting in the stretching of cortex being different between the upstream and downstream region, and finally the polarity of tension across paxillin being reversed in space.
Different components of cytoskeleton are tightly linked and align along the direction of shear stress, which is the most significant mechanosensitive step in intracellular force transmission [32]. As one component of cytoskeleton, actin filaments are anchored to lipid rafts as well as running across the cell and terminating at FAs [33]. The LD domains of paxillin link it to actin filaments by combining with actopaxin and other actin-binding proteins [34,35]. As assumed above, the force that can be transmitted to paxillin by cytoskeleton is the core in the shear stress-induced polarized distribution of tension across paxillin. Undoubtedly, the force can transmit along cytoskeleton [12,36,37], and the connection between paxillin and actin filaments provides a possibility for direct force transmission. To access this, drugs were applied to cells, and our results showed that destroying the structure of the cytoskeleton abolishes the tension difference between upstream and downstream regions. It revealed that cytoskeleton indeed participates in the regulation of tension polarity across paxillin upon shear stress, and the function of microfilaments and microtubules are similar, although paxillin is linked to actin filaments but indirectly to microtubules. Interestingly, our results also indicated that inhibiting the contractility of actomyosin suppressed the tension polarity across paxilin upon shear stress. However, when considering the role of microfilaments, the dynamic of actin filaments should not be ignored. The contractility of actomypsoin acts as buffers to resist the force applied on cells. Inhibiting the myosin decreasing the cell stiffness [38]. Soft cells deform more significantly and asymmetrically between the upstream and downstream regions upon shear stress, applying a larger force on the upstream regions. The actin network without contractility is insufficient to resit the force. Hence, the tension endured by paxillin is different between the upstream and downstream regions, once the contractility of actomyosin was inhibited. In general, these results conform to our assumption that shear stress-induced polarity of tension across paxillin is related to cytoskeleton. Furthermore, both the integrity and the contractility of cytoskeleton play important roles in the process.
Generally, the model of shear stress induced-tension polarity across paxillin upon shear stress can be described as follows: once the shear stress is applied to cells, the force is sensed by the plasma membrane and transmitted to paxillin through the cytoskeleton; the upstream regions of the membrane with a gradually increasing fluidity stretches the cytoskeleton more dramatically; meanwhile, the actin filaments clustered downstream regions and buffer the force with the contractility of actomyosin; finally, the tension across paxillin upon shear stress displays a polarized distribution with a higher tension in upstream regions and lower in downstream. The model proves that the spatial information applied mainly on the upper surface of cells can transmit to the basal layer, manifested as uneven tension distribution across paxillin which locats in FAs via the architecture consisting of plasma membrane and cytoskeleton. Since paxillin provides sites for several signaling molecules related to cell polarity, the polarized tension is likely to direct its status, and further activate these polarity molecules. Whether the tension polarity across paxillin has a relationship to its activation status, such as conformational change or phosphorylation, is an interesting question for future investigations.
Materials and methods
Cell culture and transient transfection
Before transfection, the Roswell Park Memorial Institute (RPMI-1640, Bioind) containing 10% fetal bovine serum (FBS, Bioind) and 100 unit/ml penicillin (Hyclone) was utilized to culture U-2 OS cells. DNA plasmids containing PaxTS sequence were transfected into cells by the transfection reagent, Lipofectamin 3000 (Thermo Fisher Scientific). After transfection lasting for 24 h, cells were passed onto cover slips which were coated with fibronectin and cultured with 0.5% FBS for 12 h before laminar flow application.
Flow systems
The core of the system used to provide laminar flow was a classic parallel-plate flow chamber which was modified to adapt to the dynamic observations under FRET microscope [39]. A silicone gasket was sandwiched between the glass slide seeded with U-2 OS cells expressing PaxTS and a cover glass to form a chamber in which shear stress was applied. The whole system was filled with dulbecco's modified eagle medium (DMEM) containing 0.5% fetal bovine serum (FBS) and set the level of laminar shear stress at 20 dyn/cm2 by adjusting the fluid flow in the chamber [40]. The shear stress can be calculated as Eq. (1):
$\tau=\frac{6 \mu Q}{b h^{2}}$
Here τ = fluid shear stress (Pa), μ = fluid viscosity of solution (cp), Q = flow rate ( cm3/s), b = width (mm), h = height (mm). In this work, μ = 0.82 cp (dulbecco's modified eagle medium (DMEM) containing 0.5% fetal bovine serum (FBS)), b = 13 mm, h = 0.508 mm. The flow experiments were done 37 °C with 5% CO2 to maintain the pH at 7.4.
Microscope image acquisition
The microscope image acquisition set-up consisted of an inverted microscope (Olympus, IX73) and a color camera (Olympus, DP74). A 455DRLP dichroic mirror was used as a switch to alter the excitation light paths for taking fluorescent images of two channels. The excitation for ECFP depended on the dichroic mirror and a 420DF20 filter, while the emission filters for ECFP and Ypet were 480DF30 and 535DF25, respectively. All fluorescence images were collected by software (Cellsens Dimension) with an interval of 1 min for each shoot on a single isolated cell.
Image processing and FAs tracking
The method based on Matlab (Mathwork; Natick) to identify individual FAs and quantify tension across paxillin on FA sites consisted of three main sections, pretreatment, FAs identifying and ratio calculation, FAs tracking and characteristic checking (Fig. 5). In the pretreatment section, the background was removed from each frame. Considering the area ratio between the cell body and background, the algorithm regarded the pixel of which the frequency of occurrence in a frame was highest as the background of the frame. Cell edges were detected by analyzing the images from ECFP channels using a segmentation algorithm which was based on Otsu's method with an adaptive detection threshold and improved with k-means clustering. Briefly, the cell body was segmented with a global threshold which was renewed automatically to adapt to the intensity changing of images. However, the even width along the cell profile caused the fluorescence at local edges vague, which resulted in the real edge cloud not be recognized by the threshold. K-means clustering combined with a low-pass filter was applied to further detect vague local edges in the initial result. Subsequently, in the section for identifying FAs, the original images with background removing were enhanced by Gaussian smoothing. FA sites were detected in each image with the builtin order of k-means clustering based on those enhanced images. The clustering was interms of Euclidean distance. The clustering number was usually setted as 5. Actually, the clustering number affected the results a little when it was larger than 4 (Expanded View Fig. 3). The algorithm setted the minuxim FA size was 40 pixles to exclude pontenital interference caused by the nuclear. With the final segmentation results, the tension across paxillin was calculated as an averaged FRET ratio of Ypet/ECFP at FA sites. The orientation of FAs was described by classifying FAs into ‘pointing' and ‘parallel'. When the angle between the long axis of a FA and its closest ventral membrane edge was 90° ± 45°, the FA was classified as ‘pointing' which is perpendicular to the edge. When the angle was 180° ± 45°, the FA was classified as ‘parallel' which is parallel to the edge [25].

Fig. 5 The process of FAs quantified analysis |
After the identification of FAs, another algorithm was designed to track FAs through each sequential image. The observation time was too short for dramatic cell deformation, and only slight displacement would occurred. The slight displacement could be corrected with the centroid. After position correction, the pixels contained in the corrected cell body were placed into clusters according to the intensity-time series on the pixels by k-means clustering. The intensity and characteristic of intensity changing with time were similar within FA sites and differed from the background, which was contributed to the FAs identification based on the whole time series and formed a primary FA template. Each isolated FA site in the primary template was voted across the observation time to avoid the probable joining or separating effects on the time scale. If an isolated FA site were identified as several disjoint components in most frames and connected for a few frames, the site would be considered as several FAs and replaced. The time voting generated the final FA template. The FAs in one frame and the final FA template were matched to each other according to measuring the position by Euclidean distance. If there were two or more FAs from the template matched to one FA in a frame, all these template FAs would be marked as the final match, and vice versa.
A FA site was determined as an upstream or a downstream FA, depending on whether the projection of this FA onto its closest ventral membrane edge belonged to the upstream membrane. The upstream membrane was defined as the part of the boundary which faced the flow directly. To determine whether a fragment of the plasma membrane was upstream or downstream, the boundary of the cell was evenly divided into zones. The length of a zone was set as 10 pixels in this work. The unit exterior normal which corresponded to a zone, was decomposed into two components. The component along the flow direction was regarded as the incident angle of this zone. In an ideal case, the cell boundary can be divided into two consecutive and non-overlapping parts based on the symbol of the incident angles. According to the flow direction, the upstream membrane was composed of the zones with a negative incident angle, while the symbol of the downstream membrane was positive. Considering the fact that the cell edge was discrete in images, which probably resulted in sudden changes of the symbol in only one zone or several consecutive zones, the symbol of each zone was adjusted based on the two adjacent zones until the whole cell boundary was divided into two consecutive and non-overlapping parts. When the point on the cell boundary, which was closest to the centroid of a FA belonged to the upstream membrane, the FA was considered as an upstream FA. Otherwise, it was marked as downstream.
Statistical analysis
The FRET ratio on each FA site was measured and recorded in chronological order. All FRET ratio (YPet / ECFP) data were normalized by their basal level at zero point, which was the first time point of shear stress application in the same cell. To each sample, the FRET ratio on those FA sites in upstream or downstream regions of the cell was averaged to represent the upstream or the downstream, respectively. Statistical analysis used to evaluate the statistical differences between upstream and downstream was the Two-tailed paired-samples t-test function contained in the Excel software (Microsoft). A significant difference was determined when the p-value was smaller than 0.05, and the correlation was considered uncorrelated when the absolute value of the correlation coefficient was smaller than 0.3. All means involved in the work were modified by standard deviation.
Supplementary Information The online version contains supplementary material available at https://doi.org/10.1007/s44258-024-00017-3.
Acknowledgements This work was supported by National Natural Science Foundation of China (Grant No. 32071252).
Code availability The code developed in this work has been uploaded as Supplementary materials.
Authors' contributions Sha Deng and Bo Liu proposed the idea and evoluted the overarching research goals and aims; Na Li, Hangyu Zhang and Bo Liu designed the methodology; Sha Deng performed the experiments; Shuai Shao analyzed the data and wrote the draft with Bo Liu and Zhengyao Zhang.
Availability of data and materials The datasets generated during and/or analysed during the current study are available from the corresponding author on reasonable request.
Declarations
Competing interests The authors declare they have no financial interests. S. Shao is grateful to Prof. Timo Tiihonen and Tapani Ristaniemi from University of Jyvaskyla for their great supports to the study.
Open Access This article is licensed under a Creative Commons Attribution 4.0 International License, which permits use, sharing, adaptation, distribution and reproduction in any medium or format, as long as you give appropriate credit to the original author(s) and the source, provide a link to the Creative Commons licence, and indicate if changes were made. The images or other third party material in this article are included in the article's Creative Commons licence, unless indicated otherwise in a credit line to the material. If material is not included in the article's Creative Commons licence and your intended use is not permitted by statutory regulation or exceeds the permitted use, you will need to obtain permission directly from the copyright holder. To view a copy of this licence, visit http://creativecommons.org/licenses/by/4.0/.
Publisher's Note Springer Nature remains neutral with regard to jurisdictional claims in published maps and institutional affiliations.
