
Highlight
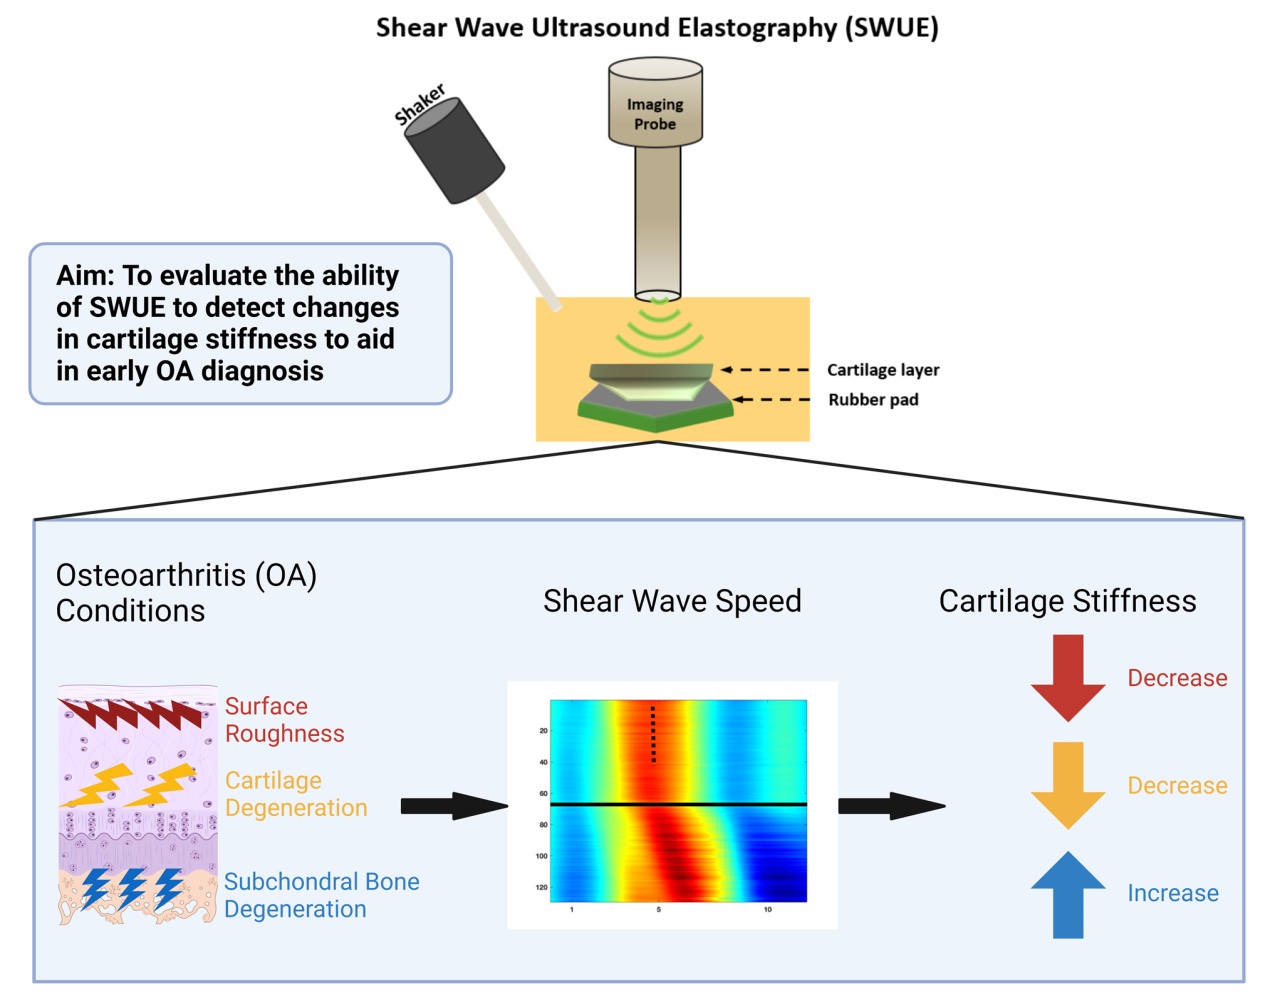
• Shear wave ultrasound elastography noninvasively measure the elastic properties of soft tissue.
• Increasing cartilage surface roughness and enzyme degradation results in slower shear wave speeds.
• Subchondral bone degradation increases shear wave speed in cartilage.
• Shear wave ultrasound elastography is a novel method for early osteoarthritis diagnosis.
Introduction
Osteoarthritis (OA) is a chronic degenerative joint disorderthat is the leading cause of disability in the elderly population,affecting over 27 million Americans [1]. Primarysymptoms of OA include joint pain, stiffness, and locomotorrestriction. In addition, radiographic features such asosteophytes and joint space narrowing indicate cartilage loss, but these features do not always correlate with painor functional impairment [2,3]. Radiography also has poorsoft tissue contrast, making early cartilage damage diagnosischallenging. Alternatively, magnetic resonance imaging(MRI) provides excellent soft tissue contrast and high spatialresolution, but the sensitivity is less than that of clinical andradiographic techniques in diagnosing OA [4]. Computedtomography is a more accurate modality to detect cortical bony features, and is valuable in cases where MRI is contraindicated,but the risk of ionizing radiation exposure limitsits use in OA diagnosis [5]. The visible morphologicalchanges in OA diagnosis occur late in disease progression,making treatment strategies ineffective in reversing cartilagedegeneration. Therefore, there is a clear need for earlydetection of cartilage degeneration to enhance treatmentstrategies.
In the early stages of OA, bone remodeling and subchondralbone loss are elevated. This is the initial step inabnormal mechanical loading by altering the joint shapeand transmission [6]. The increased turnover leads to thinningand higher porosity of the subchondral bone platethat initiates progressive cartilage compositional changes[7], such as loss of proteoglycan content [8], loss of collagencontent and organization [9], and changes in tissuehydration [10]. These deviations in subchondral bone andcartilage composition alter the mechanical properties ofthe tissue and mechanical function, which may contributeto further degeneration [11,12]. Since these mechanicalchanges occur prior to the radiographic features, detectionof these changes may prove to be a novel method inearly OA diagnosis.
Shear Wave Ultrasound Elastography (SWUE) is anoninvasive imaging technique designed to assess the biomechanicalproperties of soft tissues. In order to providevaluable information about tissue stiffness, the techniqueemploys a high frame rate (typically exceeding 500 frames/second) to capture the propagation of shear waves along thetissue [13,14]. The research of this technique began in thelate 1990s, and since then, the technique has been appliedacross various medical disciplines such as cardiac [13], Eye[15,16], thrombus [17⇓-19], Brain [20], Skin [21], and lung[22] tissues.
Recently, limited research has investigated the use ofSWUE to study the mechanical properties of cartilage.In this context, our study builds upon existing efforts toadvance the understanding of ultrasound elastography'srole in detecting the mechanical properties of cartilage.Ginat et al. investigated the potential of high-resolutionultrasound elastography for assessing the mechanicalproperties of bovine articular cartilage. The study revealednear-zero strains within samples, except at specific locationslike the articular surface and the interface betweenzones 1 and 2 during instantaneous static compression[23]. Despite successfully demonstrating strain imagingduring compression, the study acknowledges challengesrelated to complex boundary conditions. Chung et al.used ultrasound elastography to assess depth-dependentmechanical properties in tissue-engineered cartilage. Thestudy demonstrated the feasibility of validating elastography-predicted strains against finite-element analysis.They found that internal regions of engineered cartilage exhibited significantly higher local strain than the surface,highlighting the potential of ultrasound elastography forevaluating the mechanical properties of engineered cartilage[24]. Lee et al. developed a high-frequency ultrasoundelastography system with a motorized rotation stage toaddress challenges in assessing the mechanical property,ex-vivo, in anisotropic, high-stiffness tissues such as cartilageand swine heart [25]. The presented results showedthe system's capability to accurately evaluate the mechanicalproperties of high-stiffness tissues.
Most of these studies utilized SWUE based on bothgroup and phase velocity methods to extract valuableinformation regarding the elasticity of cartilage. Othergroups have developed the Lamb Wave model (LWM),which utilizes guided waves through thin layers to extractthe viscoelastic properties of the materials. Xu et al.investigated the LWM to assess the viscoelastic propertiesof ex-vivo bovine tibial plateau cartilage. This workestablished a suitable measurement range and loading frequencythrough theoretical and numerical analyses. Thestudy validated the effectiveness of LWM in measuringcartilage viscoelasticity, marking a crucial step toward theultimate goal of in vivo applications [26]. In addition, Xuet al. established a shear wave propagation model usingthe LWM to study the cartilage-bone structure. The studyhighlights the capability to distinguish between bone andcartilage regions through wave speed measurements andoffers a theoretical basis for utilizing shear wave methodsto measure cartilage elasticity in vivo, potentially advancingthe diagnosis of OA [27].
The primary objective of this study was to furtherassess the ability of SWUE to detect changes in cartilagestiffness using enzymatic or mechanical surface degenerationmethods, while also investigating the impact ofsubchondral bone abnormalities on cartilage stiffness, exvivo,as well as confirming changes in cartilage structureusing scanning electron microscopy (SEM). To achievethis goal, the study initially focused on assessing the system'sability to accurately detect shear wave speed (SWS)variations in thin layers, using phantoms with differentthicknesses. Subsequently, the system was applied to conductcartilage measurements, providing valuable insightsfor advancing early OA.
Methods and materials
Cartilage sample preparation
Bovine femurs were purchased from a local marketapproved by the United States Department of Agriculture,eliminating the need for Institutional Animal Care and UseCommittee (IACUC) approval. Medial and lateral femoralcondyles were exposed, and visually healthy osteochondralunits were cut into approximately 8 x 8mm sections.Excess debris was removed by washing in double distilledwater, and the osteochondral units were stored at -20 °Cuntil testing.
Simulated osteoarthritis conditions
Degeneration of the articular cartilage was achieved byutilizing the chemical action of the trypsin enzyme.Trypsin has been shown to digest proteoglycans with aslight effect on the collagen network, which can mimiccartilage degeneration in OA [28]. Osteochondral unitswere immersed into a 0.05% trypsin-ethylenediaminetretra-acetic acid solution (Gibco, Grand Island, NY) at37°C for either 24, 48, or 72 hours (n=3/group). Controlsamples were immersed in Dulbecco's Modified EagleMedium (Gibco, Grand Island, NY) for the same timeperiods. After trypsin incubation, samples were washedthree times with phosphate buffered saline before testing.Previous studies have shown that cartilage surfaceroughness increases as the Osteoarthritis Research SocietyInternational (OARSI) grade increases [29]. To simulatethis effect, cartilage surfaces were exposed to varyingdegrees of sandpaper grit, in which grits 320, 220, and 150corresponded to OARSI grades 1, 2, and 3, respectively.The cartilage surface was passed over a 25 cm2sandpapersquare (3M, St. Paul, MN) from medial to lateral andposterior to anterior directions 5 times to generate surfacedefects (n=4/group). Representative optical images of cartilagesamples following surface roughness treatment areshown in Fig. 1 (Stemi SV 11 Apo, Carl Zeiss Inc., JennaGermany). To test the effect of increasing subchondral bone porosity on cartilage, 0.2 ml of formic acid (FA),at concentrations of 1%, 3%, or 7% (Sigma Aldrich, St.Louis, MO) was injected into the subchondral bone using a25g needle (n=3/group). The morphology of the cartilagesurfaces was imaged with SEM (LEO1550, LEO, Germany)at 2.5 kV acceleration voltage and 4-7 mm workingdistance. Prior to imaging, the cartilage was carefullyremoved from subchondral bone, fixed in 4% paraformaldehydefor 24 hours, dehydrated by serial increasing ethanolconcentrations, and dried in a desiccator. All cartilagesamples were then sputter-coated with gold to improvesurface conductivity.

Fig. 1 Representative opticalmicroscopy cartilage imagesfollowing various surfaceroughness defects: (a) control,(b) 320 grit, (c) 220 grit, (d)150 grit. Scale Bar: 1 mm |
Ultrasound: system setup and data processing
To evaluate tissue elasticity using shear wave ultrasound elastography,three main steps are involved: (1) Tissue deformation,(2) Image acquisition: capturing the tissue's deformation,and (3) Image reconstruction and analysis: correlate deformationto elasticity. Figure 2 shows a schematic diagram of theexperimental setup, which is similar to [16,17] except for thetest sample and system parameters.
Tissue deformation
A mechanical shaker (#4810, Bruel & Kjaer, Duluth, Georgia,USA) connected to a metal rod (tip dimensions: 1.5 x1 mm2)that gently touched the surface of the sample wasused to induce tissue deformation. The shaker was derivedby a single pulse of 2 kHz sine wave, 500 mV through afunction generator (AFG 3252C, Tektronix Inc., Beaverton,OR, USA) and amplified by a power amplifier (#2718, Bruel& Kjaer Co., Duluth, Georgia, USA).

Fig. 2 Schematic diagram of shear wave elastography ex-vivo setup |
Image acquisition
A programmable ultrasound research system (Vantage 256,Verasonics, Redmond, WA, USA) with an 18 MHz centerfrequency, 128 elements array probe (L22-14v, Verasonics,Redmond, WA, USA), placed laterally above the sample wasused to detect the lateral shear waves propagation. Given thehigh stiffness nature of cartilage tissue, which could potentiallyresult in high SWS ( Cs> 20 m/s ), a high frame rateshould be considered [30]. Therefore, a frame rate of 10kHz with three compounded angles was implemented in thisstudy. The in-phase/quadrature (IQ) dataset, comprising 250frames (equivalent to 25 ms of data acquisition), was collectedand saved for offline post-processing. The probe wassecurely mounted on a five-axis stage to enable precise handling.Both the mechanical shaker and scanning probe weretriggered by the ultrasound system and synchronized by thefunction generator. System parameters were maintained thesame for both phantom and cartilage studies to eliminate bias.
Image reconstruction
B-mode images were utilized as a guide prior to the elastographyexperiment to accurately identify the location of thecartilage within the phantom and investigate its structuralattributes, including thickness (Fig. 3h). The IQ data (totalof 25 ms) obtained through B-mode images were processedthrough MATLAB (2021a, The MathWorks, Natick, MA,USA). As lateral shear waves propagate through successivedata points (displacement of each imaging pixel), examiningthe similarity of these data points can provide informationabout the wave's behavior, including its speed. Hence, 1-Dautocorrelation (Kasai algorithm) was implemented to calculatethe dynamic displacement at each imaging pixel,providing insight into tissue displacement. Next, 2-D spatiotemporalmaps were generated with lateral distance (representingthe axial displacement) over time, with differentcolors indicating variations in displacement magnitude.The SWS based on group velocity method was estimated byapplying linear regression to the lateral positions on the axialdisplacement map and their corresponding times (definedas the time to reach the peak displacement at each dynamicdisplacement) [21]. A bandpass filter was implemented toeliminate noise. The data processing and SWS estimationwere rooted in prior research conducted by our group, exceptfor the system parameters and some procedures due to cartilagebehavior and geometry. This previous work involved theestimation of tissue elasticity in various tissues, includingthrombus [17], posterior eye [31], optic nerve, sclera [15],and ciliary body [32]. Prior to the experiment, the sampleswere immersed in saline solution and allowed to equilibrateat room temperature for at least 30 minutes. To mitigate thetemperature-related impact on the gelatin phantom, all theexperiments were done at room temperature.

Fig. 3 Shear wave speed (SWS) is consistent across various phantom thicknesses. (a-c) B-mode images and (e-g) spatiotemporal maps of differentthickness phantoms. (a, e) 2mm, (b, f) 7mm, and (c, g) 12 mm. The slope of the dotted line in (e-g) represents the estimated SWS. (d) RepresentativeB-mode image of cartilage embedded in phantom. (h) Estimated SWS (mean ± SD) of 2, 7, and 12 mm thick phantoms were 2 ± 0.1m/s (n=3) |
During the experiment, the tip of the rod (connected withthe shaker) was touching the phantom a few millimetersaway from the cartilage location. In some cases, we variedthe shaker-probe distance to account for size and surfacevariations in cartilage, ensuring optimal lateral alignmentacross all samples. The imaging probe was precisely positionedabove the cartilage. Following validation throughphantom study, it is important to note the distance betweenthe excitation and imaging probe may impact the propagationtime of shear waves but had no significant effecton SWS measurement. In addition, our system setup is toassess the stiffness through shear waves that propagate laterally(along the probe). Positioning the shaker laterallyalong the imaging probe ensures the detection of the lateralpropagation of shear waves along the sample. In addition,the lateral alignment maintains the integrity of shear wavesover long distance [17,21]. Therefore, the tip of the shakerwas placed almost perpendicular to the imaging subjectand along the imaging probe. Each sample's measurementswere conducted three times; and the average value wascalculated.
Phantom with different thickness
To validate the system parameters, tissue-mimicking gelatinphantoms with various thicknesses and the same stiffnesswere fabricated following the established protocol used byour group [15,31]. In this work, homogeneous phantomswere fabricated using equal concentration of Gelatin (GelatinG8-500, Fisher Scientific, USA) and silicon carbide powder(S5631, Sigma-Aldrich, St. Louis, MO, USA), resultingin phantoms with 2, 7, and 12 mm thickness (Fig. 3(a-c)).The primary objective of this part of the study was to ensurea consistent SWS across different phantom thicknesses(Fig. 3(h)).
Cartilage-embedded in phantom
Cartilage, being a layered, thin, and boundary-affected tissue,presents complexities that can affect the accuracy ofelastography-based measurement. Boundary effects, suchas reflections at the interface of cartilage and surroundingtissues, can distort the wave propagation behavior, leadingto potentially inaccurate SWS estimation. Furthermore,low-thickness layers can make it difficult to distinguish truemechanical properties from those of adjacent tissues, andcould lead to guided wave behavior [33]. Considering thesechallenges, this study adopts an innovative approach byembedding the cartilage into a gelatin phantom (Fig. 3(d)).This approach mitigates some of the challenges associatedwith cartilage samples, such as boundary and thin layereffects. Additionally, it aids in advancing this technologytoward clinical practice, as the phantom effectively mimicsthe surrounding cartilage structure.
The cartilage samples, with their trapezoidal shape anduneven subchondral base, presented challenges for secureplacement on a plate. To address this, the samples wereplaced in a container with a rubber pad attached to thebase to minimize acoustic reflections. Additionally, thebase of each sample was filled with epoxy to ensure stabilityduring the experiment. After the epoxy had cured,the container was filled with gelatin phantom to encasethe cartilage sample. Subsequently, the container was transferred to 4°C for three hours. By embedding cartilagewithin the phantom, shear waves can propagate on a largersurface, thus reducing the impact of reflections. Additionally,positioning the shaker directly on the phantom andmeasuring the SWS at the cartilage location allows enoughtime for the waves to propagate and, thus, a more controlledand accurate assessment of cartilage mechanics.
Relating SWS with elasticity
Elastography-based technique is commonly quantified byestimating the group velocity and its association with theelastic modulus. With the cartilage-embedded phantommethod, we opted to work with a bulk medium. Despitecartilage having distinct layers that may exhibit differentmechanical properties, for the purposes of this study,we assumed uniform stiffness across all cartilage layers.Consequently, the average group velocity was calculatedacross the entire depth of the sample. The relation betweenelastic modulus and the SWS is given by [34]:
$C_{s}=\sqrt{\frac{\mu}{\rho}}$
Where Csis the shear wave speed, μ is the elastic modulus,ρ is the tissue density. Based on this relation, higherSWS will indicate a stiffer sample, while lower SWS indicatesa softer sample. Viscosity was ignored in this study,and only elastic property was considered.
Statistical analysis
All results were analyzed based on at least three independentexperiments and expressed using standard deviation. Trypsindegradation results were analyzed by two-way ANOVA withŠidak's multiple comparisons test. Surface roughness andformic acid results were analyzed by one-way analysis ofvariance (ANOVA) with the Tukey post hoc test. P valueless than 0.05 was considered to be a significant difference(GraphPad Prism version 9.3.0, San Diego, CA).
Results
In this work, we hypothesized that SWUE can detectchanges in cartilage mechanical properties using simulatedOA conditions. To test this hypothesis, and after validatingthe system capabilities of estimating SWS through phantomstudy, we first tested how enzymatic degradation of articularcartilage affects the SWS propagation along the cartilagelayer. We then investigated the impact of surface defects ofvarying degrees on the SWS and whether differences can be detected. Finally, the effect of subchondral bone defects oncartilage surface SWS propagation was investigated.
Phantom thickness calibration
To ensure consistency in the estimated SWS across sampleswith varying thicknesses, phantoms with 2, 7, and 12 mmthicknesses were generated (Fig. 3(a-c)). The spatiotemporalmaps showed similar slopes across each phantom thicknesstested (Fig. 3(e-g)), and further quantification resulted in aconsistent SWS of 2 ± 0.1 m/s for all phantoms (Fig. 3(h)).These results indicate the system's ability to estimate SWSaccurately across different thickness layers.
Cartilage morphology
To confirm the alterations to the cartilage surface morphologyusing the simulated OA conditions, SEM imaging wasconducted. After 24 hours of incubation in trypsin, the proteoglycansstarted to break down and small holes startedforming in the extracellular matrix (ECM) compared to thecontrol (Fig. 4(a, b)). The degradation started to continueafter 48 and 72 hours of trypsin digestion (Fig. 4(d,f), wherethe control did not have any obvious alterations comparedto 24 hours (Fig. 4(c,e). Surface roughness defect initiationusing decreasing grits of sandpaper created pronounceddefects in the cartilage surface with 150 grit inducing thegreatest destruction (Fig. 5(d)). Compared to the control,320 grit and 220 grit resulted in increased surface roughness,but were not significantly different from each other(Fig. 5(a-c)). After injection of increasing concentrations ofFA into the subchondral bone, the cartilage surface becameless porous and smoother than the control, with 7% FA havingthe greatest effect (Fig. 6(d)). Therefore, the simulatedOA conditions used were able to initiate changes in the cartilagesurface for detection using SWUE.

Fig. 4 Representative SEMimages of cartilage surfacesfollowing 24 hr, 48 hr, and 72hr of control (a, c, e) or trypsintreatment (b, d, f). Scale bar:500 nm |

Fig. 5 Representative SEMimages of cartilage surfacesof (a) control, (b) 320 grit, (c)220 grit, (d) 150 grit treatedsamples. Scale bar: 10 μm |

Fig. 6 Representative SEMimages of cartilage surfaces of(a) control, (b) 1% formic acid,(c) 3% formic acid, and (d) 7%formic acid injections. Scalebar: 3 μm |
Cartilage degradation reduces SWS
To demonstrate if enzymatic cartilage degradation canaffect SWS propagation, bovine osteochondral units wereimmersed in a trypsin-EDTA solution for 24, 48, and 72hours, and the SWS was estimated using SWUE-based groupvelocity method. The spatiotemporal maps, with the verticalblack dotted line, represent the estimated SWS that propagatesalong the lateral direction of the articular cartilage(Fig. 7). The control samples had consistent slopes in thespatiotemporal maps after 24, 48, and 72, hrs (Fig. 7(a-c)),while the samples with trypsin treatment slightly decreasedthe slopes, seen in the spatiotemporal maps at each timepoint (Fig. 7(d-f)). Further quantification of the estimatedSWS showed that trypsin significantly reduced the SWScompared to the control at 24, 48, and 72 hrs (p<0.05,p<0.01, and p<0.001, respectively) (Fig. 8(a)). In addition,there was a slight decrease in SWS from 24 to 48 hours oftrypsin treatment (-8.7%) and further decreased from 48 to72 hours (-18.3%), but the difference was not significant.Since higher SWS indicates stiffer cartilage, trypsin treatmentreduced the SWS, indicating SWUE was able to detectthe cartilage degradation.

Fig. 7 Spatiotemporal maps of control (a-c) and trypsin treated (d-f) with different treatment durations: (a, d) 24 hrs, (b, e) 48 hrs, and (c, f) 72hrs. The solid line delimits the boundary between the cartilage (above the line) and the phantom (below the line). The slope of the dotted line inrepresents the estimated SWS |

Fig. 8 Changes in cartilage SWS detected using SWUE after (a) trypsin degradation, (b) surface roughness defect, and (c) FA injection in subchondralbone. (*p<0.05, **p<0.01, ***p<0.001, ****p<0.0001) |
Cartilage surface defect reduces SWS
Articular cartilage was mechanically degraded usingvarying degrees of sandpaper roughness to induce surfacedefects, and the SWS was estimated. The SWS significantlydecreased after exposure to 150 grit compared tocontrol, 320 grit, and 220 grit (p<0.001, p<0.01, p<0.05,respectively) (Fig. 8(b)). However, there was no significantdifference in the control SWS compared to 320 grit and 220grit (Fig. 8(b)), which is in agreement with the degree of surfaceabnormalities shown in Fig. 1 (a-c). These results suggestthat SWUE can detect severe cartilage surface defects.
Subchondral bone degradation increases SWS
Subchondral bone degradation was initiated by adding differentconcentrations of FA (1, 5, and 7%), and SWS of thearticular cartilage was measured to investigate the effect ofsubchondral bone on the cartilage elastic property. The SWSsignificantly increased after 7% FA injection by 62%, 89%,and 53% compared to control, 1% FA, and 3% FA, respectively(p<0.0001) (Fig. 8(c)). Furthermore, 3% FA injectionresulted in a significantly greater SWS compared to 1% FA(p<0.05), but this increase was not significantly differentfrom the control (Fig. 8(c)). The increase in SWS shows anincrease in cartilage stiffness as increasing concentrations ofFA are injected into the subchondral bone.
Discussion
In this work, we demonstrate that SWUE has the ability todetect differences in cartilage mechanical properties undersimulated OA conditions. As shown in Fig. 8(a), our resultsindicate that the SWS on cartilage decreases after trypsintreatment, which continues over a 72-hour period. Thedecrease in SWS is related to a decrease in cartilage stiffness,which is consistent with previous studies where mechanicalindentation showed 4 hours of trypsin treatment reduced cartilagestiffness [28]. Proteoglycans are essential in articularcartilage to provide osmotic pressure by binding to water,which assists in resisting compressive loads [35]. Trypsinis known to digest proteoglycans and have a slight effecton the collagen network in cartilage, but does not affect thecartilage thickness significantly [36⇓-38]. The SEM imagesshow increased degradation in the cartilage ECM after 24hours of trypsin treatment and progressed at 48 and 72 hours,which is demonstrated by the increased in amount of spacebetween fibers (Fig. 4). In addition, cartilage stiffness hasbeen shown to decrease after proteoglycan digestion [39].Therefore, the reduction in SWS from trypsin treatment isdue to a decrease in cartilage stiffness.
During the progression of OA, the proteoglycan and collagennetwork degrade and reduce the mechanical strengthof articular cartilage. Furthermore, tissue mineralization ofthe cartilage occurs in end-stage OA and could act as stressconcentrations to initiate cracks in the cartilage [40,41]. Infact, previous work has shown that the surface roughness ofintact articular cartilage in OA further increases in responseto mechanical loading compared to healthy cartilage due tothe presence of mineral deposits in the superficial region[42]. To simulate this effect, we mechanically degraded thesurface of articular cartilage using varying degrees of sandpaperroughness. Visually, use of the 150 grit sandpaperresulted in the greatest surface defects compared to control,320-, and 220-grit, while the use of 320- and 220-grit hadminimal surface defects (Fig. 5). As a result, the SWS significantlydecreased from 150 grit compared to 320, 220grit, and control. At the same time, there were no significantdifferences between 320, 220 grit, and control (Fig. 8(b)).The decrease in SWS indicates a reduction in cartilage stiffness,which is in accordance with previous work demonstratingthat increasing the grade of OA is highly correlated todecreasing cartilage elastic and shear storage modulus [43,44]. It is important to note that the mechanical degradationled to a minor reduction in signal-to-noise ratio (SNR),which could underestimate the SWS along the entire sample.In this work, the SWS measurement was only acquired atregions with reasonable SNR.
Subchondral bone remodeling plays an important rolein OA progression, which is suggested to occur prior tothe degradation of articular cartilage. In the femoral head,it showed that subchondral bone collagen had a 20-foldincrease in turnover and a 25% decrease in mineralization,which results in narrower and weaker fibers that weakenthe mechanical properties of subchondral bone [45]. Inaddition, the subchondral bone plate modulus and hardnesshave been shown to progressively decrease in an OArat model [46]. FA, a well-known decalcifying agent, wasused to simulate the decrease in mineralization occurringin subchondral bone during OA progression. Since thisremodeling process occurs before cartilage degradation,we tested how this decrease in subchondral bone mineralizationaffected cartilage stiffness. Figure 8(c) shows that7% FA injection significantly increased the SWS comparedto the control, 1%, and 3% FA. Interestingly, 3% formicacid significantly increased the SWS compared to 1%, butneither was significantly different from the control. TheSEM images of the cartilage surfaces showed that the cartilagesurface became less porous as the concentration ofFA increased compared to the control, which may explainthe increase in SWS (Fig. 6). Previous results have shownthat there was a significant negative correlation betweencartilage shear storage modulus and subchondral bone elasticmodulus in OA [43], which is in agreement with theseresults. In addition, SWS was increased in the medial andintercondylar cartilage in patients with knee osteoarthritisin a preliminary clinical study [47]. Therefore, the increasein SWS may be an early predictor in OA, but requires furtherclinical evaluation.
Using ultrasound elastography, we were able to detectchanges in cartilage mechanical properties under simulatedOA conditions. However, only significant differences werefound when cartilage was damaged to greater extents using150 grit and 7% FA injections. For optimal system performanceand stability, it was recommended to use a maximumof 10 kHz pulse repetition frequency. However, to accuratelydetect small changes in such hard tissue, a better sensitivitymight be considered in the future to enhance the system'sperformance. In the data acquisition, a total of 25 ms of IQdata was gathered. However, due to the rapid shear wavepropagation resulting in a swift measurement process, onlythe initial 10 ms of the acquired data was utilized and processed.In addition, as the shaker was consistently positionedat the phantom, variation of the maximum displacementoccurrence time was observed in the spatiotemporal maps(Fig. 4) across different samples. This inconsistency maybe attributed to the shaker's distance variation relative toimaging probe during each test. Although the SWS measurementmay not significantly be affected by these variation(as discussed in method section), future enhancement in theexperimental setup is recommended to enhance the uniformityand reliability of SWS measurements across all samples.
By embedding the cartilage within the phantom, wesuccessfully mitigated the boundary effect and utilized thegroup velocity method for SWS estimation. This strategicapproach not only addresses boundary conditions but alsosmooths the way for future advancements in transitioningfrom ex-vivo to in-vivo studies. Specifically, this innovativesetup serves as a surrogate, mimicking the tissueenvironment between the cartilage and surrounding structures.It represents a notable development of the existingex-vivo studies, marking a significant step toward clinicalimplementation.
The utilization of group velocity, while beneficial forSWS estimation, imposes limitations on our capacity to differentiatemechanical properties across distinct tissue layers.Previous research has demonstrated variations in mechanicalproperties among different cartilage layers, especially in thepresence of OA [48]. Considering this, future investigationsmay benefit from extracting multiple frequency informationto potentially enhance the accuracy of SWS estimation.
In this study, we proved that SWUE is a novel approachto detecting changes in the mechanical properties of cartilageafter enzymatic degradation, surface roughness defect,and subchondral bone degeneration. Cartilage degradationand increased surface roughness decreased the SWS, whileincreased subchondral bone degeneration increased theSWS, which indicated changes in cartilage stiffness. Theresults demonstrated a promising noninvasive and nonionizingtechnique to aid in early OA diagnosis.
Acknowledgments The authors would like to acknowledge CarmenShum for helping with the preparation of cartilage samples for SWUEanalysis. The authors would also like to thank Dr. Hsiao Chuan Liu forhis technical support in ultrasound elastography system. The authorswould like to extend their gratitude to Dr. James Quinn with his assistancein SEM imaging. A. Rayes is supported by King Abdulaziz Universitypostgraduate scholarship. Graphical abstract was created usingBiorender.com.
Authors' contributions Conceptualization: YX Qin and Q Zhou;Methodology: E Georgas, A Rayes, and YX Qin; Formal analysisand investigation: E Georgas, A Rayes, and J Zhang; Writing-originaldraft preparation: E Georgas and A Rayes; Writing-review and editing:YX Qin and Q Zhou; Funding Acquisition: YX Qin and Q Zhou;Resources: YX Qin and Q Zhou; Supervision: YX Qin and Q Zhou.
Funding This work was partially supported by the NIH REACH program,and the National Space Biomedical Research Institute throughNASA Cooperative Agreement NCC 9-58, and NASA.
Availability of data and materials The data presented in this study areavailable on request from the corresponding author.
Declarations
Ethics approval and consent to participate This study does not requireethics approval since samples from post-mortem animals were used.
Consent for publication All authors have read and agreed to the published version of the manuscript.
Competing interests The authors declare no conflict of interest.
Open Access This article is licensed under a Creative Commons Attribution4.0 International License, which permits use, sharing, adaptation,distribution and reproduction in any medium or format, as longas you give appropriate credit to the original author(s) and the source,provide a link to the Creative Commons licence, and indicate if changeswere made. The images or other third party material in this article areincluded in the article's Creative Commons licence, unless indicatedotherwise in a credit line to the material. If material is not included inthe article's Creative Commons licence and your intended use is notpermitted by statutory regulation or exceeds the permitted use, you willneed to obtain permission directly from the copyright holder. To view acopy of this licence, visit http://creativecommons.org/licenses/by/4.0/.
Publisher's Note Springer Nature remains neutral with regard to jurisdictional claims in published maps and institutional affiliations.
