
Highlight
• Up-to-date overview of the regulation of brain ECS in health and disease.
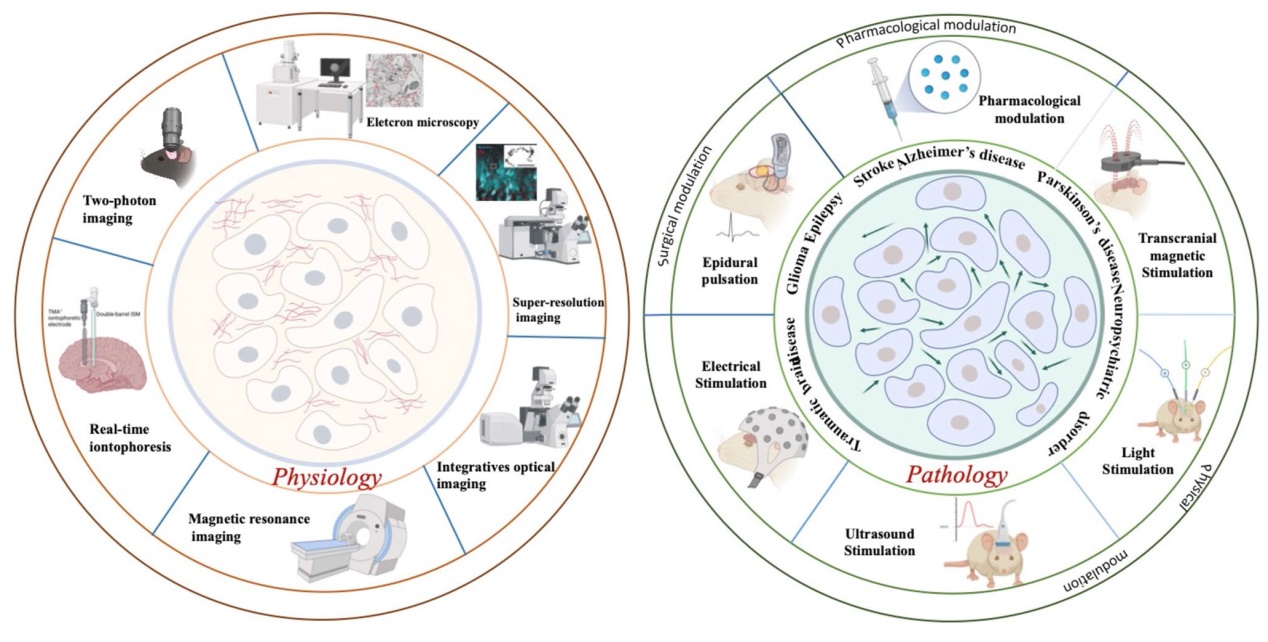
• Recent advances in detecting the biophysical properties, function, and dynamic changes of brain ECS are reviewed.
• Advanced pharmacological and physical methods to manipulate brain ECS, which provides therapeutic potentials for treating neurological disorders.
Introduction
Remarkable progress has been made in the past century in understanding the nervous system, especially for the characterization of neural connectome and brain atlas [1]. However, the narrow space between the brain cells has received much less attention, traditionally regarded as gap filler that glued the cells together. Recent studies have revealed that the brain extracellular space (ECS) is a complex dynamic compartment that occupies approximately one-fifth of brain volume, filled with interstitial fluid (ISF), extracellular matrix (ECM), and other secreted molecules, actively involved in the regulation of molecule transportation, cell communications, and signal integration [2⇓-4]. It is therefore important to investigate the structures, functions, and regulation of brain ECS in both normal and pathological conditions, which would facilitate our understanding of the brain homeostasis and disorders.
The brain ECS resembles a comparatively vast reticulum yet has nano- to micrometer dimensions of tunnels and reservoirs [5]. Diffusion measurements were used to estimate the volume fraction (⍺ = ECS volume/total brain volume, normally 0.2-0.25) and the tortuosity (λ, normally 1.5-1.6), which indicates the hindrance imposed by brain ECS to molecular diffusion. These diffusion properties vary around each cell and in different brain regions. They also change depending on the stimulation or pathophysiological states [6,7]. Emerging multi-modal approaches have updated our view of the spatial organization and geometry of brain ECS from the fluid-filled “pore” with approximately 40 nm in width into a highly heterogenous and dynamic ECS with widths ranging from 20 nm at neuron synapses to well above 1 μm [8⇓-10]. At small scale, interaction of neurons and glia cannot be achieved without the involvement of the diffusion of transmitters and ions in the synaptic cleft via the nearby ECS. Neuroactive substances diffuse through the ECS and bind to extra-synaptic sites for volume transmission [11,12]. At large scale, the extensive communications between ISF in brain ECS and cerebrospinal fluid (CSF) are important for the long-distance molecule transport, waste removal and homeostasis of brain microenvironment [13,14]. The dysregulation of ECS due to abnormal changes of ECM components or obstruction of ISF solutes transportation, has been closely associated with pathogenesis and progression of many neurological diseases, including Alzheimer's disease, Parkinson's disease, stroke, epilepsy and glioma [15⇓-17]. Therefore, manipulation of ECS based on its physiological properties and function has great potential for the intervention of neurological disorders.
The aim of this review is to present an up-to-date overview of the regulation of brain ECS in health and disease, as well as the available techniques for detecting and experimentally manipulating ECS, highlighting their therapeutic potential for treating neurological disorders. In Section “Regulation of ECS in healthy brain”, the relationships between neuronal activity, glial volume, and brain ECS dynamics are discussed. Section “Dysregulation of ECS in neurological disorders” presents the evidence of brain ECS dysregulation in neurological diseases. In Section “Advanced methods for detecting changes in brain ECS”, the recent improvements for detecting the spatial organization and function of brain ECS are addressed. Section "Modulation of brain ECS for the intervention of neurological disorders" highlights the promising methods to modulate brain ECS for the intervention of central nervous system (CNS) diseases. Finally, the potential of using brain ECS knowledge in aging, bloodbrain barrier (BBB) integrity, extracellular vesicle trafficking, drug delivery and space exploration are addressed.
Regulation of ECS in healthy brain
Brain ECS and neuronal activity
The brain ECS is a reservoir for ions and neurotransmitters that are important for maintaining neural signaling transduction. Local fluctuation of ions and changes of neurotransmitter concentration affect the membrane potential, neuronal activity, and extracellular space volume. Components in ECM dynamically regulate synaptic plasticity, contributing to brain cognitive function in daily life (Fig. 1A).

Fig. 1 Brain ECS regulation and dysfunction in healthy and pathological conditions. A The regulation of ECS in healthy brain. i) AQP4 are located at the endfeet of astrocytes, together with ion channels, co-transporters and neurotransmitter receptors to regulate local volume diffusion. ii) The components of extracellular matrix interact with cells in the brain to regulate synaptic plasticity and ECS tortuosity. iii) Schematic representation of CSF influx, interstitial system, and ISF flow. B The dysregulation of ECS in pathological brain. i) Astrocytes swelling is associated with AQP4 depolarization and impairment of glutamate and K+ buffering, leading to the decrease of volume fraction of ECS and increase of excitotoxicity. ii) The expression of extracellular matrix components also changes to increase the tortuosity of ECS, leading to the suppression of molecule diffusion and aggregation of pathological proteins. iii) The impaired CSF-ISF exchange in interstitial system promotes the aggregation and deposition of pathological proteins and progression of neurological disorders |
Fluctuation of neurotransmitters and ions in brain ECS
The migration of many molecules like ions and neurotransmitters through the ECS is governed by volume transmission, a form of synapse-independent intercellular communication [18]. Diffusion analysis of ECS by measuring volume fraction and tortuosity has revealed the heterogeneity and variability in different brain regions and physiological conditions [7]. Based on the physical properties of the ECS, mathematical modeling indicates that changes of interstitial ions correlate with neuronal activity and brain state [19⇓-21]. Indeed, changes in extracellular potassium, calcium, magnesium, and proton concentration could control the sleep-wake cycle in rodents [22,23]. Cortex-wide extracellular potassium fluctuation has been shown to parallel brain state transitions in awake behaving mice [24]. Studies from TMA+ real-time iontophoresis and MRI showed that neuronal excitation and activity could promote shrinkage of ECS and reduction of ISF flow [25⇓-27]. Recently, single particle tracking paired with super-localization microscopy also revealed that modulation of neuronal activity is accompanied by nanoscale changes of ECS around synapses [28], which could in turn affect synaptic and brain activity by influencing the diffusion of ions and neurotransmitters. Synchronized ionic waves promoted CSF-to-ISF perfusion, while chemogenetic flattening of these rhythmic ionic waves impeded the CSF influx and clearance in the brain [29]. These studies indicate a bidirectional relationship between ECS and neuronal activity in the brain.
The concentration of neurotransmitters and neuromodulators varies in different compartments of the brain ECS, regulated by glial uptake, local diffusion and perineuronal net. While small molecules such as glutamate, GABA, dopamine and ATP could convey information in neuronglia network via extra-synaptic transmission [30⇓⇓⇓-34], larger molecules like neuropeptides slowly diffuse in brain ECS without the specialized uptake transporters, which are important for prolonged action and feedback control of brain circuit connectivity [35]. Thus, the differential diffusion rates and action time of neurotransmitters and neuromodulators in ECS offer a dynamic spatiotemporal map to conduct neurotransmission and regulate brain function.
Synaptic remodeling by ECM components
ECM molecules are synthesized by neurons, glia, and nonneural cells and are secreted into the brain ECS. Many studies have shown that ECM has an indispensable role in neurodevelopment and synaptic homeostasis [36⇓-38]. Specifically, net-like ECM acts as lateral diffusion barriers for AMPA receptors, modulating short-term synaptic plasticity [39]. Moreover, ECM components such as reelin, integrin and other glycoproteins interact with postsynaptic receptors to either promote phosphorylation and activation of NMDA receptors or amplify calcium channel activity [40⇓⇓-43]. Interestingly, depletion of hyaluronan, a major constituent of the ECM, induced reduction in the size of ECS, leading to hyperexcitability and epileptiform activity in the mice [44]. Enzymatic attenuation of neural ECM also increased the excitability and synaptic inputs into fast-spiking neurons [45]. These studies highlighted the ECM-mediated induction, stabilization, and remodeling of synaptic connectivity.
The abundant ECM interacting proteins not only modulate synaptic plasticity directly, but also control the diffusion properties of ECS and ISF flow, indirectly affecting neural network activity. For example, diverse range of proteoglycans and extracellular enzymes in ECM are responsible for proteolytic processes. Misfolded proteins in the ISF and CSF can either bind to cell surface directly or form soluble complexes with extracellular chaperons before binding to receptors, while large insoluble protein aggregates can activate extracellular proteolytic systems in the ECS [46]. Studies have shown that heparan sulfate proteoglycans (HSPGs) mediate internalization and propagation of fibrillar protein aggregates [47], while matrix metalloproteinases and dis-integrin metalloproteinases are involved in sequential degradation and clearance of extracellular neuropathic fibrils [48,49]. These extracellular proteases regulate ECM remodeling to alter viscoelasticity, affecting local diffusion and tortuosity of ECS [5]. Interestingly, nano-tracking combined with superresolution imaging revealed that protein aggregates like ⍺-synuclein could change ECS diffusivity through ECM remodeling [50]. Taken together, these results demonstrate the interplay of ECM, protein aggregation and ECS in maintaining brain health.
Brain ECS and glial cell volume dynamics
Cell volume change in the brain is restricted due to limitations imposed by the rigid skull. Yet brain cells experience constant fluctuations of their volume due to ionic and osmolyte fluxes resulting from neuronal activity, neurotransmitter cycling, and dynamic changes in metabolic state [51]. While neurons may contribute to swelling of brain tissue in pathological situations including acute hypo-osmolar stress and brain trauma [52,53], glial cells have been implicated to regulate cell volume in response to neuronal stimulation within physiological range, maintaining brain excitability, fluid flow and molecule transportation in ECS (Fig. 1A).
Astrocytic swelling and molecular machinery
Among brain cells, astrocytes are mostly studied in the context of cell swelling and shrinkage. Neuronal stimulation leads to elevation of extracellular K+, which is swiftly removed from ECS by astrocytes. Previously, inward rectifying K+ channel Kir4.1 expressed on astrocytes was believed to be responsible for astrocyte swelling in ECS with high K+ [54]. However, by utilizing various selective inhibitors in combination with real-time confocal volume imaging, it was discovered that the regulation of astrocyte-selective volume increase in elevated extracellular K+ condition is primarily mediated by Na+/ K+ ATPase, rather than Kir4.1, sodium bicarbonate cotransporter NBCe1, or Na+- K+-Cl− cotransporter NKCC1. Notably, this regulation occurs independently of the water channel aquaporin 4 (AQP4) [55]. Additionally, application of TGN-020, the AQP4 selective inhibitor, failed to diminish stimulus-induced ECS shrinkage in rat hippocampal slice [56]. These results decoupled AQP4 with activity-evoked astrocytic swelling and ECS shrinkage [57]. Nevertheless, co-immunoprecipitation and fluorescence resonance energy transfer (FRET) studies showed that Na+/ K+ ATPase catalytic domain interacts with the water channel AQP4 to form a transporting microdomain in astrocytes for the regulation of water and K+ homeostasis [58]. AQP4 could also co-assemble with sulfonylurea receptor 1 - transient receptor potential melastatin 4 (SUR1-TRPM4) monovalent cation channel to form a hetero-multimeric water/ion channel complex to drive astrocyte swelling [59]. These studies suggest that AQP4 might contribute to the astrocyte swelling associated with activityevoked K+ increase. Despite of controversial results related to AQP4 and different ion transporters, the molecular machinery regulating astrocyte swelling and ECS volume is unlikely to be dependent on AQP4 alone, but involves multi-pathways of water entry into astrocytes in response to different stimulus and K+ concentrations in ECS [60,61].
Astrocytic swelling is often parallel with ECS shrinkage that affects the transportation between CSF and ISF. It is important to note that the involvement of AQP4 in astrocyte volume regulation and associated changes of ECS or ISF flow varies in different brain regions. For example, TMA-iontophoresis showed that the AQP4-deficient mice had increased ECS volume without tortuosity change in somatosensory cortex [62]. Tracer-based magnetic resonance imaging (MRI) revealed that AQP4-knockout rats had decreased ISF flow in thalamus, but increased volume fraction of ECS, decreased tortuosity, and unchanged ISF flow in caudate nucleus [63]. The discrepancy identified in previous studies in terms of astrocyte volume regulation maybe partially due to different investigated brain regions, animal models, and measurement techniques.
Interstitial fluid flow during sleep
Waste removal is essential for maintaining brain homeostasis. The glymphatic system has been proposed to serve as the brain waste drainage machinery that includes CSF transportation from subarachnoid space to brain parenchyma, where it mixes with the ISF mediated by AQP4 on astrocytic endfeet and ultimately exits through venous perivascular space [64,65] (Fig. 1A(iii)). The exchange and drainage of CSF-ISF in brain ECS are crucial for the glymphatic clearance. Recently, the brain-wide waste clearance pathway has been further observed in both animal models and humans by MRI [66,67]. TMA-diffusion assessment and two-photon imaging of in vivo mice demonstrated significant increase in the interstitial space, convective exchange of CSF with ISF, and Aβ clearance rate during natural sleep or ketamine/xylazine-induced anesthesia [68]. Moreover, the CSF influx positively correlates with the slow wave activity found in sleep and certain types of anesthesia [69], while slow wave sleep disruption or sleep deprivation promotes Aβ accumulation in CSF and brain regions [70⇓-72]. These studies emphasized that CSF-ISF flow is an important gateway for clearance of protein aggregates and waste products in sleep [73]. Interestingly, the dynamic changes of astrocytic processes and gene expression also correlate with sleep-wake cycle [74]. Reduced astrocytic coverage of synapses and highest perivascular polarization of AQP4 were found during the sleep [74,75], indicating that astrocytes might be the link between waste clearance and circadian rhythmicity. Further investigations are needed to determine whether astrocytic volume changes could directly alter waste clearance in interstitial system.
Changes of ECS in developing brain
The volume and composition of the brain ECS vary during development. Microscopic and diffusion analysis showed a relatively large extracellular volume fraction during early postnatal development, which was diminished with age [76,77]. The large ECS volume fraction of the neonatal brain could potentially dilute ions, metabolites and neurotransmitters released from cells, preventing anoxia, seizure and spreading depression in young animals [77]. The reduction in ECS, is associated with progressive maturation-related decrease in water content, changes of intracranial viscoelastic properties, and decrease of nanoparticle diffusive ability [78,79]. Notably, the significant ECS shrinkage are roughly correlated in time with the proliferation and maturation of glial cells [80]. And the homeostatic control of ECS dynamics in response to elevated K+ becomes tighter with development, allowing efficient synaptic transmission in the mature brain [23]. Moreover, the heterogeneity of the ECM in developing brain offers unique niche for cell proliferation, neuronal migration, and cortex expansion. For example, the spatiotemporal distribution of certain chondroitin sulfate proteoglycans (CSPGs), reelin and fibronectin in ECS during early development helps defining the destination and pathway for migrating neurons and axonal extension [81⇓-83]. In contrast, the perineuronal net, a specialized ECM structure is expressed later when the nervous system is in the final stages of maturation and the critical periods are closing, leading to decreased plasticity and increased synaptic stability [84,85]. Since ECM components could regulate intercellular communication by affecting diffusion of signaling molecules, the maturation of ECM plays important role in the conversion of juvenile into adult plasticity and brain functional compartmentalization [86,87]. Interestingly, the membrane accumulation and position of AQP4 is regulated by the dystrophin-dystroglycan complex, which links ECM to cell surface and intracellular proteins [88], indicating that changes of ECM components might affect the polarization of AQP4 during development. Astrocytic AQP4 polarization is also regulated by the signaling molecule platelet-derived growth factor B (PDGF-B), crucial for the development and maturation of glymphatic system [89,90]. However, the connection between postnatal development of glymphatic system and ECM maturation is unclear. Further investigation of the changes of ECS in developing brain could shed new light on the mechanisms of neuropsychological disorders that generally develop after the developmental critical periods.
Dysregulation of ECS in neurological disorders
Alzheimer's disease
Alzheimer's disease (AD) is a neurodegenerative disease that is characterized by progressive cognitive impairment and abnormal behavior in the elderly. Accumulation of aberrant proteins such as amyloid-β and tau due to impaired clearance mechanisms in the brain represents the pathological hallmark in AD. As a brain metabolites clearance pathway, glymphatic system is involved and affects Aβ aggregation and tau propagation [91]. It has been reported that perivascular space volume fraction and extracellular free water accumulation are higher, whereas diffusivity of the perivenous space is lower in AD patients, reflecting the impairment of the CSF influx [92]. Reduction of perivascular localization of AQP4 found in AD mouse models and AD patients is associated with impaired CSF-ISF exchange, increasing Aβ burden and cognitive decline [93,94] (Fig. 1B). Supression of CSF-ISF drainage pathway by ligation of deep cervical lymph nodes exacerbared AD-like pathology [95], suggesting that blocked CSF-ISF flow is one of the derteriorating factors in the progression of AD. AQP4 genetic variant was associated with poor sleep quality, affecting Aβ burden [96]. Although it's unclear whether the loss of AQP4 polarization is a consequence or a cause of Aβ accumulation, these findings imply a feed-forward pathway where the amyloid aggregation is amplified by AQP4-related glymphatic dysfunction [97]. It is worth to note that altered ECS diffusion parameters and compromised astrocyte volume regulation have been identified in the hippocampus of AD mouse model, with disease progression-related expression of astrocytic genes responsible for ion and water movement [98]. Additionally, AQP4 deletion in AD mice exaggerated intraneuronal accumulation of Aβ and apolipoprotein E (ApoE), while elimination of microglia resulted in deposition of Aβ plaque in the absence of AQP4 [99]. These studies indicate that microglia, astrocytes, and glymphatic system synergistically regulate amyloid aggregation in AD. In addition to brain waste clearance in ECS, components of ECM also play important and diverse roles in production, formation, and degradation of Aβ plaques [100]. For example, increased hyaluronan as associated with deposits of amyloid and tau in brain parenchyma in AD patients, promoted the formation of Aβ secondary structure by high molecular-weight form [101]. Sheddases of the metalloprotease family present in ECS have been reported to cleave microglial TREM2, secreting its ectodomain into the ECS to facilitate amyloid plaque phagocytosis and clearance [102].
Unlike Aβ pathology, the relationship between tau aggregation and ECS dysfunction in AD is less investigated. While tau is predominately cytoplasmic, it can be released into the brain ECS, allowing for its neuron-to-neuron propagation. Mouse ISF tau and human CSF tau increased during sleep deprivation, indicating that disrupted sleep identified in AD may contribute to tau pathology spreading [72]. Recently, a small subset of aggregated and/or phosphorylated tau present in the ISF of tauopathy mice was found to drive ISF seeding competency and tauopathy progression [103]. Pharmacological inhibition of AQP4 suppressed CSF-ISF exchange and tau clearance in the tauopathy mice [104], suggesting that glymphatic pathway also has the potential to exacerbate pathogenic accumulation of tau in AD. Moreover, it has been found that increased perivascular AQP4 promoted drainage of injected peptides but failed to accelerate drainage of abnormal tau in neurons. Unlike the situation in Aβ pathology, it is the AQP4 located at the neuron-facing membrane domains of astrocytes but not the perivascular endfeet that mainly brings abnormal tau away from neurons [105]. Further studies are required to determine whether ECS dysfunction mediated by astrocytes and glymphatic system differentially or collectively contribute to Aβ and tau aggregation in the progression of AD (Fig. 1B).
Parkinson's disease
Parkinson's disease (PD) is a neurodegenerative disease, characterized by progressive loss of dopamine neurons in the substantia nigra and the presence of Lewy bodies or Lewy neurites formed by ⍺-Synuclein (⍺-syn) aggregation. In addition to motor symptoms, most PD patients experience some form of sleep dysfunction [106]. Since glymphatic clearance of brain waste positively correlates with sleep quality [107], PD patients also have impaired glymphatic drainage [108]. Blocking lymphatic drainage by ligating the deep cervical lymph nodes reduced interstitial clearance of ⍺-syn, promoting PDlile pathology [109]. Multiple MRI studies and diffusion tensor image analysis along the perivascular space (DTI-ALPS) have revealed that low perivascular diffusivity and enlarged perivascular spaces corelate with the severity and progression of PD [110⇓⇓⇓-114]. Recently, it has been shown that ⍺-syn induced local enlargement of brain ECS by promoting the degradation of hyaluronan matrix in PD animal model [50]. Active matrix metalloproteinases-9 in PD mice promoted the AQP4 depolarization, structural instability of astrocyte endfeet, and glymphatic system dysfunction [115]. Moreover, decreasing or depletion of AQP4 expression impaired the glymphatic clearance and accelerated pathological ⍺-syn accumulation, which could further suppress AQP4 polarization and glymphatic influx [116,117]. This feed-forward loop of glymphatic dysfunction and ⍺-syn aggregation contributes to progression of PD.
Neuropsychiatric disorders
Changes of brain ECS properties and components have been found in neuropsychiatric disorders, such as schizophrenia, bipolar disorders, and depression. For example, increase of extracellular volume in both white and grey matter was detected in patients at early stage of schizophrenia [118,119]. Multi-site diffusion MRI studies revealed that extracellular free water was negatively associated with the duration of illness in schizophrenia [120]. Similar increase of white matter extracellular free water was found in bipolar disorder patients [121], suggesting that the increased diffusivity in brain ECS could be a transient indication of early psychotic episodes [122,123]. Interestingly, polymorphisms in human AQP4 were found to be associated with schizophrenia [124]. Abnormalities of astrocytes and AQP4 were also identified in bipolar disorders and animal models of depression [125], indicating that glymphatic impairment might contribute to the development of psychiatric disorders. Moreover, emerging evidence points to the involvement of ECM in the pathophysiology of neuropsychiatric disorders. For example, decreases of perineuronal nets and altered expression of ECM molecules like reelin, CSPGs, fibronectin, and tenascins are important for the pathology of psychiatric diseases via dysregulation of synaptic transmission and neuronal homeostasis [126⇓-128]. Thus, ECM-dependent change of ECS function could bear direct relevance to neuropsychiatric disorders, which presents potential pharmacological targets for the development of new therapeutic approaches.
Stroke
Stroke is the leading cause of adult disability and death, including ischemic stroke, subarachnoid hemorrhage (SAH), and cerebral hemorrhage, all accompanied by cerebral edema. At early stage, it is usually believed that cytotoxic edema occurs within minutes after ischemic insult and is triggered by significant osmotic imbalances without the change of total brain volume [129]. Cessation of blood supply quickly deprived the ATP and normal ion transportation, leading to the elevation of intracellular Na+ and accumulation of K+ in brain ECS aggravated by astrocytic K+ efflux [130]. Astrocytes rapidly swell under this osmotic stress [131], which compress the ECS, impeding the resolution of edema. Furthermore, ion imbalance-induced spreading depolarizations after focal ischemia could trigger rapid CSF entry into the ischemic brain and increase in perivascular CSF flow as revealed by MRI and multiphoton imaging recently [132]. At later stage, net water increases in the brain and vasogenic edema caused by the disruption of blood-brain-barrier (BBB) become dominant. Studies have reported persistent malfunction of glymphatic drainage, impaired AQP4 polarization, and accumulated toxic molecules in different rodent stroke models [133⇓-135]. Importantly, DTI-ALPS studies also showed significant decrease of diffusivity along the perivascular space (ALPS index) at the lesion side of the brain, indicating the glymphatic dysfunction in patients with stroke [136,137]. Taken together, these results suggest that regulation of ECS and glymphatic system could be the therapeutic target for stroke diagnosis and treatment [138].
Traumatic brain injury
Traumatic brain injury (TBI) results from external forces that hinder normal brain function, where the development of secondary cerebral edema and injury cascades becomes the leading cause for patient's morbidity and mortality [139]. Diffusion MRI studies have provided evidence for both decreased and increased diffusivity in brain ECS, which could be explained by the differences in injury severity and stages of cytotoxic and vasogenic edema [140]. Patients with TBI showed lower DTI-ALPS index than healthy controls, suggesting glymphatic dysfunction in TBI [141⇓⇓-144]. The heterogenous changes of influx and efflux of glymphatic pathway after mild TBI were found in different brain regions [145]. Genetic deletion of AQP4 promoted neurofibrillary pathology in post-traumatic brain [146]. These studies highlighted the importance of fluid management in brain ECS and glymphatic function in pathophysiology and treatment of TBI [147,148]. Indeed, potentiating glymphatic drainage by inhibition of adrenergic signaling or application of nano-plumber containing microenvironment regulator and vascular growth factor improved neurological function after TBI [149,150]. In addition to impaired fluid exchange in ECS, increased expression of developmentally restricted ECM components such as laminin, tenascins, and certain proteoglycans was found in murine models after TBI, indicating a regenerative response associated with repair processes [151,152]. An in-depth understanding of brain ECS dysfunction in TBI may facilitate the discovery of new ways to reduce post-traumatic cerebral oedema and improve functional recovery.
Epilepsy
Epilepsy is a common neurological disorder characterized by recurrent and unpredictable seizures. Approximately 30% of the epilepsy cases are refractory to current antiepileptic drugs, most of which target neuronal excitability and synaptic neurotransmission directly [153]. Notably, emerging evidence suggests that alterations in brain ECS contribute to the initiation and prolongation of seizures through non-synaptic mechanism [154]. Realtime iontophoresis and recent super-resolution shadow imaging showed significant ECS volume shrinkage during pilocarpine-induced status epilepticus and picrotoxininduced seizures, respectively [10,155]. In addition to the persistent ECS shrinkage during epileptic seizures, the rapid volume pulsation of brain ECS was recently identified in multiple mouse models of epileptiform activity, which depends on the activity of electrogenic Na+/ HCO3 − cotransporter (NBCe1) [156]. As a major factor in regulating ECS volume, astrocyte swelling following extracellular potassium uptake and buffering promotes rapid ECS shrinkage, which can concentrate ions and glutamate, enhance ephaptic interactions/field effects between neurons, and likely increase the formation of gap junctions to promote pathological neuronal firing and synchrony in epilepsy [157,158]. In fact, treatments like furosemide and bumetanide that modulate the size of ECS may block epileptiform activity through blockade of astrocytic Na+/ K+/Cl− cotransporter (NKCCl) [159]. Additionally, mice with depletion or enzymatic digestion of ECM hyaluronan had reduced ECS and increased seizures [44,160]. These studies indicate a positive feedback loop between reduced ECS and epileptic activity. The shrinkage of ECS is often associated with glymphatic system dysfunction. Indeed, patients with focal epilepsy and status epilepticus showed lower DTI-ALPS index compared to healthy controls, suggesting the glymphatic dysfunction in epilepsy [161,162]. Overall, these evidence in animals and humans highlighted the important roles and potential target of ECS modulation in the prevention of epileptogenesis.
Glioma
Glioma is one of the most common tumors in the CNS and has high malignancy and poor prognosis. The expansion and infiltration of glioma could alter the properties of the surrounding ECS, which in turn affect the migration and progression of tumors [163]. TMA+ iontophoresis confirmed that the volume fraction of ECS in many gliomas was significantly increased, positively correlated with the proliferation and malignancy of the tumors [163,164]. However, enlarged ECS volume is not paired with high diffusion rate. In fact, the diffusion of molecules in high-grade gliomas is reduced due to increased production of ECM components, including hyaluronic acids, fibronectin, and tenascins that promote the adhesion and migration of glioma cells [165]. These changes of ECM lead to increased tortuosity of ECS, limiting the diffusion of ions and small molecules [166]. Importantly, studies using dynamic contrast-enhanced and tracer-based MRI revealed that ISF flow was heterogenous and decreased in regions adjacent to the glioma [167,168]. In vivo and ex vivo imaging showed that the para-arterial influx of subarachnoid CSF was limited in glioma-bearing rats, especially in those tumor area with reduced perivascular AQP4 level, suggesting the impairment of CSF drainage in glioma [169]. Consistently, MRI studies in glioma patients revealed that gliomas at higher grade were associated with a lower ALPS index [170], while increased survival was associated with increased ISF convective flow velocity [171], suggesting a correlation between glymphatic dysfunction and glioma aggressiveness. Thus, targeting ECS and glymphatic changes by suppressing certain ECM overproduction and improving ISF flow could be beneficial for intervention of brain tumors.
Multiple sclerosis
Multiple sclerosis (MS) is a chronic autoimmune disorder characterized by inflammation, demyelination, and neurodegeneration. BBB leakage, together with substantial immune responses and demyelination within lesions, could cause disruption of ECS microenvironment in MS [172]. MS patients showed decreased intracellular sodium volume fraction as revealed by MRI study, indicating the expansion of ECS [173]. Growing evidence points to the involvement of glymphatic dysfunction in MS. Reduction of CSF circulation was found in MS patients [174,175]. Disorganized expression of AQP4 away from the astrocyte endfeet was also identified in MS models and postmortem brains [176,177]. PVS enlargement and reduced ALPS index are associated with the progression of MS [178⇓-180]. These studies suggest that glymphatic system plays important role in MS. Whether there is casual link between glymphatic perturbation and the pathogenesis of MS is not yet clear. Furthermore, immunohistochemical and transcriptomic studies demonstrated widespread alterations in ECM compositions in MS lesions, promoting the activation of glial cells and neuroinflammation [181,182]. Reactive myeloid cells in the brain secrete extracellular vesicles (EVs) into the ECS, mediating the cascades of immune responses and disease progression in MS [183]. These EVs not only present biomarkers for the diagnosis of MS, but also could be artificially generated for drug delivery in ECS [184,185]. Systematic understanding of ECS dysregulation in MS and other autoimmune diseases, including the interactions between glymphatic dysfunction, ECM alterations and EVs trafficking, could hold the key to effective treatment.
In summary, abnormal alterations of brain ECS are associated with many neurological disorders as verified in both animal models and clinical studies. Pathological protein aggregation and edema due to glymphatic dysfunction, excitotoxicity promoted by impaired astrocytic regulation, as well as changes of ECM components, all interact with each other and play important roles in the initiation and progression of brain diseases (Fig. 1B). The drainage of cerebrospinal fluid and ISF dynamics are closely associated with the clearance of brain waste, especially in neurodegenerative diseases where abnormal accumulation of metabolic waste is almost universally observed [186,187]. Factors that contribute to the regulation of ECS properties and ISF flow, such as astrocytic volume regulation, AQP4 polarization and expression of ECM components, could become potential therapeutic targets for neurodegenerative disease, stroke, epilepsy, and brain tumors.
Advanced methods for detecting changes in brain ECS
Due to the small dimensions of the ECS (predominantly ~40 nm) [3] and the changes in ECS volume and metabolic clearance during sleep-wake cycle [68], it is challenging to reveal the spatial organization and dynamics of the brain ECS on multiple timescales. In order to investigate the structures, diffusion properties, and function of brain ECS, several techniques have been developed, including electron and optical imaging, electrochemical method, and magnetic resonance imaging (MRI). The available experimental techniques to detect the brain ECS have been nicely compared and summarized previously [188]. Here, we focus on the recent improvement of established methods to unravel the dynamics and roles of the brain ECS.
Electron microscopy (EM)
EM has been used to reveal the structure of the ECS with nanoscale resolution. The application of EM for detection of changes in brain ECS was limited by the requirement for tissue fixation and incompatibility with live tissue. High pressure freezing with substitution fixation at low temperature allows the distribution of water in CNS to be maintained, which could reduce artifacts from structural fixation [189,190]. Recent improvement of perfusion fixation method allows preserving brain ECS for high-quality optical and ultrastructural electron microscopy [191] (Fig. 2A-B). The most common EM methods for biological samples include scanning electron microscopy (SEM) that enables the visualization of topographic features, and transmission electron microscopy (TEM) providing internal ultrastructural data. Nevertheless, the architectures of brain ECS could not be revealed without 3D imaging. The development of focused ion beam scanning electron microscopy (FIB/SEM) offered rapid and reliable acquisitions of large series of images with high Z-resolution [192]. Cryo-EM was used to study the nanoscale organization of pathological brain ECS in adult neurodegenerative mice [50]. Recent study using in situ cryo-sectioning, FIB-SEM and semiautomatic annotations revealed that the ECS volume fraction in the brain was 6.21% with 94.8% of the total ECS volume occupied by a large connected ECS network in rat hippocampal tissue [193] (Fig. 2C-D). Additionally, anisotropic and heterogenous character of the brain white matter has been demonstrated by simulation of the ISF flow between the axons of white matter areas reconstructed through FIB-SEM recordings, which is important for modeling the mechanisms of interstitial transport and drug-delivery [194]. These improvements of 3D EM imaging techniques, as well as the algorithms for annotation, segmentation, and diffusion simulation, promote further exploration of the precise structure and geometry of brain ECS.

Fig. 2 Recent advances in investigating ECS structure by electron and optical imaging methods. A Example of brain electron microscopy (EM) image using conventional 2-step perfusion. B Example of brain EM image using 4-step perfusion, which had larger brain ECS compared to the conventional method. Graphic image taken from Lu et al. [191]. C Example of brain ECS annotation labeled in red from EM imaging. D ECS image after processing. The blue portion represents the connected ECS area accounting for approximately 94% of the whole ECS, whereas the purple represents the relatively independent ECS areas with a single volume ratio of < 0.20%. Plot taken from Huang with permission from Springer Nature [193]. E Integrative optical imaging (IOI) detecting ECS. Simultaneous recording of direct current potentials and extracellular dextran diffusion during spreading depression and F Time-elapsed fluorescent images at dextran diffusion site. Graphic image taken from Hrabe [195]. G In vivo two-photon imaging of fluorescent tracer diffused through para-arterial spaces (in red), then penetrated into the parenchyma and along venules. Plot taken from Iliff el al. with permission from the Society for Neuroscience [196]. H i) Example of local dimensions of a brain ECS portion and simultaneous ii) instantaneous relative diffusivity map. Plot taken from Paviolo [197]. Scale bars are 2 μm. I SUSHI image of hippocampal neuropil (bright) and ECS (dark) in live tissue, showing the complexity of the ECS compartments. Graphic image taken from T.nnesen et al., with permission from Elsevier [10]. J The LIONESS technology is demonstrated on a living human brain organoid. Optical enhancements, deep learning training and analysis (top) are applied in individual processing steps (bottom). Plot taken from Velicky with permission from Springer Nature [198]. K Tracking quantum dots (QDs) in rat cultured hippocampal slices. Merged image shows reconstructed QD trajectories (red traces) over an epifluorescence micrograph of transduced neurons from the hippocampal dentate gyrus; right: magnified image (white inset) of a reconstructed QD trajectory. Graphic image taken from Grassi [199] |
Optical imaging techniques
Integrative optical imaging (IOI)
Integrative optical imaging (IOI) uses a macromolecule labelled with fluorophore as diffusing probe and a widefield microscope to visualize the diffusion gradient into the tissue [200]. Recently, time-resolved IOI was developed to measure fast changes in brain ECS diffusion with a time resolution of approximately 1 s during spreading depression [195] (Fig. 2E-F). Although the low cost and simplicity of IOI make the approach readily available to researchers, the measurements of brain ECS width or diffusion property are limited to the cortex, which does not allow ECS structure in deeper brain regions to be addressed [188].
Two-photon imaging
Compared to epifluorescence imaging or widefield microscopy, two-photon microscopy offers better optical resolution in the z-axis, enabling live imaging of in situ tissues or in vivo brain. For instance, fluorescent dyes were injected into the cisterna magna or parenchyma, followed by twophoton imaging through a cranial window. The fluorophore diffusion could be visualized and tracked over time to assess CSF influx, ISF flow in brain ECS and glymphatic function [64,68,196] (Fig. 2G). Even though two-photon microscopy has excellent resolution, the tissue penetration is still limited to layer 2-3 in cortex with the requirement of surgery [201]. The diffraction of light also poses a challenge for brain ECS detection, especially for the ECS tunnels less than 250 nm in width.
Super-resolution imaging
The advent of super-resolution microscopy has reconciled live brain tissue imaging with nanoscale spatial resolution [202,203]. For example, stimulated emission depletion (STED) microscopy offers volumetric imaging of highly diffusible fluorophores, which makes it possible to visualize cellular morphology in live tissue [4,204,205]. Based on 3D-STED microscopy and cell impermeable diffusible fluorophore, super-resolution shadow imaging (SUSHI) was developed to reveal distinctive brain ECS structure changes in response to various stimuli [10] (Fig. 2I). By using the glycerol immersion objectives, SUSHI can provide clear images down to 50 μm tissue depth and sharp images of the ECS [10,206]. Compared to intracellular labeling, SUSHI is insensitive to photobleaching and less likely to be affected by phototoxicity, making it an ideal imaging technique for extensive 3D STED time-lapse imaging over large fields of view. Recently, by integrating the data collected from live tissue 3D STED imaging, the machine-learning based image processing technology called LIONESS (live informationoptimized nanoscopy enabling saturated segmentation) achieved dense anatomical reconstruction (Fig. 2J), which is promising for studying the dynamic functional architecture of brain ECS [198].
In addition to SUSHI, a carbon nanotube tracking method based on single-molecule localization microscopy (SMLM) has been developed to reveal the structure and viscoelastic properties of the brain ECS with dimensions down to approximately 40 nm [9]. Specifically, single-walled carbon nanotubes (SWCNTs) can be injected into cerebral ventricles, allowing tracking up to 100 μm deep in different live brain tissues using a widefield microscopy approach at millisecond timescale [197] (Fig. 2H). These SWCNTs could be used as near-infrared fluorescent probes to map the local organization and the changes of diffusivity of the ECS with nanoscale precision [28,207]. Moreover, quantum dots (QDs) with bright and stable fluorescent signal have been successfully used to decipher the heterogenous nanoscale anatomy and diffusion properties in hippocampal areas [199] (Fig. 2K). Taken together, the application of these super-resolution imaging technologies for in vivo tracking of the dynamics of brain ECS channels or combination of them would provide new insights into brain physiology and pathology [208].
Real-time iontophoresis
Real-time iontophoresis (RTI) is widely used to determine the characteristics of brain ECS in real time: volume fraction and tortuosity [209]. Volume fraction (α) is the ratio of ECS volume to the total brain tissue volume, while tortuosity (λ) indicates how difficult a substance passes through brain ECS [210]. In RTI, a pulse of cation probe (typically tetramethylammonium, TMA+) is injected into brain ECS by iontophoresis from the source electrode. And the timedependent ion concentration is measured by ion-selective microelectrode positioned about 100 μm away [211]. By comparing the result with an identical measurement of free diffusion in aqueous solution, λ and α of brain ECS in vivo can be extracted. Notably, a sinusoidal method of TMA+- RTI has been proposed to provide time-resolved quantification of dynamic α(t) and λ(t) in acute brain events (Fig. 3A). Specifically, the injection of TMA+ followed a sinusoidal pattern vs. time. And the transient modulations of the amplitude and phase lag of the sampled TMA+ waveforms were analyzed to infer α(t) and λ(t) [212]. However, the invasive RTI requires the distance between the source and ion-selective microelectrodes to be 80-130 μm, which limits the application of this method for larger brain regions. It is also noteworthy that boundaries in brain parenchyma and permeability of the BBB may make it inapplicable for the point-source paradigm to assess diffusivity [13].

Fig. 3 Advancement in RTI and MRI methods for detecting ECS. A Schematics for a sinusoidal method of TMA+- RTI. Graphic image taken from Chen et al., with permission from Elsevier [212]. B Sagittal MRI showing the distribution of i)17O-enriched water and ii) paramagnetic Gd- DTPA tracer over an 85 min acquisition. Plot taken from Alshuhri [213]. C Diffusion weighted images (DWI) with different b-values (motionrelated signal dephasing). Graphic image taken from Taoka [214]. D Schematic of the diffusion tensor image analysis along the perivascular space (DTI-ALPS) method: i) Roentgenogram of an injected coronal brain slice showing parenchymal vessels that run horizontally on the slice (white box) at the level of the lateral ventricle body. ii) Axial susceptibility-weighted imaging (SWI) on the slice at the level of the lateral ventricle body indicates that parenchymal vessels run laterally (x-axis). iii) Superimposed color display of DTI on SWI indicating the distribution of projection fibers (z-axis: blue), association fibers (y-axis: green), and the subcortical fibers (x-axis: red). iv) Schematic indicating the relationship between the direction of the perivascular space (gray cylinders) and the directions of the fibers. Graphic image taken from Taoka et al. [215] |
Magnetic resonance imaging (MRI)
MRI is known as a non-invasive and safe tool widely used in the diagnosis of brain diseases. Typically, it can be divided into contrast and non-contrast imaging. Gadolinium-based contrast agents (GBCAs) and 17O labeled water are commonly used clinical tracers for contrast imaging to reveal the nanoscale material transport in the brain ECS. For example, H2 17O is a safe tracing agent that behaves like normal water in physiological condition, which is not dependent on additional equipment or pulse sequences [213] (Fig. 3B). Under the electromagnetic field, the spin-lattice relaxation time of the hydrogen nucleus of H2 17O was shortened to produce high signal on MRI, which reveals the distribution of water in brain tissue in real time [216]. As the water diffuses, the signal decreases, while the distribution area increases over time [63,217,218]. A recent diffusion weighted-MRI study revealed differential ECS clearance efficiency in different brain regions [63,219]. Similar to RTI, MRI can be used to accurately measure α and λ by injecting contrast agents [63]. Therefore, contrast agent-MRI demonstrates its potential in revealing material transport in brain ECS. However, it is important to consider the significant variance between the movement of the solvent and the movement of the solute.
To observe brain ECS dynamics without the need for contrast agents, several non-contrast imaging methods have been developed. Recently, low b-value diffusion-weighted imaging (DWI) has been applied to evaluate the CSF dynamics in humans. By visualizing the distribution of motionrelated signal dephasing by CSF, DWI showed heterogenous CSF movements across different brain regions within short imaging time [214,220] (Fig. 3C). However, due to large white matter fibers in brain parenchyma, the defined movements of fluid in perivascular space and ISF are difficult to be assessed by DWI. Diffusion tensor image analysis along the perivascular space (DTI-ALPS) was developed to overcome this problem by measuring diffusivity of water molecules using the diffusion tensor method [215] (Fig. 3D). The ALPS-index presents perivascular diffusivity, indicating the glymphatic system activity. A higher ALPS index may suggest better efficiency of glymphatic clearance.
Taken together, these techniques have their unique strengths and limitations (Table 1), which means that multimodal integration of advanced microscopy and imaging tools are required to investigate different aspects of brain ECS in healthy and pathological conditions.
Table 1 Advantages and disadvantages of different brain ECS detection methods |
 |
Modulation of brain ECS for the intervention of neurological disorders
As described previously, dysregulation of ECS contributes to the disruption of brain homeostasis and the development of neurological disorders, suggesting that ECS could be potential therapeutic target for intervention of brain disorders. Advanced techniques have been developed to monitor the dynamic changes of ECS, allowing the detection of abnormal ECS in the different stages of diseases. Recently, several methods to manipulate brain ECS have been developed, including pharmacological regulation, and physical stimulation by electric or magnetic fields, light and ultrasound. Here we summarize the current findings of brain ECS manipulation, highlighting their applications in different neurological disorders.
Pharmacological modulation
Treatments that modulate glial swelling and the size of brain ECS could be beneficial for neurological disorders. For example, the loop diuretics furosemide and bumetanide blocked epileptiform activity in many seizure models through their blockade of NKCC1-mediated glial swelling [159] (Fig. 4A). Malfunction of the brain ECS and glymphatic cleansing system leads to waste piling up, contributing to the development and progression of many neurological disorders. Since cellular AQP-4 was found up-regulated in the aging brain, and mis-localized in AD [221], astrocytic AQP-4 seems to represent a possible pharmacological candidate for restoration of ECS function in brain diseases [222]. It has been shown that atorvastatin, the cholesterol-lowering drug, could downregulate AQP-4 expression to attenuate ischemic brain edema in rats [223]. Similarly, inhibition of AQP-4 by TGN-020 or AER-271 reduced brain edema and improved neurological deficits in different models of ischemia [224,225] (Fig. 4B). Recently, a novel AQP4 facilitator, TGN-073 was proven to facilitate ISF circulation and was further tested in preclinical study with the goal to decrease amyloid deposits in AD [226,227] (Fig. 5B). These studies indicate that AQP4 agonist/antagonist might be effective modulators of the ECS function and glymphatic flow. Pharmacotherapeutic interventions on perivascular CSF flow, AQP4 channels, and ISF flow have great potentials for treating brain diseases [228].

Fig. 4 Potential mechanisms for pharmacological manipulation of brain ECS. A The loop diuretics furosemide and bumetanide inhibit astrocyte swelling via blocking NKCCI channels in seizures [159]. B AQP4 antagonists, such as atorvastatin, TGN-020, and AER-271 could reduce ischemic brain edema [223⇓-225]. AQP4 agonist TGN-073 could facilitate ISF circulation [226]. C Different anesthetics could accelerate or reduce brain ISF drainage and brain ECS volume fraction via norepinephrine-dependent pathway [187] |

Fig. 5 The Effects of different regulation methods on brain ECS. A Compared to dexmedetomidine and pentobarbital sodium, isoflurane inhalation decreased ECS volume fraction, increased ECS tortuosity, and suppressed ISF drainage. Graphic image taken from Zhao et al. with permission from Springer Nature [187]. B TGN-073 treatment improved glymphatic transport in rat brain as indicated by the infusion of paramagnetic contrast agent Gd-DTPA. Plot taken from Alghanimy et al. [226]. C tDCS transiently increased the effective solute diffusion coefficient of brain tissue for molecules with different sizes (****, p < 0.001; NS, p > 0.05). Graphic image taken from Xia et al. [229]. D rTMS restored glymphatic clearance in medial prefrontal cortex (mPFC) of AD brain (*, p < 0.05; NS, p > 0.05). Plot taken from Lin et al. [230]. E Representative immunohistochemical images of the ECS stained with thioflavin S for senile plaques (green) and with the nuclear stain (DAPI; blue). Red light treatment decreased amyloid plaques in brain ECS of AD animals. Graphic image taken from Yue et al. [217]. F Representative fluorescent images of intracisternal delivered albumin tracer in the FUS-treated (Left) and contralateral nontreated sides (Right) of brain section. G FUS enhanced glymphatic tracer transport in the brain. Plot taken from Ye et al. [231]. H Pulsed ultrasound increased the relative areas of ECS and perivascular space in rat brain slice. Representative field of view obtained with TEM and related mask were shown in the left. Graphic image taken from Hersh et al. with permission from Elsevier [232]. I Lower half-life of ISF drainage, higher ECS volume fraction, lower tortuosity, and higher local diffusion rate were detected in the 7 days after epidural artery implantation (EAI7) than that in control group (Con7), EAI contralateral measurement group (EAI-C7), and EAI plus gelatin sponge pad group (EAI-G7). Graphic image taken from Cai et al. [233] |
The removal efficiency of waste in the brain ECS is significantly higher during sleep than in awake state, while sleep deprivation could promote the deposition of proteins like tau [72]. Interestingly, tracer-based MRI revealed that brain ISF clearance rate varied depending on different anesthesiainduced sleep states [187,234]. For example, dexmedetomidine and pentobarbital sodium could accelerate brain ISF drainage, while isoflurane inhalation decreased brain ECS volume fraction, reduced diffusion in brain ECS and ISF drainage via norepinephrine-dependent pathway [187] (Figs. 4C and 5A). These studies suggested that different anesthetics or local changes of norepinephrine levels could modulate the diffusion properties of brain ECS, providing the bidirectional manipulation tools to further investigate the function of brain ECS in physiological and pathological conditions.
Physical modulation
Electrical stimulation
Transcranial direct current stimulation (tDCS) is a conventional non-invasive technique, which involves attaching electrodes to the scalp to provide a low current (< 2 mA) to a specific area of the brain [235]. It has been widely reported that tDCS has the potential to reduce Aβ burden and protect neurons [236,237]. In addition to neuronal activation, the changes in brain ECS induced by electrical stimulation may represent another intriguing avenue for modulation of brain disorders.
A multiphoton imaging of fluorescent tracer in rat brain tissue showed that tDCS could be attributed to an increase in the effective solute diffusion coefficient of brain tissue ( Deff) and BBB permeability, indicating a potential use of tDCS to improve ECS function in diseases [229] (Fig. 5C). The mathematical model predicted that tDCS could increase Deff of brain ECS by transiently enhancing the brain ECS gap spacing and reducing the extracellular matrix density [229]. Furthermore, recent studies showed that early intervention with anodal transcranial direct current stimulation (AtDCS) reduced Aβ42 burden and protected neurons in AD mouse model [236]. After 10 AtDCS treatments, hippocampal Aβ levels and glial fibrillary acidic protein were reduced in AD mice [238]. However, relegation of Aβ burden in the brain does not always suggest the improvement of cognitive function. It was reported that tDCS failed to improve behavioral deficits in the Morris water maze and novel object recognition tests, nor did it alter the expression of tau, phosphorylated tau and amyloid precursor protein in AD transgenic mice [239]. Therefore, the treatment effects of electrical stimulation and their dependence on the changes of brain ECS still need further investigation.
Another form of electrical stimulation is gamma electrical stimulation (GES), which is based on the gamma entrainment using sensory stimuli (GENUS) to potentially improve AD-associated cognitive impairment [240]. It has been shown that GES could increase microglial cell numbers, reduce Aβ load, and improve behavioral performance after 1 month of treatment [241]. But whether GES modulate the changes of brain ECS is unknown. Interestingly, electroacupuncture (EA) was recently found to enhance perivascular influx in the glymphatic system, improve AQP4 polarity, and reduce Aβ accumulation in AD mouse model as revealed by contrast-enhanced MRI and immunostaining [242] (Fig. 6). But how exactly EA affects CSF-ISF exchange in brain ECS is unclear.

Fig. 6 Physical methods manipulate brain ECS potentially through glymphatic system. Studies have indicated that electrical stimulation could increase solutes diffusion in the brain and perivascular influx in the glymphatic pathway [229,242]. Transcranial magnetic stimulation could accelerate glymphatic clearance efficiency and AQP4 repolarization to alleviate Aβ burden [243]. Similarly, light and ultrasound stimulation were found to improve ISF flow, glymphatic clearance and molecule transport in brain ECS [217,244] |
Transcranial magnetic stimulation
Transcranial magnetic stimulation (TMS) is a non-invasive technique in which the electrical activity of the brain is modulated by the application of a rapidly changing magnetic field [245]. A single pulse of TMS recruits a mixture of excitatory and inhibitory neurons, each with distinct physiological characteristics [246⇓-248]. And the relative recruitment of excitation/inhibition can be controlled by changes of pulse amplitude, width, shape and duration of TMS to modulate aberrant brain networks in diseases such as schizophrenia, depression, autism and dementia [249⇓⇓⇓-253].
Recently, studies have shown that TMS could promote glymphatic function and solute clearance in the brain ECS. Continuous theta-burst stimulation, a new kind of repetitive transcranial magnetic stimulation (rTMS) model, improved glymphatic clearance efficiency and AQP4 polarization in a mouse model of sleep deprivation [254]. It was also reported that continuous theta-burst stimulation accelerated clearance efficiency of glymphatic system, improved spatial memory in AD model mice, reduced Aβ deposition and improved the polarized distribution of AQP4 in cortex and hippocampus [243]. Similarly, rTMS could increase drainage efficiency of brain clearance pathways in early AD mice, including the glymphatic system in the brain parenchyma and meningeal lymphatics [230] (Fig. 5D). These studies suggest that TMS promotes glymphatic Aβ clearance potentially through AQP4 repolarization. Beside the AD model, recent study also reported that rTMS treatment improved glymphatic function and molecule clearance in intracerebral hemorrhage model [255]. Interestingly, continuous theta burst TMS was found to modulate ISF penetration by activating GABAA receptors [256]. Whether TMS directly act on perivascular astrocyte AQP4 via GABA-dependent pathway remains to be explored.
Light stimulation
Light stimulation has been used in many neurological disorders. For example, interstitial photodynamic therapy has been used in the treatment of malignant glioma, where light delivered by implanted light-diffusing fibers activates a photosensitizing agent to induce tumor cell death [257⇓-259]. Optogenetic deep brain stimulation was able to suppress abnormal oscillatory activity in neural circuits to alleviate Parkinsonian motor symptoms [260,261]. Recent work suggested that 40 Hz light flickering had the beneficial potential to ameliorate AD-associated pathology [262,263], which was then reported that it failed to entrain native gamma oscillations in AD mouse models [264]. 40 Hz multisensory audio-visual stimulation promoted CSF influx and ISF efflux in the cortex of AD mouse model via increased astrocytic AQP4 polarization and arterial pulsation, suggesting that sensory gamma stimulation could promote glymphatic function [265]. Interestingly, 60 Hz light-flickering entrainment, instead of 40 Hz frequency, was shown to recapitulate microglia-mediated removal of perineuronal nets, the components of brain ECM [266]. Nevertheless, whether and how light entrainment alone or the combination of sensory stimulation affects the properties and function of brain ECS require further investigation.
Low-level laser lights combined with photo-responsive agent could also dissemble Aβ by breaking its secondary structure in vitro [267]. Moreover, light stimulation has great potential to manipulate brain ECS. It has been shown that red light (630 nm) treatment not only directly destroyed Aβ assembly but also activated formaldehyde (FA) dehydrogenase to degrade FA and attenuated FA-facilitated Aβ aggregation in brain ECS [217,268]. Subsequently, red light stimulation markedly smashed Aβ deposition in brain ECS, recovered the flow of ISF, increased the number of neurons near senile plaques, and rescued cognitive dysfunction in AD mice after 2 months treatment [217] (Fig. 5E). Besides the red light, a series of studies reported similar results that transcranial photo-biomodulation (tPBM, λ = 1267 nm) decreased Aβ deposition and increases lymphatic drainage [269,270]. Since glymphatic clearance of waste in the brain has been shown to follow the circadian rhythm [72,271], night tPBM improved Aβ clearance more effectively than daytime in AD mice [272]. These studies suggest that light stimulation could be used as a tool to modulate ISF flow and glymphatic clearance in brain ECS, while the underlying working mechanism requires further investigation (Fig. 6).
It is worth noting that the skull structure made it difficult for red light and near infrared light to penetrate. Although the longer wavelength of light increased the efficiency of transmission, the heating effects should not be ignored [217]. Intermittent stimulation instead of continuous treatment has been applied to reduce thermal effects, leading to positive effect on Aβ clearance [270]. Regardless, delivering sufficient light dose to deeper structures in the human brain with low heating effects continues to be challenging.
Ultrasound stimulation
A sound wave with a frequency higher than 20 kHz is called ultrasound. Ultrasound has been validated in clinical applications, particularly as an imaging tool for clinical diagnosis. Recently, ultrasound has emerged as a therapeutic tool for local drug or nanoparticle delivery by enlarging the interstitial spaces within the tissue through non-thermal mechanisms [273⇓-275]. For example, recent study demonstrated that the ECS and the perivascular space were enlarged in rat brain neocortical slices after exposed to low intensity ultrasound, promoting the diffusion of small diameter nanoparticles that were injected into the brain slices [232,276]. The same research team presented a MRI-guided transcranial focused ultrasound method and found that ultrasound enhanced the diffusion of small diameter nanoparticles in brain ECS [276]. Similarly, ultrasound alone has been validated to enhance the movement of a low molecular weight tracer in the cerebrospinal fluid [275]. Recent study claimed that low-intensity, non-invasive transcranial ultrasound upregulated the glymphatic pathway to enhance perivascular influx and efficacy of small molecule intrathecal drug delivery without causing brain parenchymal damage [244] (Fig. 5H). Additionally, low-intensity focused ultrasound (LIFUS) stimulation with intravenous injection of microbubbles has been reported to enhance glymphatic system-mediated molecular transport in deep brain regions without disrupting the BBB permeability [231] (Fig. 5F-G). These findings indicate that LIFUS has great potential to actively regulate molecule transport in brain ECS.
Furthermore, many studies have been carried out to determine whether and how ultrasound exposure could improve brain ECS function in neurological disorders. Specifically, ultrasound radiation can increase AQP4 expression, which is closely related to the glymphatic clearance of Aβ [277,278]. AQP4 expression was upregulated after focused ultrasound mediated blood-brain-barrier disruption (FUS-BBBD) [277]. Similarly, other study found that in FUS-BBBD, higher acoustic pressure resulted in higher AQP4 expression and reduced number of Aβ plaques [278]. Focused ultrasound treatment in combination with microbubbles enhanced the clearance of soluble Aβ but not the Aβ plaques from the brain parenchyma into the cerebrospinal fluid space, which was then uptaken by the deep cervical lymph node [279]. Transient perivenous enhancement induced by MRI-guided FUS-BBBD was observed in humans with early AD as well [280]. Besides AD, as described above, AQP4 distribution is also closely associated with stroke. Ultrasound also shows great potential for treating stroke by altering AQP4 localization and expression. Low intensity ultrasound (LIUS) stimulation was reported to significantly suppress edema formation by reducing brain water content and intracranial pressure [281,282]. Furthermore, LIFUS stimulation significantly decreased the localization of AQP4 on astrocytic endfeet in the edematous model. And the expression of AQP4 was significantly upregulated after water intoxication and downregulated after LIUS treatment [281,283]. Taken together, these studies indicate that ultrasound could be a powerful tool to modulate ECS function in brain disease by regulating AQP4 expression, glymphatic clearance and molecule diffusion (Fig. 6).
Compared to light stimulation, ultrasound has been shown to have greater penetration and less heating effect [275,284,285]. In particular, pulsed focused ultrasound exposures with short duty cycles produce lower time-averaged energy deposition rates, resulting in minimal temperature increases (≤ 5 °C) [284]. However, most studies have focused on the acute treatment, while the chronic effects of ultrasound stimulation in different brain diseases remain unclear. This is especially important for FUS-BBBD method because of the secondary sterile inflammation effects following BBB disruption [286,287]. In the absence of microbubble-related cavitation and thermal effects, the radiation force emitted by ultrasound might trigger a cascade of activation events in brain cells [288]. However, the relationships or molecular interactions between ultrasound stimulation of brain cells and changes of brain ECS are open for future investigation.
Surgical modulation
Epidural pulsation
In addition to the pharmacological and physical stimulations that actively regulate brain ECS, a clinical procedure has been discovered with the potential to regulate brain ECS through mechanical pulsation. Encephaloduroarteriosynangiosis (EDAS) was clinically used to reduce the risk of stroke in patients by completely freeing the superficial temporal artery in the scalp and attaching to the ischemic brain surface to improve blood flow supply [289,290]. Recent study found that epidural arterial implantation (EAI), in which a branch of the external carotid artery was severed and implanted epidurally, could simulate clinical EDAS surgery [233]. EAI surgery increased epidural arterial pulsation and decreased tortuosity in the caudate nucleus, promoting molecule diffusion and volume fraction increase in brain ECS of caudate nucleus region [233] (Fig. 5I). Moreover, regulation of intracerebral arterial pulsation by systematic administration of dopamine agonists and ligation of internal carotid artery was associated with the changes of CSF-ISF exchange rate [196]. Computational modeling also suggested that even in the presence of moderate adverse pressure gradients, arterial pulsation was sufficient to induce fluid flow in the perivascular space, promoting the molecule transport and ISF clearance [291⇓-293]. These studies indicate that arterial pulsation could regulate ISF flow and molecule transport in brain ECS. And epidural pulsation might be a useful way with therapeutic potential to modulate the function of brain ECS.
Measurement and characterization of brain ECS paves the way to evaluate the influence of different pharmacological, physical, and surgical manipulations on ECS. These methods to alter the diffusion properties of brain ECS, ISF flow, or glymphatic function can offer insight into pathogenesis of brain diseases and potential therapy to correct or improve ECS function (Table 2). It is also important to note that a closed-loop system for brain ECS manipulation that combines the stimulation feedback and real-time tracking of brain ECS dynamics is required for future exploration and therapeutic application.
Table 2 Comparisons of different brain ECS modulation methods |
 |
Perspectives
Changes of brain ECS in aging
The geometry of the brain ECS changes in aging due to the loss of synapses and neurons, demyelination, degradation of ECM, changes in morphology and numbers of glia, and accumulation of pathological proteins [294,295]. Glymphatic system has been shown to facilitate the metabolite clearance in the brain ECS through CSF-ISF flow mainly during sleep [64,68]. Glymphatic clearance was reduced by 40% in aged mice relative to young ones, suggesting impairment of glymphatic pathway in aging [94,296]. Agedependent disruption of sleep architecture and circadian rhythm may contribute to the accumulation of waste in brain ECS [72,297,298]. In fact, microstructure changes of ECS in the white matter of human brain correlate with sleep-wake state [299]. Aged brains also show altered AQP4 localization and enlarged perivascular spaces [300,301]. These studies support the hypothesis of age-dependent impairment of waste disposal system in brain ECS. Interestingly, researchers have found that dietary intake of omega-3, intermittent fasting, and right lateral sleeping position, all could boost glymphatic transport [302⇓-304]. Chronic alcohol consumption, on the other hand, is associated with decrease in brain ECS tortuosity and altered transmitter diffusion dynamics [305]. These findings have highlighted that healthy lifestyle is crucial for healthy aging from the perspectives of brain ECS geometry and function.
Blood-brain barrier function and brain ECS homeostasis
The blood-brain barrier (BBB) plays a crucial role in selectively controlling the transmission of essential materials from the vessels to the brain. Particularly, the presence of tight junction forms several distinct barriers forbidding the communication of CSF and blood stream and peripheral extracellular fluid [306]. It has been demonstrated that CSF flows between the basement membrane and astrocyte end feet of arteries and capillaries, with arteriole pulsations driving bulk fluid flow through the parenchyma [14]. BBB also regulates ion transport to keep the ISF optimal for neuronal functioning [307]. The integrity of BBB is related to the glymphatic efficiency and brain ECS homeostasis. The disruption of BBB causes significant changes in brain ECS, leading to brain pathology. For instance, increased BBB permeability and vascular pathology were found in patients with dementia [308]. The reciprocal relationships between Aβ accumulation and BBB disruption promote the progression of neurodegeneration [309,310]. The entrance of blood driven molecules into interstitial space triggers the cascades of immune responses, leading to the reduction of convective flow, decreased CSFISF exchange, and impaired glymphatic clearance [311,312]. Thus, BBB dysfunction contributes to the disruption of brain ECS homeostasis in various neurological diseases. A better understanding of the interactions between BBB and ECS transport will help us to develop clinical relevant methods to improve waste clearance and drug efficiency.
Extracellular vesicles in brain ECS
The intricate network of communication within the brain relies on the dynamic interplay between diverse cellular populations. Recently, the emergence of extracellular vesicles (EVs) has opened new avenues for intercellular communication in the brain [313]. Exosomes, are small EVs derived from neuronal and glial cells, containing proteins, RNAs, lipids, and other signaling molecules. They are actively involved in synaptic regulation, production and turnover of myelin, and the progression of neurodegenerative diseases [314,315]. Exosomes that contained increased levels of Aβ and α-syn were identified in AD and PD patients [316,317]. The administration of these exosomes could trigger disease-related symptoms and pathology in neuronal cultures and heathy mice, suggesting that exosome secretion could be the pathway to promote the spreading of pathological proteins in brain ECS [317,318]. Besides, studies showed that changes of certain cargo expression and the number of EVs were associated with severity of depression, immune responses, and inflammatory cascades [319⇓-321]. The close relationships between EVs and the neuropathological processes have highlighted the clinical potentials of EVs for disease screenning and drug delivery [322,323]. Since EVs are secreted to brain ECS, the trafficking of EVs could be affected by dynamic changes of ECS. The expansion of ECS may facilitate long-range traveling of small EVs, while shrinkage of ECS may limit the EV transportation and exosome-mediated intercellular communication [324]. Future investigations of EV trafficking in different ECS conditions will help us to map the effective range of EV-mediated intercellular communication in the brain.
Pharmacokinetics in brain ECS
The heterogeneity of brain ECS also affect the distribution, elimination and dosage of drugs needed for brain disorders. Since the drug is subject to local diffusion, bulk flow, and fluid exchange in ECS, brain region-specific properties of ECS should be taken into considerations for clinical studies and medication [2]. On the one hand, simulation and mathematical modeling of the interstitial solute transport [325] and spatial drug distribution in different brain regions [326] would be helpful for understanding region-specific and drug-specific pharmacokinetics in brain ECS. On the other hand, improving the penetration of drugs into brain ECS is required since many promising drugs fail to work because of the inability to effectively deliver and maintain at the adequate working concentrations in the brain [327]. A series of studies has demonstrated a promising way to delivery drug to the brain by intraparenchymal microcatheters under pressure gradient, which is called as convection-enhanced delivery (CED) [328⇓-330]. Although CED can increase drug distribution in brain ECS and ISF flow, problems involving catheter design, placement and implementation often occur due to limited understanding of ECS properties and variability in the target brain regions [331]. Increasing research has focused on the development of nanoparticles that could transport in brain ECS bypassing BBB [332,333]. Manipulation of brain ECS could further promote the transportation and delivery of nanoparticles and drugs. For example, dexmedetomidine, an adrenergic agonist sedative, increased the brain delivery of intrathecally administered drugs through enhanced glymphatic flow [334]. Transcranial focused ultrasound was also found promising to increase drug delivery efficiency via the changes of brain ECS [275,276]. Therefore, characterization of brain ECS is crucial for modeling pharmacokinetics, while the manipulation of brain ECS is helpful for the improvement of drug delivery.
Brain ECS in microgravity environment
Interestingly, many studies demonstrated that long time exposure of microgravity environment leads to certain adaptive changes in the brain parenchyma, CSF, and blood vessels in astronauts [335,336]. Microgravity environment also results in structure changes of ECS. Specifically, the tortuosity of the ECS in hippocamps decreased at first and then increased, while the volume fraction of ECS increased in a tail-suspended hindlimb-unloading rat model [337]. The alterations to ISF drainage and diffusion in ECS were not able to recover after 7 days but not 3 days of microgravity treatment, indicating that long-time exposure to microgravity environment might affect brain ECS properties and function of astronauts [337]. Indeed, prolonged microgravity exposure during long-period spaceflight produces unusual and pathologic neuro-ophthalmic symptoms in astronauts, as well as changes in brain, including the enlarged basal ganglia and white matter perivascular space [338,339]. The dilated perivascular space indicates the disturbances of the glymphatic pathway, which may play important role in the development of spaceflight associated neuro-ocular syndrome [340]. However, it remains unknown that what kind of damages to brain ECS function would be caused and how to protect brain ECS function in microgravity environment.
Conclusion
Brain ECS has been recognized as gap-filler for years but is now viewed as a dynamic and active player in regulating brain function. The changes of biophysical properties of ECS affect the diffusion and transportation of molecular signals, neuromodulators, and waste in the brain. The development of state-of-art technologies has helped the dissection of heterogenous geometry and nanoscale architecture of brain ECS, while characterization and interpretation of real 3D dynamics of brain ECS are open for future research. Based on the close associations between dysregulation of brain ECS and pathogenesis and progression of many neurological disorders, manipulations of brain ECS offers a novel therapeutic pathway to alleviate aberrant protein accumulation, improve glymphatic flow and promote drug delivery. Pharmacological, physical, and surgical stimulations to modulate ECS will also help better understanding the effects of ECS change on the brain cells. Further research is required to unravel the underlying mechanisms connecting the dynamic brain ECS changes to neural network regulation to brain dysfunction in disease.
Acknowledgements Not applicable.
Authors' contributions Y.Y., H.H and F.L. conceived the review topic and scope. Y.Y., Y.C., J.L., L.M. and F.L. wrote and revised the manuscript. H.H provided feedback on revisions. The authors read and approved the final manuscript.
Funding This research was funded by the start-up funding of Shenzhen Bay Laboratory, Shenzhen, Guangdong Province, China.
Availability of data and materials Not applicable.
Declarations
Ethics approval and consent to participate Not applicable.
Consent for publication All authors have read and agreed to the published version of the manuscript.
Competing interests The authors declare that they have no competing interests.
Open Access This article is licensed under a Creative Commons Attribution 4.0 International License, which permits use, sharing, adaptation, distribution and reproduction in any medium or format, as long as you give appropriate credit to the original author(s) and the source, provide a link to the Creative Commons licence, and indicate if changes were made. The images or other third party material in this article are included in the article's Creative Commons licence, unless indicated otherwise in a credit line to the material. If material is not included in the article's Creative Commons licence and your intended use is not permitted by statutory regulation or exceeds the permitted use, you will need to obtain permission directly from the copyright holder. To view a copy of this licence, visit http://creativecommons.org/licenses/by/4.0/.
Publisher's Note Springer Nature remains neutral with regard to jurisdictional claims in published maps and institutional affiliations.
