诊断学理论与实践 ›› 2019, Vol. 18 ›› Issue (04): 432-435.doi: 10.16150/j.1671-2870.2019.04.010
常蕊, 徐嘉旭, 董海鹏, 吴梦雄( ), 赵雪松, 缪飞, 严福华
收稿日期:2019-02-20
出版日期:2019-08-25
发布日期:2019-08-25
通讯作者:
吴梦雄
E-mail:40618@rjh.com.cn
CHANG Rui, XU Jiaxu, DONG Haipeng, WU Mengxiong(), ZHAO Xuesong, MIAO Fei, YAN Fuhua
Received:2019-02-20
Online:2019-08-25
Published:2019-08-25
Contact:
WU Mengxiong
E-mail:40618@rjh.com.cn
摘要:
目的: 探讨CT能谱成像定量分析在小肠克罗恩病活动度评估中的价值。方法: 回顾性分析我院2015年8月至2016年9月行CT能谱成像检查,且经病理证实的小肠克罗恩病患者54例,将其分为活动期组(34例)和缓解期组(20例),对其活动期与缓解期的肠壁动脉期(aterial phase,AP)及门脉期(portal phase,PP)标化碘浓度(normalized iodine concentration,nIc)、标化水浓度(normalized water concentration,nWc)、能谱曲线斜率进行比较,并计算和绘制上述有统计学差异的变量的受试者工作特征曲线。 结果: CT能谱成像中,小肠克罗恩病患者活动期肠壁AP及PP的nIc值分别为(0.228±0.100) g/L、(0.530±0.097) g/L,均高于缓解期[AP及PP的nIc分别为(0.097±0.045) g/L、(0.252±0.063) g/L](P<0.05);而活动期的肠壁PP的nWc值为(0.232±0.068) g/L,高于缓解期肠壁[(0.009±0.013) g/L](P<0.05);活动期的肠壁AP、PP能谱曲线的斜率分别为(2.749±1.051)和(3.638±0.724),均高于缓解期[AP、PP分别为(1.069±0.467)和(1.653±0.687)](P<0.05);CT能谱成像AP、PP的nIc鉴别小肠克罗恩病活动期与缓解期的受试者工作特征曲线下面积值分别为0.965和0.998;PP的nWc鉴别二者的曲线下面积值为0.726;AP、PP的能谱曲线斜率鉴别二者的曲线下面积值分别为0.964和0.972。结论: CT能谱成像可以定量鉴别克罗恩病的活动期与缓解期,AP和PP的nIc值及能谱曲线斜率是两者鉴别中较优的参数。
中图分类号:
常蕊, 徐嘉旭, 董海鹏, 吴梦雄, 赵雪松, 缪飞, 严福华. CT能谱成像在小肠克恩罗恩病活动度评估中的价值[J]. 诊断学理论与实践, 2019, 18(04): 432-435.
CHANG Rui, XU Jiaxu, DONG Haipeng, WU Mengxiong, ZHAO Xuesong, MIAO Fei, YAN Fuhua. Value of CT spectral imaging in the evaluation of Crohn's disease activity[J]. Journal of Diagnostics Concepts & Practice, 2019, 18(04): 432-435.
表1
活动期与缓解期的肠段双期nIc、nWc、能谱曲线斜率比较(g/L,$\bar{x}±s$)
| 疾病活动度 | nIc | nWc | 能谱曲线斜率 | |||||
|---|---|---|---|---|---|---|---|---|
| AP | PP | AP | PP | AP | PP | |||
| 活动期 | 0.228±0.100 | 0.530±0.097 | 0.132±0.086 | 0.232±0.086 | 2.749±1.051 | 3.638±0.724 | ||
| 缓解期 | 0.097±0.045 | 0.252±0.063 | 0.007±0.018 | 0.009±0.013 | 1.069±0.467 | 1.653±0.687 | ||
| P值 | <0.05 | <0.05 | 0.087 | <0.05 | <0.05 | <0.05 | ||
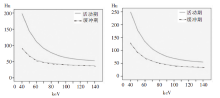
图1
活动期和缓解期肠壁动脉期和门脉期能谱曲线 曲线呈衰减趋势,两者的曲线不相交,差异较大
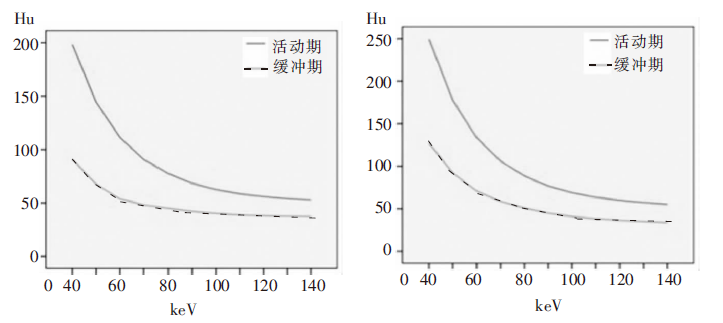
表2
nIc、nWc、及能谱曲线斜率诊断克罗恩病活动期与缓解期的效能及最佳临界值
| 参数 | AP-nIc | PP-nIc | PP-nWc | AP-k | PP-k |
|---|---|---|---|---|---|
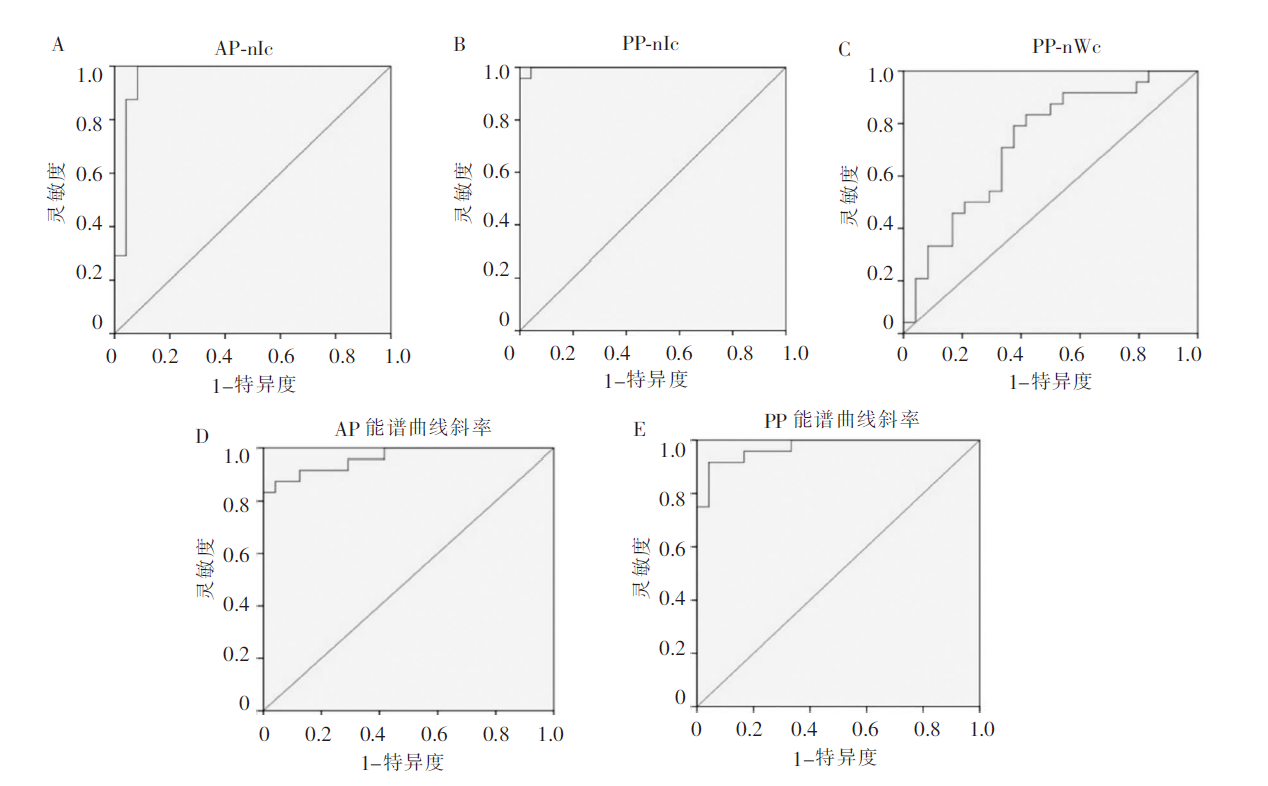
| 曲线下面积 | 0.965 | 0.998 | 0.726 | 0.964 | 0.972 |
| 灵敏度 | 0.875 | 0.958 | 0.792 | 0.958 | 0.960 |
| 特异度 | 0.917 | 0.958 | 0.625 | 0.583 | 0.469 |
| 界点值 | 0.118 | 0.343 | 1.004 | 1.112 | 1.114 |
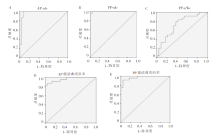
图2
受试者工作特征曲线图
| [1] |
Podolsky DK. Inflammatory bowel disease[J]. N Engl J Med, 2002, 347(6):417-429.
doi: 10.1056/NEJMra020831 URL |
| [2] | 王明亮, 林晓珠, 缪飞, 等. CT能谱成像对物质内碘含量测定的价值:体模研究[J]. 中国医学计算机成像杂志, 2011, 17(2):172-175. |
| [3] | 任小军, 章士正, 张峭巍, 等. 小肠Crohn病的MRI诊断[J]. 中华放射学杂志, 2004, 38(11):1201-1205. |
| [4] |
Wold PB, Fletcher JG, Johnson CD, et al. Assessment of small bowel Crohn disease: noninvasive peroral CT enterography compared with other imaging methods and endoscopy--feasibility study[J]. Radiology, 2003, 229(1):275-281.
doi: 10.1148/radiol.2291020877 URL |
| [5] |
Makó EK, Mester AR, Tarján Z, et al. Enteroclysis and spiral CT examination in diagnosis and evaluation of small bowel Crohn's disease[J]. Eur J Radiol, 2000, 35(3):168-175.
pmid: 11000559 |
| [6] | 刘金刚, 刘亚, 李丽新, 等. CT能谱成像在诊断肿瘤淋巴结转移和肿瘤性质中的作用[J]. 中华放射学杂志, 2011, 45(8):731-735. |
| [7] | 任庆国, 滑炎卿, 李剑颖. CT能谱成像的基本原理与临床应用[J]. 国际医学放射学杂志, 2011, 4(6):559-563. |
| [8] | 刘晓冬, 刘爱连, 孙美玉, 等. CT能谱成像对大肠腺瘤及肿块型腺癌的鉴别诊断价值[J]. 中华放射学杂志, 2017, 51(4):279-283. |
| [9] | 杨创勃, 李新胜, 任成龙, 等. 能谱CT在鉴别小肠腺癌和原发小肠淋巴瘤中的临床价值[J]. 中国医学影像学杂志, 2016, 24(11):834-838. |
| [10] | 张旭婷, 刘琪, 郝雅静, 等. 宝石CT能谱成像对胃间质瘤的诊断价值[J]. 中国医学影像学杂志, 2015, 23(4):264-267. |
| [11] | 徐学勤, 林晓珠, 朱晓雷, 等. 不同病理类型膀胱癌能谱CT成像特点的临床研究[J]. 中国医学计算机成像杂志, 2013, 19(1):61-64. |
| [12] | 张军, 邓克学, 刘志远, 等. CT能谱成像鉴别诊断胰腺癌与肿块型胰腺炎[J]. 中国医学影像学杂志, 2015, 23(4):268-272. |
| [13] | 王传彬, 韦树华, 张萍, 等. 能谱CT术前定量评估直肠腺癌分化程度的应用价值[J]. 实用放射学杂志, 2017, 33(3):451-454. |
| [1] | 刘萍, 肖园, 王歆琼, 陆亭伟, 赵雪松, 杨媛艳. Wiskott-Aldrich综合征合并克罗恩病一例并文献复习[J]. 诊断学理论与实践, 2022, 21(03): 349-354. |
| [2] | 王昭晖, 吴海波. 胃神经鞘瘤31例临床病理学分析[J]. 诊断学理论与实践, 2021, 20(06): 552-556. |
| [3] | 吴霜, 解骞, 管雪妮, 张素芳, 高信芳, 梁宗辉. 磁共振体素内不相干运动扩散加权成像诊断活动期克罗恩病的价值及效能分析[J]. 诊断学理论与实践, 2020, 19(02): 157-161. |
| [4] | 杜月月, 杜军, 沈倩, 葛绾宇, 吴海波. Warthin瘤样甲状腺乳头状癌1例及临床病理观察[J]. 诊断学理论与实践, 2020, 19(02): 188-190. |
| [5] | 王建军, 陈雅, 樊祥山, 牛丰南. 脾脏硬化性血管瘤样结节性转化8例临床病理分析及文献复习[J]. 诊断学理论与实践, 2019, 18(05): 560-564. |
| [6] | 余悠悠, 曾俊祥, 罗婷, 邓琳, 潘秀军. 三种不同品牌ELISA试剂盒检测ASCA的结果比较及性能评估[J]. 诊断学理论与实践, 2019, 18(04): 454-459. |
| [7] | 杨茹雪, 李楠, 周婷, 赵艳, 陈少华, 朱清, 冯振中. 皮肤黑素细胞病变的临床病理分析[J]. 诊断学理论与实践, 2018, 17(05): 566-571. |
| [8] | 忻笑容, 陈平, 罗方秀, 吴云林. 嗜酸粒细胞性肠炎并发小肠穿孔一例[J]. 诊断学理论与实践, 2018, 17(05): 590-592. |
| [9] | 曾俊祥, 罗婷, 葛文松, 潘秀军, 沈立松. 抗GP2和抗CUZD1抗体对克罗恩病的诊断价值评估[J]. 诊断学理论与实践, 2018, 17(04): 433-438. |
| [10] | 朱培培, 邹珏, 陈军, 徐蓉蓉, 颜红柱. 颅内孤立性纤维性肿瘤/血管周细胞瘤20例临床病理特征分析[J]. 诊断学理论与实践, 2017, 16(06): 622-626. |
| [11] | 符蓉, 王朝夫, 欧阳斌燊. 软骨母细胞瘤21例临床病理及影像学特征分析[J]. 诊断学理论与实践, 2017, 16(05): 537-539. |
| [12] | 衣琳, 肖立, 陈燕, 殷于磊. 间变性大细胞淋巴瘤临床病理特征分析[J]. 诊断学理论与实践, 2017, 16(03): 313-319. |
| [13] | 姜美娇, 詹维伟, 陈慧, 徐瑞云, 杨志芳, 刘娟. 女性低位肠道肿瘤的超声误诊分析[J]. 诊断学理论与实践, 2017, 16(01): 109-113. |
| [14] | 张晶, 周军, 孙林德, 赵志华,. 肾脏上皮样血管平滑肌脂肪瘤9例临床病理分析[J]. 诊断学理论与实践, 2016, 15(03): 297-301. |
| [15] | 席瑜玲, 梁宗辉, 叶涛,. 克罗恩病的影像学诊断的研究进展[J]. 诊断学理论与实践, 2016, 15(01): 57-60. |
| 阅读次数 | ||||||
|
全文 |
|
|||||
|
摘要 |
|
|||||