诊断学理论与实践 ›› 2025, Vol. 24 ›› Issue (02): 146-154.doi: 10.16150/j.1671-2870.2025.02.005
蔡欣欣1, 邓嵘1, 徐欣欣1, 许芷涵2, 常蕊1, 董海鹏1, 林慧敏1, 严福华1,3( )
)
收稿日期:2024-12-28
接受日期:2025-03-24
出版日期:2025-04-25
发布日期:2025-07-11
通讯作者:
严福华 E-mail:yfh11655@rjh.com.cn基金资助:
CAI Xinxin1, DENG Rong1, XU Xinxin1, XU Zhihan2, CHANG Rui1, DONG Haipeng1, LIN Huimin1, YAN Fuhua1,3()
Received:2024-12-28
Accepted:2025-03-24
Published:2025-04-25
Online:2025-07-11
摘要:
目的: 探讨不同扫描条件下,基于光子计数CT物质分离技术衍生的脂肪分数(CT-derived fat fraction,CT-FF)与磁共振成像质子密度脂肪分数(magnetic resonance imaging proton density fat fraction, MRI-PDFF)间的一致性,以期建立适用于中国人群的肝脏CT脂肪含量的测定方法。方法: 2023年9月至2024年2月期间,上海交通大学医学院附属瑞金医院前瞻性招募了383位健康志愿者(MRI-PDFF < 5%者176例,MRI-PDFF≥5%者207例),根据CT管电压(120 kVp/140 kVp)和辐射剂量(标准剂量/低剂量)不同,将其随机分配至不同光子计数CT扫描方案的4组[①120 kVp+标准剂量(n = 123);②120 kVp+低剂量(n = 71);③140 kVp+标准剂量(n = 120);④140 kVp+低剂量(n = 69)]。所有受试者均接受光子计数CT肝脏扫描和MRI检查,并测量肝脏MRI-PDFF值作为肝脏脂肪含量测定的金标准。在纳入人群(n = 383)的标准剂量组(n = 243)内,随机挑选管电压120 kVp组(n = 123)和140 kVp组(n = 120)中各50人,组成测试队列(n = 100),剩余受试者作为验证队列(n = 283)。在测试队列的MRI-PDFF<5%的志愿者(n = 66)中,分别在120 kVp组(n = 33)和140 kVp组(n = 33)各随机选取20人,组成阈值调整队列(n =40),测量肝脏和腹壁皮下脂肪组织在高、低能量箱下的平均CT值,作为物质分离阈值。在测试队列中,观察采用对比调整前(机器提供的参考阈值)阈值,测得CT-FF值与MRI-PDFF值的相关性和一致性,同时观察采用调整队列获得的阈值测得CF-FF与MRI-PDFF值间的相关性和一致性。结果: 基于阈值调整队列数据,120 kVp下,肝脏组织在低、高能量箱的平均CT值分别为65 HU和70 HU,140 kVp下低、高能量箱平均CT值亦是65 HU、70 HU;脂肪组织在120 kVp低、高能量箱的平均CT值分别为−127 HU 和−96 HU,在140 kVp低、高能量箱的平均CT值分别为−125 HU和−92 HU,以上作为物质分离密度阈值。在测试队列中,阈值调整后CT-FF与MRI-PDFF的相关性(r,0.98比0.77)、一致性(ICC,0.980比0.770;r2,0.96比0.60)较前(基于机器提供的参考阈值测得的结果)明显提升,平均差值显著缩小(−0.7%比−18.1%)。在验证队列整组和不同的管电压及辐射剂量亚组中,CT-FF值与MRI-PDFF值的相关性和一致性都极好(r = 0.99, P < 0.001, r2 = 0.98, ICC = 0.99),平均差值均不大于−0.7%。 结论: 本研究基于中国人肝脏组织特性,优化光子计数CT物质分离算法的密度阈值,首次建立了适用于国人的脂肪定量校正标准,显著提升测量准确性,有望为无创、精准定量肝脏脂肪含量提供新手段。
中图分类号:
蔡欣欣, 邓嵘, 徐欣欣, 许芷涵, 常蕊, 董海鹏, 林慧敏, 严福华. 基于光子计数CT的肝脏脂肪分数定量测定与磁共振质子密度脂肪分数间的一致性研究[J]. 诊断学理论与实践, 2025, 24(02): 146-154.
CAI Xinxin, DENG Rong, XU Xinxin, XU Zhihan, CHANG Rui, DONG Haipeng, LIN Huimin, YAN Fuhua. Study on consistency between liver fat fraction quantification based on photon-counting CT and MRI proton density fat fraction[J]. Journal of Diagnostics Concepts & Practice, 2025, 24(02): 146-154.
表1
受试者资料
| Item | Number/ Range | Mean ± Standard Deviation/ Median (Interquartile Range) |
|---|---|---|
| Age(year) | 19-87 | 42(30, 53) |
| Sex(n) | ||
| Male | 215 | / |
| Female | 168 | / |
| BMI(Kg/m2) | 17.13-47.91 | 25.44(22.86,28.07) |
| CT-FF(%) | (-4.2)-42.1 | 5.3(2.0,14.2) |
| MRI-PDFF(%) | 0.8-41.3 | 5.7(2.5,14.6) |
| Subgroups | ||
| Tube voltage (n) | ||
| 120 kVp | 194 | / |
| 140 kVp | 189 | / |
| Radiation dose (n) | ||
| Low dose | 140 | / |
| Standard dose | 243 | / |
| Effective dose(mSv) | ||
| Low dose | 0.56-4.11 | 1.23(1.02, 1.58) |
| Standard dose | 0.71-6.48 | 1.88(1.49, 2.60) |

图1
PCCT和MRI-PDFF下的肝脏脂肪含量测定示例图注:使用PCCT(A)和MRI-PDFF(B)对1名29岁的体质量指数(body mass index, BMI)为23.9 kg/m2的男性进行肝脏脂肪含量测定(ROI分别放置在肝左叶、右前叶和右后叶)。


图2
PCCT LiverVNC物质分离原理图


图3
受试者管理与分组流程图


图4
CT-FF值与PDFF值的分布散点图和Bland-Altman图A‒D:测试队列,A、B:阈值调整前;C、D:阈值调整后。E、F:验证队列,阈值调整后。
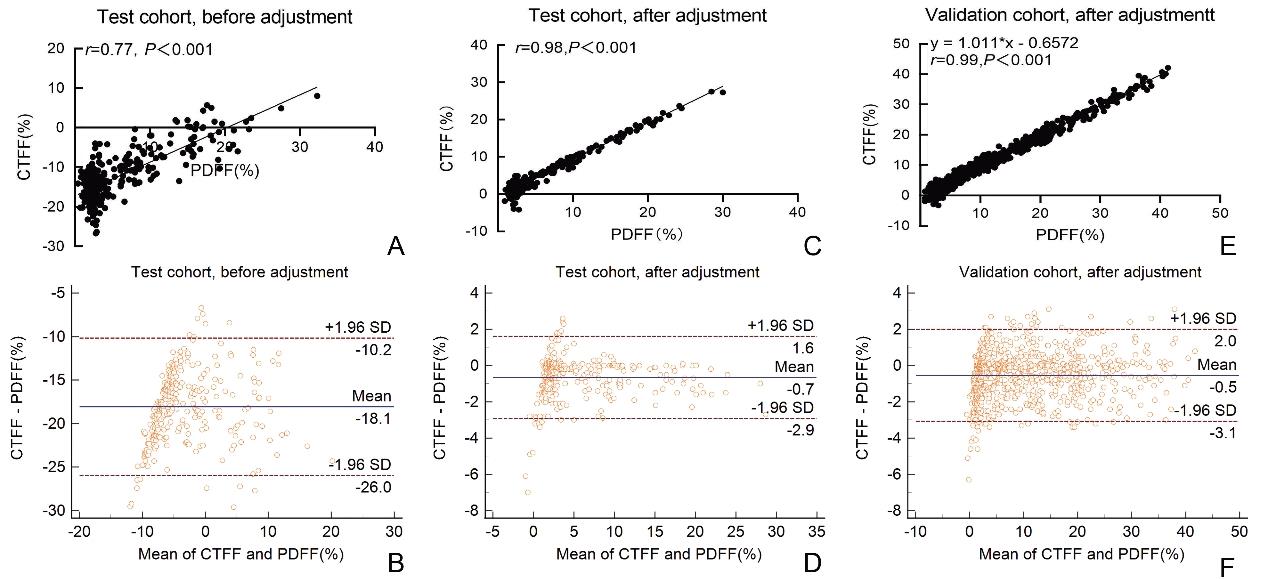
表2
肝脏组织、脂肪组织在不同管电压、不同能量箱下的调整前、后的阈值
| Adjustment | Tube voltage | Fat | Liver | ||
|---|---|---|---|---|---|
| Low energy | High energy | Low energy | High energy | ||
| Before | 120 kVp | -100 HU | -92 HU | 59 HU | 58 HU |
| 140 kVp | -100 HU | -92 HU | 59 HU | 58 HU | |
| After | 120 kVp | -127 HU | -96 HU | 65 HU | 70 HU |
| 140 kVp | -125 HU | -92 HU | 65 HU | 70 HU | |
表3
验证队列CT-FF值与PDFF值的比较及在不同管电压及辐射剂量组的亚组分析
| Analysis | Correlation | Consistency | Bland-Altman analysis | ||||
|---|---|---|---|---|---|---|---|
| r | r2 | Intraclass correlation (ICC) | Mean of bias | Limits of agreement (%) | |||
| ICC | 95%CI | ||||||
| Whole-group analysis | 0.99 | 0.98 | 0.991 | 0.989 to 0.992 | -0.5 | -3.1 to 2.0 | |
| Subgroup analysis | |||||||
| Tube voltage (kVp) | |||||||
| 120 | 0.99 | 0.98 | 0.991 | 0.989 to 0.992 | -0.4 | -3.1 to 2.3 | |
| 140 | 0.99 | 0.98 | 0.991 | 0.989 to 0.992 | -0.7 | -2.9 to 1.6 | |
| Radiation dose | |||||||
| Standard | 0.99 | 0.98 | 0.991 | 0.989 to 0.992 | -0.7 | -3.3 to 1.8 | |
| Low | 0.99 | 0.98 | 0.991 | 0.989 to 0.993 | -0.3 | -2.8 to 2.1 | |
| [1] |
WANG D Q, PORTINCASA P, NEUSCHWANDER-TETRI B A. Steatosis in the liver[J]. Compr Physiol,2013,3(4):1493-1532.
doi: 10.1002/cphy.c130001 pmid: 24265237 |
| [2] | RINELLA M E, LAZARUS J V, RATZIU V, et al. A multisociety Delphi consensus statement on new fatty liver disea-se nomenclature[J]. Ann Hepatol,2024,29(1):101133. |
| [3] |
MAN S, DENG Y, MA Y, et al. Prevalence of liver steatosis and fibrosis in the general population and various high-risk populations: a nationwide study with 5.7 million adults in china[J]. Gastroenterology,2023,165(4):1025-1040.
doi: 10.1053/j.gastro.2023.05.053 pmid: 37380136 |
| [4] |
WALKER R W, BELBIN G M, SOROKIN E P, et al. A common variant in PNPLA3 is associated with age at diagnosis of NAFLD in patients from a multi-ethnic biobank[J]. J Hepatol,2020,72(6):1070-1081.
doi: S0168-8278(20)30123-9 pmid: 32145261 |
| [5] |
YOUNOSSI Z M, KOENIG A B, ABDELATIF D, et al. Global epidemiology of nonalcoholic fatty liver disease-meta-analytic assessment of prevalence, incidence, and outcomes[J]. Hepatology,2016,64(1):73-84.
doi: 10.1002/hep.28431 pmid: 26707365 |
| [6] | DULAI P S, SINGH S, PATEL J, et al. Increased risk of mortality by fibrosis stage in nonalcoholic fatty liver di-sease: Systematic review and meta-analysis[J]. Hepatology,2017,65(5):1557-1565. |
| [7] | SEEFF L B, EVERSON G T, MORGAN T R, et al. Complication rate of percutaneous liver biopsies among persons with advanced chronic liver disease in the HALT-C trial[J]. Clin Gastroenterol Hepatol,2010,8(10):877-883. |
| [8] |
REGEV A, BERHO M, JEFFERS L J, et al. Sampling error and intraobserver variation in liver biopsy in patients with chronic HCV infection[J]. Am J Gastroenterol,2002,97(10):2614-2618.
doi: 10.1111/j.1572-0241.2002.06038.x pmid: 12385448 |
| [9] |
REEDER S B, HU H H, SIRLIN C B. Proton density fat-fraction: a standardized MR-based biomarker of tissue fat concentration[J]. J Magn Reson Imaging,2012,36(5):1011-1014.
doi: 10.1002/jmri.23741 pmid: 22777847 |
| [10] | STAREKOVA J, HERNANDO D, PICKHARDT P J, et al. Quantification of liver fat content with CT and MRI: state of the art[J]. Radiology,2021,301(2):250-262. |
| [11] |
JOHNSON T R, KRAUSS B, SEDLMAIR M, et al. Material differentiation by dual energy CT: initial experience[J]. Eur Radiol,2007,17(6):1510-1517.
doi: 10.1007/s00330-006-0517-6 pmid: 17151859 |
| [12] | DEMONDION E, ERNST O, LOUVET A, et al. Hepatic fat quantification in dual-layer computed tomography using a three-material decomposition algorithm[J]. Eur Radiol,2024,34(6):3708-3718. |
| [13] |
HUR B Y, LEE J M, HYUNSIK W, et al. Quantification of the fat fraction in the liver using dual-energy computed tomography and multimaterial decomposition[J]. J Comput Assist Tomogr,2014,38(6):845-852.
doi: 10.1097/RCT.0000000000000142 pmid: 25162291 |
| [14] | GASSENMAIER S, KäHM K, WALTER S S, et al. Quantification of liver and muscular fat using contrast-enhanced dual source dual energy computed tomography compared to an established multi-echo Dixon MRI sequence[J]. Eur J Radiol,2021,142:109845. |
| [15] |
MOLWITZ I, CAMPBELL G M, YAMAMURA J, et al. Fat quantification in dual-layer detector spectral computed tomography: Experimental Development and first in-patient validation[J]. Invest Radiol,2022,57(7):463-469.
doi: 10.1097/RLI.0000000000000858 pmid: 35148536 |
| [16] |
GOODSITT M M, CHRISTODOULOU E G, LARSON S C. Accuracies of the synthesized monochromatic CT numbers and effective atomic numbers obtained with a rapid kVp switching dual energy CT scanner[J]. Med Phys,2011,38(4):2222-2232.
pmid: 21626956 |
| [17] |
MILETO A, BARINA A, MARIN D, et al. Virtual monochromatic images from dual-energy multidetector CT: variance in CT numbers from the same lesion between single-source projection-based and dual-source image-based implementations[J]. Radiology,2016,279(1):269-277.
doi: 10.1148/radiol.2015150919 pmid: 26536403 |
| [18] | YANG Y, QIN L, LIN H, et al. Consistency of monoenergetic attenuation measurements for a clinical dual-source photon-counting detector CT system across scanning paradigms: a phantom study[J]. Am J Roentgenol,2024,222(5):e2330631. |
| [19] | SCHWARTZ F R, ASHTON J, WILDMAN-TOBRINER B, et al. Liver fat quantification in photon-counting CT in head to head comparison with clinical MRI-First experie-nce[J]. Eur J Radiol,2023,161:110734. |
| [20] | HOLLÝ S, CHMELíK M, SUCHá S, et al. Photon-counting CT using multi-material decomposition algorithm enables fat quantification in the presence of iron deposits[J]. Phys Med,2024,118:103210. |
| [21] |
Appropriate body-mass index for Asian populations and its implications for policy and intervention strategies[J]. Lancet,2004,363(9403):157-163.
doi: 10.1016/S0140-6736(03)15268-3 pmid: 14726171 |
| [22] | HERNANDO D, COOK R J, QAZI N, et al. Complex confounder-corrected R2* mapping for liver iron quantification with MRI[J]. Eur Radiol,2021,31(1):264-275. |
| [23] | SARI N, SUZANA M, MUSLIM M, et al. Analysis of the effect of Care Dose 4D software use on image quality and radiation dose on the ct scan abdomen[J]. Spektra: J Fisika dan Aplikasinya,2020,5:31-40. |
| [24] |
LIU X, YU L, PRIMAK A N, et al. Quantitative imaging of element composition and mass fraction using dual-energy CT: three-material decomposition[J]. Med Phys,2009,36(5):1602-1609.
doi: 10.1118/1.3097632 pmid: 19544776 |
| [25] | LISKA D, DUFOUR S, ZERN T L, et al. Interethnic diffe-rences in muscle, liver and abdominal fat partitioning in obese adolescents[J]. PLoS One,2007,2(6):e569. |
| [26] |
FLOHR T, SCHMIDT B. Technical basics and clinical benefits of photon-counting CT[J]. Invest Radiol,2023,58(7): 441-450.
doi: 10.1097/RLI.0000000000000980 pmid: 37185302 |
| [27] |
D'ADAMO E, NORTHRUP V, WEISS R, et al. Ethnic differences in lipoprotein subclasses in obese adolescents: importance of liver and intraabdominal fat accretion[J]. Am J Clin Nutr,2010,92(3):500-508.
doi: 10.3945/ajcn.2010.29270 pmid: 20573788 |
| [28] | CAO Q, YAN C, HAN X, et al. Quantitative evaluation of nonalcoholic fatty liver in rat by material decomposition techniques using rapid-switching dual energy CT[J]. Acad Radiol,2022,29(6):e91-e97. |
| [29] | CORRIAS G, ERTA M, SINI M, et al. Comparison of multimaterial decomposition fat fraction with DECT and proton density fat fraction with IDEAL IQ MRI for quantification of liver steatosis in a population exposed to chemotherapy[J]. Dose Response,2021,19(2):1559325820 984938. |
| [30] |
SALYAPONGSE A M, ROSE S D, PICKHARDT P J, et al. CT number accuracy and association with object size: a phantom study comparing energy-integrating detector CT and deep silicon photon-counting detector CT[J]. Am J Roentgenol,2023,221(4):539-547.
doi: 10.2214/AJR.23.29463 pmid: 37255042 |
| [31] |
KALRA M K, SODICKSON A D, MAYO-SMITH W W. CT radiation: Key concepts for gentle and wise use[J]. Radiographics,2015,35(6):1706-1721.
doi: 10.1148/rg.2015150118 pmid: 26466180 |
| [32] | MERGEN V, RACINE D, JUNGBLUT L, et al. Virtual noncontrast abdominal imaging with photon-counting detector CT [J]. Radiology,2022,305(1):107-115. |
| [33] |
SARTORETTI T, MERGEN V, HIGASHIGAITO K, et al. Virtual noncontrast imaging of the liver using photon-counting detector computed tomography: a systematic phantom and patient study[J]. Invest Radiol,2022,57(7):488-493.
doi: 10.1097/RLI.0000000000000860 pmid: 35136003 |
| [34] |
WILLEMINK M J, PERSSON M, POURMORTEZA A, et al. Photon-counting CT: technical principles and clinical prospects[J]. Radiology,2018,289(2):293-312.
doi: 10.1148/radiol.2018172656 pmid: 30179101 |
| [35] |
PICKHARDT P J, PARK S H, HAHN L, et al. Specificity of unenhanced CT for non-invasive diagnosis of hepatic steatosis: implications for the investigation of the natural history of incidental steatosis[J]. Eur Radiol,2012,22(5):1075-1082.
doi: 10.1007/s00330-011-2349-2 pmid: 22138733 |
| [36] |
BOLL D T, MERKLE E M. Diffuse liver disease: strategies for hepatic CT and MR imaging[J]. Radiographics,2009,29(6):1591-1614.
doi: 10.1148/rg.296095513 pmid: 19959510 |
| [1] | 赵然, 詹维伟, 李成, 汤海浪, 卜玉莲, 刘坤. 经直肠超声造影联合磁共振成像在中低位直肠癌T分期及治疗决策中的应用价值[J]. 诊断学理论与实践, 2025, 24(03): 293-300. |
| [2] | 黄瑞坤, 杨琰昭, 柴维敏. 光子计数CT在胰腺成像中的应用进展[J]. 诊断学理论与实践, 2025, 24(02): 111-117. |
| [3] | 李卫侠, 严福华. 光子计数CT在肝脏疾病中的应用进展[J]. 诊断学理论与实践, 2025, 24(02): 118-124. |
| [4] | 王梦真, 鲍守钰, 刘鹏, 严福华, 杨文洁. 光子计数CT在心血管疾病中的应用[J]. 诊断学理论与实践, 2025, 24(02): 125-134. |
| [5] | 常蕊, 李纪强, 杨琰昭, 柴维敏, 严福华, 董海鹏. 光子计数CT胰腺低剂量动态容积灌注扫描中单期图像对胰腺癌图像的评估价值[J]. 诊断学理论与实践, 2025, 24(02): 155-162. |
| [6] | 王康宁, 朱兰, 冯威铭, 夏益涵, 石博文, 张欢. 合成磁共振预测局部进展期直肠癌患者行新辅助放化疗疗效的价值[J]. 诊断学理论与实践, 2025, 24(02): 170-177. |
| [7] | 吕海英, 陆勇, 贺娜英. 光子计数CT在神经系统成像中的临床价值[J]. 诊断学理论与实践, 2025, 24(02): 212-219. |
| [8] | 周山税, 秦乐, 常蕊, 杜联军, 严福华, 刘方韬. 基于光子计数探测器CT能谱定位像定量评估股骨颈骨密度的前瞻性研究[J]. 诊断学理论与实践, 2025, 24(02): 163-169. |
| [9] | 张慧慧, 方姝, 吴梦雄, 刘方韬, 贺娜英, 董海鹏, 严福华. 深度学习重建技术在改善磁共振冠状位T1WI显示垂体神经内分泌肿瘤图像质量中的研究[J]. 诊断学理论与实践, 2024, 23(06): 594-601. |
| [10] | 赵新湘, 赵晓莹. 心脏磁共振在MINOCA患者管理中的应用规范和研究进展[J]. 诊断学理论与实践, 2024, 23(02): 101-107. |
| [11] | 冯原, 何钊, 孙青芳, 孙伯民, 严福华, 杨广中. 磁共振介入成像及其临床应用进展[J]. 诊断学理论与实践, 2024, 23(02): 108-113. |
| [12] | 查云飞, 武夏夏. MRI深度学习图像重建技术在肌骨系统疾病诊断的应用进展[J]. 诊断学理论与实践, 2024, 23(02): 114-118. |
| [13] | 刘伟, 林光武, 李仕红. 磁共振3D-SPACE神经成像显示腰骶丛肿瘤性病变的价值[J]. 诊断学理论与实践, 2024, 23(02): 126-130. |
| [14] | 高梦, 柴维敏, 严福华. 胰腺囊性肿瘤的CT/MRI诊断进展[J]. 诊断学理论与实践, 2024, 23(02): 184-191. |
| [15] | 李明, 陈克敏, 潘自来, 罗禹. CT及MRI预测急性缺血性脑梗死出血性转化的价值研究进展[J]. 诊断学理论与实践, 2024, 23(01): 83-89. |
| 阅读次数 | ||||||
|
全文 |
|
|||||
|
摘要 |
|
|||||