Journal of Diagnostics Concepts & Practice ›› 2025, Vol. 24 ›› Issue (02): 146-154.doi: 10.16150/j.1671-2870.2025.02.005
Previous Articles Next Articles
CAI Xinxin1, DENG Rong1, XU Xinxin1, XU Zhihan2, CHANG Rui1, DONG Haipeng1, LIN Huimin1, YAN Fuhua1,3( )
)
Received:2024-12-28
Accepted:2025-03-24
Online:2025-04-25
Published:2025-07-11
CLC Number:
CAI Xinxin, DENG Rong, XU Xinxin, XU Zhihan, CHANG Rui, DONG Haipeng, LIN Huimin, YAN Fuhua. Study on consistency between liver fat fraction quantification based on photon-counting CT and MRI proton density fat fraction[J]. Journal of Diagnostics Concepts & Practice, 2025, 24(02): 146-154.
Table 1
Participant Characteristics
| Item | Number/ Range | Mean ± Standard Deviation/ Median (Interquartile Range) |
|---|---|---|
| Age(year) | 19-87 | 42(30, 53) |
| Sex(n) | ||
| Male | 215 | / |
| Female | 168 | / |
| BMI(Kg/m2) | 17.13-47.91 | 25.44(22.86,28.07) |
| CT-FF(%) | (-4.2)-42.1 | 5.3(2.0,14.2) |
| MRI-PDFF(%) | 0.8-41.3 | 5.7(2.5,14.6) |
| Subgroups | ||
| Tube voltage (n) | ||
| 120 kVp | 194 | / |
| 140 kVp | 189 | / |
| Radiation dose (n) | ||
| Low dose | 140 | / |
| Standard dose | 243 | / |
| Effective dose(mSv) | ||
| Low dose | 0.56-4.11 | 1.23(1.02, 1.58) |
| Standard dose | 0.71-6.48 | 1.88(1.49, 2.60) |

Figure 1
Example of liver fat content measurement using PCCT and MRI-PDFFNote: Liver fat content measurement using PCCT (A) and MRI-PDFF (B) in a 29-year-old male with a body mass index (BMI) of 23.9 kg/m², where regions of interest (ROIs) are placed in the left lobe, right anterior lobe, and right posterior lobe of the liver.


Figure 2
The schematic diagram of the material decomposition principle of PCCT LiverVNC


Figure 3
Flowchart of study participants management and grouping


Figure 4
Scatter plot and Bland-Altman plot of CT-FF values versus PDFF valuesA‒D: Test cohort, A and B: Before threshold adjustment; C and D: After threshold adjustment. E and F: Validation cohort, after threshold adjustment.
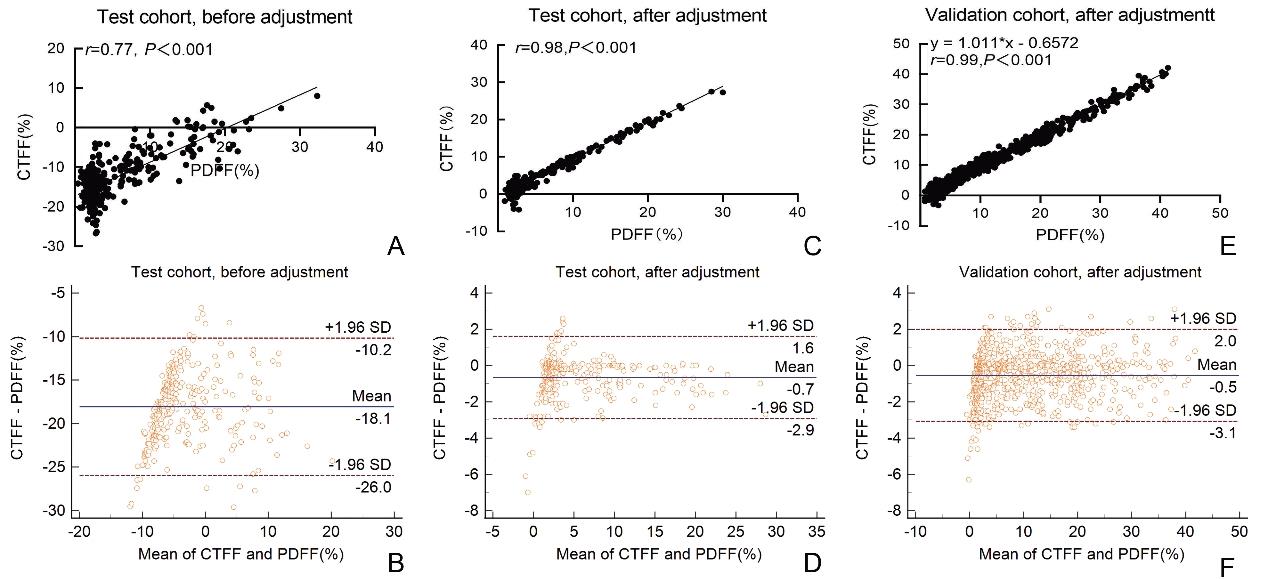
Table 2
Threshold values before and after adjustment for liver parenchyma and adipose tissue at different tube voltages and energy bins
| Adjustment | Tube voltage | Fat | Liver | ||
|---|---|---|---|---|---|
| Low energy | High energy | Low energy | High energy | ||
| Before | 120 kVp | -100 HU | -92 HU | 59 HU | 58 HU |
| 140 kVp | -100 HU | -92 HU | 59 HU | 58 HU | |
| After | 120 kVp | -127 HU | -96 HU | 65 HU | 70 HU |
| 140 kVp | -125 HU | -92 HU | 65 HU | 70 HU | |
Table 3
Comparison of CT-FF with PDFF in the validation cohort, including whole-group and subgroup analyses based on different tube voltages and radiation dose groups
| Analysis | Correlation | Consistency | Bland-Altman analysis | ||||
|---|---|---|---|---|---|---|---|
| r | r2 | Intraclass correlation (ICC) | Mean of bias | Limits of agreement (%) | |||
| ICC | 95%CI | ||||||
| Whole-group analysis | 0.99 | 0.98 | 0.991 | 0.989 to 0.992 | -0.5 | -3.1 to 2.0 | |
| Subgroup analysis | |||||||
| Tube voltage (kVp) | |||||||
| 120 | 0.99 | 0.98 | 0.991 | 0.989 to 0.992 | -0.4 | -3.1 to 2.3 | |
| 140 | 0.99 | 0.98 | 0.991 | 0.989 to 0.992 | -0.7 | -2.9 to 1.6 | |
| Radiation dose | |||||||
| Standard | 0.99 | 0.98 | 0.991 | 0.989 to 0.992 | -0.7 | -3.3 to 1.8 | |
| Low | 0.99 | 0.98 | 0.991 | 0.989 to 0.993 | -0.3 | -2.8 to 2.1 | |
| [1] |
WANG D Q, PORTINCASA P, NEUSCHWANDER-TETRI B A. Steatosis in the liver[J]. Compr Physiol,2013,3(4):1493-1532.
doi: 10.1002/cphy.c130001 pmid: 24265237 |
| [2] | RINELLA M E, LAZARUS J V, RATZIU V, et al. A multisociety Delphi consensus statement on new fatty liver disea-se nomenclature[J]. Ann Hepatol,2024,29(1):101133. |
| [3] |
MAN S, DENG Y, MA Y, et al. Prevalence of liver steatosis and fibrosis in the general population and various high-risk populations: a nationwide study with 5.7 million adults in china[J]. Gastroenterology,2023,165(4):1025-1040.
doi: 10.1053/j.gastro.2023.05.053 pmid: 37380136 |
| [4] |
WALKER R W, BELBIN G M, SOROKIN E P, et al. A common variant in PNPLA3 is associated with age at diagnosis of NAFLD in patients from a multi-ethnic biobank[J]. J Hepatol,2020,72(6):1070-1081.
doi: S0168-8278(20)30123-9 pmid: 32145261 |
| [5] |
YOUNOSSI Z M, KOENIG A B, ABDELATIF D, et al. Global epidemiology of nonalcoholic fatty liver disease-meta-analytic assessment of prevalence, incidence, and outcomes[J]. Hepatology,2016,64(1):73-84.
doi: 10.1002/hep.28431 pmid: 26707365 |
| [6] | DULAI P S, SINGH S, PATEL J, et al. Increased risk of mortality by fibrosis stage in nonalcoholic fatty liver di-sease: Systematic review and meta-analysis[J]. Hepatology,2017,65(5):1557-1565. |
| [7] | SEEFF L B, EVERSON G T, MORGAN T R, et al. Complication rate of percutaneous liver biopsies among persons with advanced chronic liver disease in the HALT-C trial[J]. Clin Gastroenterol Hepatol,2010,8(10):877-883. |
| [8] |
REGEV A, BERHO M, JEFFERS L J, et al. Sampling error and intraobserver variation in liver biopsy in patients with chronic HCV infection[J]. Am J Gastroenterol,2002,97(10):2614-2618.
doi: 10.1111/j.1572-0241.2002.06038.x pmid: 12385448 |
| [9] |
REEDER S B, HU H H, SIRLIN C B. Proton density fat-fraction: a standardized MR-based biomarker of tissue fat concentration[J]. J Magn Reson Imaging,2012,36(5):1011-1014.
doi: 10.1002/jmri.23741 pmid: 22777847 |
| [10] | STAREKOVA J, HERNANDO D, PICKHARDT P J, et al. Quantification of liver fat content with CT and MRI: state of the art[J]. Radiology,2021,301(2):250-262. |
| [11] |
JOHNSON T R, KRAUSS B, SEDLMAIR M, et al. Material differentiation by dual energy CT: initial experience[J]. Eur Radiol,2007,17(6):1510-1517.
doi: 10.1007/s00330-006-0517-6 pmid: 17151859 |
| [12] | DEMONDION E, ERNST O, LOUVET A, et al. Hepatic fat quantification in dual-layer computed tomography using a three-material decomposition algorithm[J]. Eur Radiol,2024,34(6):3708-3718. |
| [13] |
HUR B Y, LEE J M, HYUNSIK W, et al. Quantification of the fat fraction in the liver using dual-energy computed tomography and multimaterial decomposition[J]. J Comput Assist Tomogr,2014,38(6):845-852.
doi: 10.1097/RCT.0000000000000142 pmid: 25162291 |
| [14] | GASSENMAIER S, KäHM K, WALTER S S, et al. Quantification of liver and muscular fat using contrast-enhanced dual source dual energy computed tomography compared to an established multi-echo Dixon MRI sequence[J]. Eur J Radiol,2021,142:109845. |
| [15] |
MOLWITZ I, CAMPBELL G M, YAMAMURA J, et al. Fat quantification in dual-layer detector spectral computed tomography: Experimental Development and first in-patient validation[J]. Invest Radiol,2022,57(7):463-469.
doi: 10.1097/RLI.0000000000000858 pmid: 35148536 |
| [16] |
GOODSITT M M, CHRISTODOULOU E G, LARSON S C. Accuracies of the synthesized monochromatic CT numbers and effective atomic numbers obtained with a rapid kVp switching dual energy CT scanner[J]. Med Phys,2011,38(4):2222-2232.
pmid: 21626956 |
| [17] |
MILETO A, BARINA A, MARIN D, et al. Virtual monochromatic images from dual-energy multidetector CT: variance in CT numbers from the same lesion between single-source projection-based and dual-source image-based implementations[J]. Radiology,2016,279(1):269-277.
doi: 10.1148/radiol.2015150919 pmid: 26536403 |
| [18] | YANG Y, QIN L, LIN H, et al. Consistency of monoenergetic attenuation measurements for a clinical dual-source photon-counting detector CT system across scanning paradigms: a phantom study[J]. Am J Roentgenol,2024,222(5):e2330631. |
| [19] | SCHWARTZ F R, ASHTON J, WILDMAN-TOBRINER B, et al. Liver fat quantification in photon-counting CT in head to head comparison with clinical MRI-First experie-nce[J]. Eur J Radiol,2023,161:110734. |
| [20] | HOLLÝ S, CHMELíK M, SUCHá S, et al. Photon-counting CT using multi-material decomposition algorithm enables fat quantification in the presence of iron deposits[J]. Phys Med,2024,118:103210. |
| [21] |
Appropriate body-mass index for Asian populations and its implications for policy and intervention strategies[J]. Lancet,2004,363(9403):157-163.
doi: 10.1016/S0140-6736(03)15268-3 pmid: 14726171 |
| [22] | HERNANDO D, COOK R J, QAZI N, et al. Complex confounder-corrected R2* mapping for liver iron quantification with MRI[J]. Eur Radiol,2021,31(1):264-275. |
| [23] | SARI N, SUZANA M, MUSLIM M, et al. Analysis of the effect of Care Dose 4D software use on image quality and radiation dose on the ct scan abdomen[J]. Spektra: J Fisika dan Aplikasinya,2020,5:31-40. |
| [24] |
LIU X, YU L, PRIMAK A N, et al. Quantitative imaging of element composition and mass fraction using dual-energy CT: three-material decomposition[J]. Med Phys,2009,36(5):1602-1609.
doi: 10.1118/1.3097632 pmid: 19544776 |
| [25] | LISKA D, DUFOUR S, ZERN T L, et al. Interethnic diffe-rences in muscle, liver and abdominal fat partitioning in obese adolescents[J]. PLoS One,2007,2(6):e569. |
| [26] |
FLOHR T, SCHMIDT B. Technical basics and clinical benefits of photon-counting CT[J]. Invest Radiol,2023,58(7): 441-450.
doi: 10.1097/RLI.0000000000000980 pmid: 37185302 |
| [27] |
D'ADAMO E, NORTHRUP V, WEISS R, et al. Ethnic differences in lipoprotein subclasses in obese adolescents: importance of liver and intraabdominal fat accretion[J]. Am J Clin Nutr,2010,92(3):500-508.
doi: 10.3945/ajcn.2010.29270 pmid: 20573788 |
| [28] | CAO Q, YAN C, HAN X, et al. Quantitative evaluation of nonalcoholic fatty liver in rat by material decomposition techniques using rapid-switching dual energy CT[J]. Acad Radiol,2022,29(6):e91-e97. |
| [29] | CORRIAS G, ERTA M, SINI M, et al. Comparison of multimaterial decomposition fat fraction with DECT and proton density fat fraction with IDEAL IQ MRI for quantification of liver steatosis in a population exposed to chemotherapy[J]. Dose Response,2021,19(2):1559325820 984938. |
| [30] |
SALYAPONGSE A M, ROSE S D, PICKHARDT P J, et al. CT number accuracy and association with object size: a phantom study comparing energy-integrating detector CT and deep silicon photon-counting detector CT[J]. Am J Roentgenol,2023,221(4):539-547.
doi: 10.2214/AJR.23.29463 pmid: 37255042 |
| [31] |
KALRA M K, SODICKSON A D, MAYO-SMITH W W. CT radiation: Key concepts for gentle and wise use[J]. Radiographics,2015,35(6):1706-1721.
doi: 10.1148/rg.2015150118 pmid: 26466180 |
| [32] | MERGEN V, RACINE D, JUNGBLUT L, et al. Virtual noncontrast abdominal imaging with photon-counting detector CT [J]. Radiology,2022,305(1):107-115. |
| [33] |
SARTORETTI T, MERGEN V, HIGASHIGAITO K, et al. Virtual noncontrast imaging of the liver using photon-counting detector computed tomography: a systematic phantom and patient study[J]. Invest Radiol,2022,57(7):488-493.
doi: 10.1097/RLI.0000000000000860 pmid: 35136003 |
| [34] |
WILLEMINK M J, PERSSON M, POURMORTEZA A, et al. Photon-counting CT: technical principles and clinical prospects[J]. Radiology,2018,289(2):293-312.
doi: 10.1148/radiol.2018172656 pmid: 30179101 |
| [35] |
PICKHARDT P J, PARK S H, HAHN L, et al. Specificity of unenhanced CT for non-invasive diagnosis of hepatic steatosis: implications for the investigation of the natural history of incidental steatosis[J]. Eur Radiol,2012,22(5):1075-1082.
doi: 10.1007/s00330-011-2349-2 pmid: 22138733 |
| [36] |
BOLL D T, MERKLE E M. Diffuse liver disease: strategies for hepatic CT and MR imaging[J]. Radiographics,2009,29(6):1591-1614.
doi: 10.1148/rg.296095513 pmid: 19959510 |
| [1] | ZHAO Ran, ZHAN Weiwei, LI Cheng, TANG Hailang, BO Yulian, LIU Kun. Application value of transrectal contrast-enhanced ultrasound combined with magnetic resonance imaging in T staging and treatment decision-making for middle and low rectal cancer [J]. Journal of Diagnostics Concepts & Practice, 2025, 24(03): 293-300. |
| [2] | HUANG Ruikun, YANG Yanzhao, CHAI Weimin. Advances in application of photon-counting CT for pancreatic imaging [J]. Journal of Diagnostics Concepts & Practice, 2025, 24(02): 111-117. |
| [3] | CHANG Rui, LI Jiqiang, YANG Yanzhao, CHAI Weimin, YAN Fuhua, DONG Haipeng.. Evaluation value of single-phase images from photon-counting CT-based low-dose pancreatic dynamic volume perfusion scanning for pancreatic cancer imaging [J]. Journal of Diagnostics Concepts & Practice, 2025, 24(02): 155-162. |
| [4] | WANG Kangning, ZHU Lan, FENG Weiming, XIA Yihan, SHI Bowen, ZHANG Huan. Value of synthetic MRI in predicting treatment response to neoadjuvant chemoradiotherapy in patients with locally advanced rectal cancer [J]. Journal of Diagnostics Concepts & Practice, 2025, 24(02): 170-177. |
| [5] | LÜ Haiying, LU Yong, HE Naying. Clinical applications of photon-counting CT in neuroimaging [J]. Journal of Diagnostics Concepts & Practice, 2025, 24(02): 212-219. |
| [6] | ZHANG Huihui, FANG Shu, WU Mengxiong, LIU Fangtao, HE Naying, DONG Haipeng, YAN Fuhua. Study on deep learning reconstruction technology in improving image quality of pituitary neuroendocrine tumors in coronal T1WI magnetic resonance image [J]. Journal of Diagnostics Concepts & Practice, 2024, 23(06): 594-601. |
| [7] | FENG Yuan, HE Zhao, SUN Qingfang, SUN Bomin, YAN Fuhua, YANG Guangzhong. Advances in interventional magnetic resonance imaging and its clinical applications [J]. Journal of Diagnostics Concepts & Practice, 2024, 23(02): 108-113. |
| [8] | ZHA Yunfei, WU Xiaxia. Application and research progress of MRI deep learning image reconstruction technology in clinical diagnosis of musculoskeletal system diseases [J]. Journal of Diagnostics Concepts & Practice, 2024, 23(02): 114-118. |
| [9] | GAO Meng, CHAI Weimin, YAN Fuhua. Advance in study on diagnosis of pancreatic cystic tumors on CT/MRI imaging [J]. Journal of Diagnostics Concepts & Practice, 2024, 23(02): 184-191. |
| [10] | LI Ming, CHEN Kemin, PAN Zilai, LUO Yu. Research progress on the value of CT and MRI in predicting hemorrhagic transformation after acute ischemic stroke [J]. Journal of Diagnostics Concepts & Practice, 2024, 23(01): 83-89. |
| [11] | DING Jingfeng, AO Weiqun, ZHU Zhen, SUN Jing, XU Lianggen, ZHENG Shibao, YU Jingjing, HU Jinwen. The value of radiomics based on T2WI and DWI of MRI in preoperative prediction of extramural vascular invasion in rectal cancer [J]. Journal of Diagnostics Concepts & Practice, 2024, 23(01): 46-56. |
| [12] | ZHOU Yilei, ZHANG Miao, GUO Rui, ZHOU Jinxin, LI Biao, LI Xiang. Value of 18F-PSMA PET/MRI for early diagnosis of recurrence and metastasis in prostate cancer patients after radical prostatectomy [J]. Journal of Diagnostics Concepts & Practice, 2023, 22(06): 567-572. |
| [13] | FENG Li, REN Gang, CAI Rong, WANG Xinyun, WANG Hui, ZHU Mingjie. Clinical features study of perivascular epithelioid cell tumor (PEComa) in genitourinary system [J]. Journal of Diagnostics Concepts & Practice, 2023, 22(05): 460-465. |
| [14] | LI Xiaoshi, QIN Yue. Multiple radiology imaging techniques in the diagnosis of gout [J]. Journal of Diagnostics Concepts & Practice, 2023, 22(03): 311-318. |
| [15] | CHEN Qian, LIN Huimin, YAN Fuhua. Advances in the evaluation of hepatic function by magnetic resonance imaging [J]. Journal of Diagnostics Concepts & Practice, 2023, 22(02): 190-196. |
| Viewed | ||||||
|
Full text |
|
|||||
|
Abstract |
|
|||||